12 documents found
Guidance for the deployment of data portals. Good practices and recommendations
Open data portals help municipalities to offer structured and transparent access to the data they generate in the exercise of their functions and in the provision of the services they are responsible for, while also fostering the creation of applications, services and solutions that generate value…
- Guides

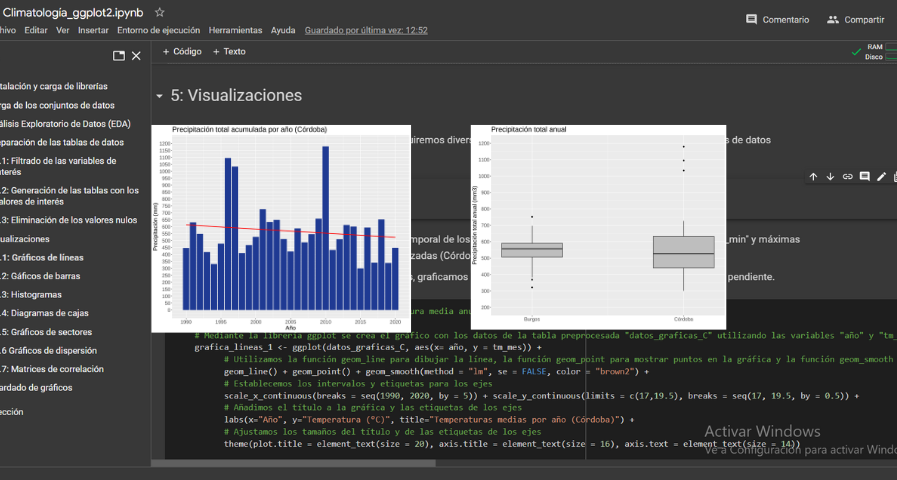
Analysis of meteorological data using the "ggplot2" library
1. Introduction
Visualizations are graphical representations of data that allow the information linked to them to be communicated in a simple and effective way. The visualization possibilities are very wide, from basic representations, such as a line chart, bars or sectors, to visualizations…
- Data exercises
Features for the creation of data spaces
A data space is an ecosystem where, on a voluntary basis, the data of its participants (public sector, large and small technology or business companies, individuals, research organizations, etc.) are pooled. Thus, under a context of sovereignty, trust and security, products or services can be…
- Guides

How to facilitate data collaboration to solve societal problems
Data are fundamental to solving the social and economic challenges we face today. It allows us to understand the causes behind a given situation and the factors that influence it, to estimate how it is evolving and to make informed decisions for change.
The problem is that solving such challenges…
- Reports and studies

Characteristics of the Spanish University students and most demanded degrees
1. Introduction
Visualizations are graphical representations of data that allow to transmit in a simple and effective way the information linked to them. The visualization potential is very wide, from basic representations, such as a graph of lines, bars or sectors, to visualizations configured on…
- Data exercises

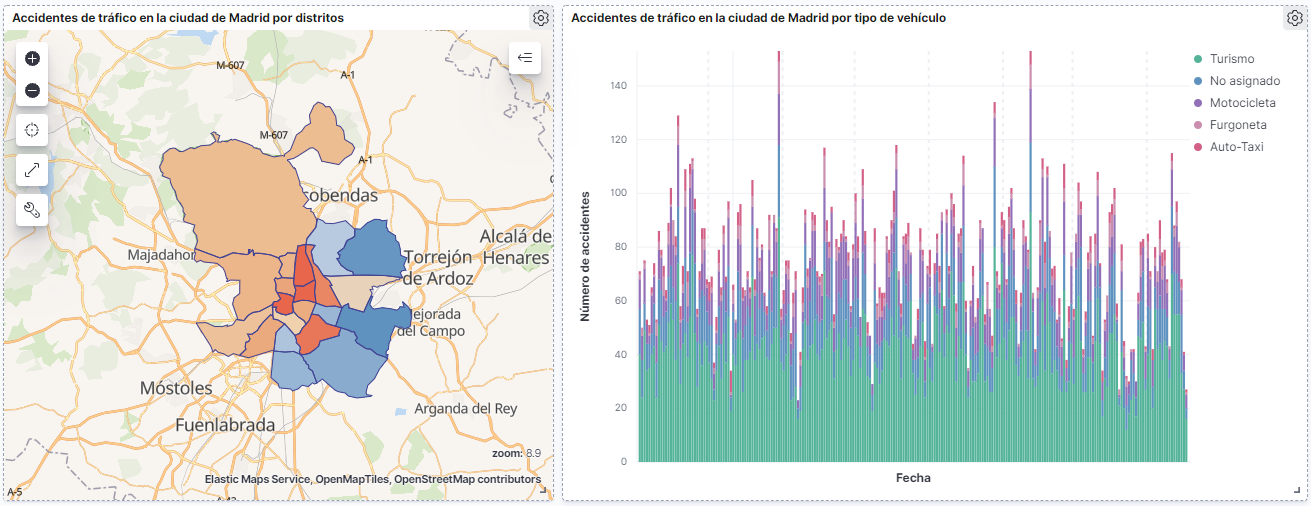
How many accidents occur in the city of Madrid?
1. Introduction
Data visualization is a task linked to data analysis that aims to graphically represent underlying data information. Visualizations play a fundamental role in the communication function that data possess, since they allow to drawn conclusions in a visual and understandable way,…
- Data exercises
Infographics: Aporta Challenges
The Aporta Challenges are awards for new ideas and prototypes that, making use of open data, lead to efficiency improvements in a specific sector of activity. In this section you will find infographics with information about the different editions carried out.
I Aporta challenge: The value of the…
- Infographics

Characterization of the employment demand and registered contracting in Spain
1. Introduction
Data visualization is a task linked to data analysis that aims to represent graphically the underlying information. Visualizations play a fundamental role in data communication, since they allow to draw conclusions in a visual and understandable way, also allowing detection of…
- Data exercises

Open data beyond the public sector
From its origins, the open data movement has been focused on opening up public sector data, and even the original statement of open data principles itself refers only to data from public administrations (open government data - OGD). However, this perception has evolved and today it is more common…
- Reports and studies

How to generate value from data: formats, techniques and tools to analyse open data
In the digital world, data becomes a fundamental asset for companies. Thanks to them, they can better understand their environment, business and competition, and make convenient decisions at the right time.
In this context, it is not surprising that an increasing number of companies are looking for…
- Reports and studies
