


Data Visualisation Guide for Local Authorities


Fecha del documento: 12-12-2022
The FEMP's Network of Local Entities for Transparency and Citizen Participation has just presented a guide focused on data visualisation. The document, which takes as a reference the Guide to data visualisation developed by the City Council of L'Hospitalet, has been prepared based on the search for good practices promoted by public and private organisations.
The guide includes recommendations and basic criteria to represent data graphically, facilitating its comprehension. In principle, it is aimed at all the entities that are members of the FEMP's Network of Local Entities for Transparency and Citizen Participation. However, it is also useful for anyone wishing to acquire a general knowledge of data visualisation.
Specifically, the guide has been developed with three objectives in mind:
- To provide principles and good practices in the field of data visualisation.
- To provide a model for the visualisation and communication of local authority data by standardising the use of different visual resources.
- Promote the principles of quality, simplicity, inclusiveness and ethics in data communication.
What does the guide include?
After a brief introduction, the guide begins with a series of basic concepts and general principles to be followed in data visualisation, such as the principle of simplification, the use of space or accessibility and exclusive design. Through graphic examples, the reader learns what to do and what not to do if we want our visualisation to be easily understood.
The guide then focuses on the different stages of designing a data visualisation through a sequential methodological process, as shown in the following diagram:
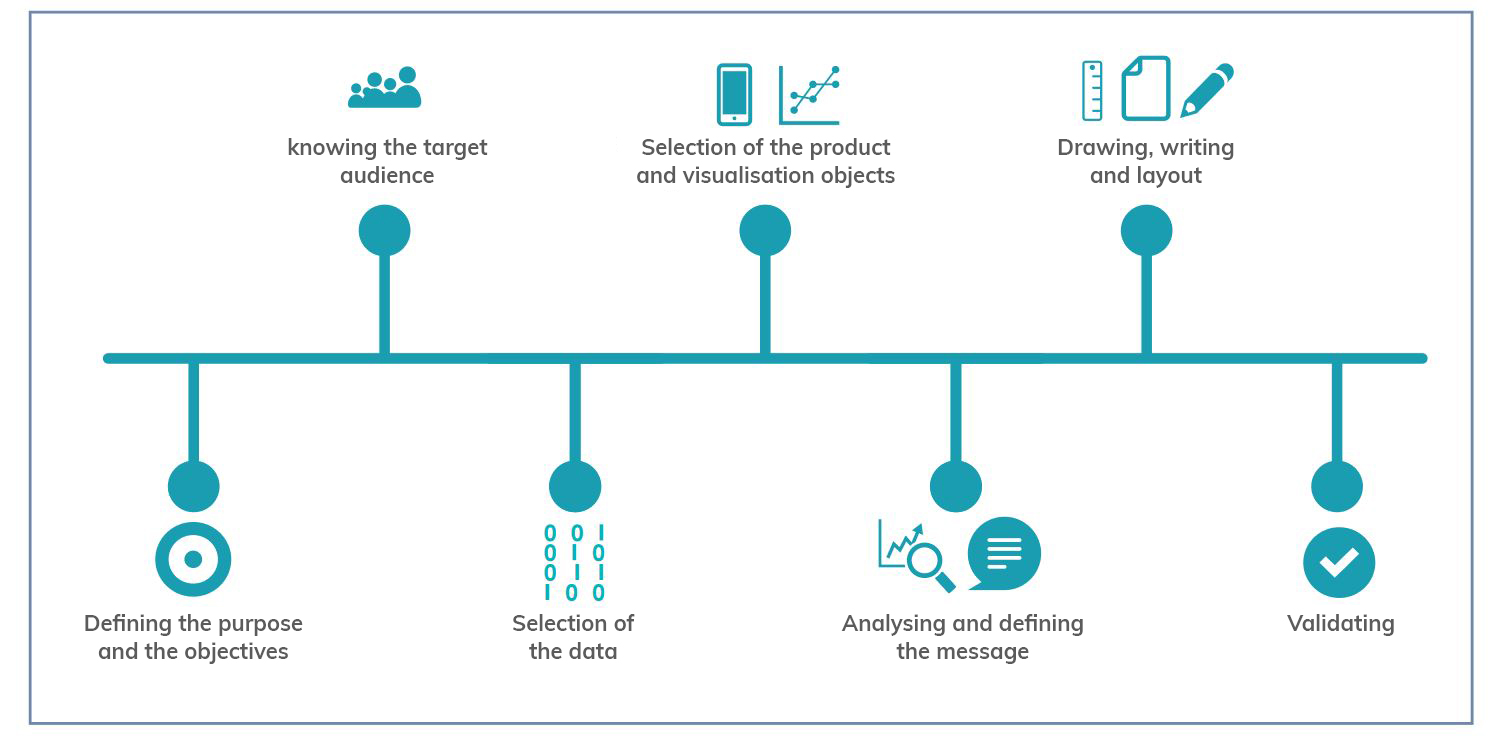
As the image shows, before developing the visualisation, it is essential to take the time to establish the objectives we want to achieve and the audience we are targeting, in order to tailor the message and select the most appropriate visualisation based on what we want to represent.
When representing data, users have at their disposal a wide variety of visualisation objects with different functions and performance. Not all objects are suitable for all cases and it will be necessary to determine the most appropriate one for each specific situation. In this sense, the guide offers several recommendations and guidelines so that the reader is able to choose the right element based on his or her objectives and audience, as well as the data he or she wants to display.
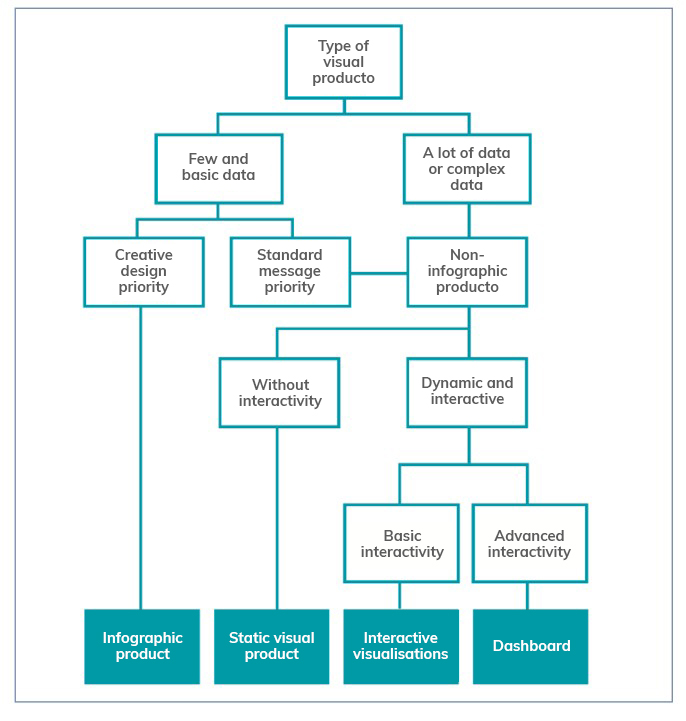
The following chapters focus on the various elements available (infographics, dashboards, indicators, tables, maps, etc.) showing the different subcategories that exist and the good practices to follow in their elaboration, showing numerous examples that facilitate their understanding. Recommendations on the use of the text are also provided.
The guide ends with a selection of resources for further knowledge and data visualisation tools to be considered by anyone who wants to start developing their own visualisations.
You can download the complete guide below, in the "Documentation" section.


