


How to integrate a visualization tool into a data platform


Fecha del documento: 02-12-2020

The saying "a picture is worth a thousand words" is a clear example of popular wisdom based on science. 90% of the information we process is visual, thanks to a million nerve fibers that link the eye to the brain and more than 20,000 million neurons that perform the processing of the impulses received at high speed. That is why we are able to remember 80% of the images we see, while in the case of text and sound the percentages are reduced to 20% and 10%, respectively.
These data explain the importance of data visualization in any sector of activity. It is not the same to tell how an indicator evolves, as to see it through visual elements, such as graphs or maps. Data visualization helps us understand complex concepts and is an accessible way to detect and understand trends and patterns in the data.
Data Visualization and Smart Cities
In the case of Smart Cities, where so much information is generated and captured, data visualization is fundamental. Throughout the length and breadth of a smart city, there are a large number of sensors and smart devices, with different detection capabilities, which generate a large amount of raw data. To give an example, only the city of Barcelona has more than 18,000 sensors spread throughout the city that capture millions of data. This data allows from real time monitoring of the environment to informed decision making or accountability. Visualizing this data through visual dashboards speeds up all these processes.
To help Smart Cities in this task, from the Open Cities project, led by Red.es and four city councils (A Coruña, Madrid, Santiago de Compostela and Zaragoza), a series of visualization tools have been selected and an extension has been developed for CKAN similar to the functionality "Open With Apps", initially designed for the Data.gov portal, which facilitates the integration with this type of tools.
The integration method inspired by "Open with Apps"
The idea behind "Open With Apps" is to allow integration with some third party services, for some formats published in the open data portals, such as CSV or XLS, without the need to download and upload data manually, through the APIs or URIs of the external service.
But not all display systems allow this functionality. Therefore, since the Open Cities project they have analyzed several platforms and online tools for creating visualizations and data analysis, and have selected 3 that meet the necessary characteristics for the described operation:
- The integration is done through links to websites without the need to download any software.
- In the invocation it is only necessary to pass as a parameter the download URL of the data file.
The result of this analysis has given rise to the report "Analysis and definition of specifications for integration with external visualization systems", where 3 tools that comply with these functionalities are highlighted.
3 simple data visualization and analysis tools
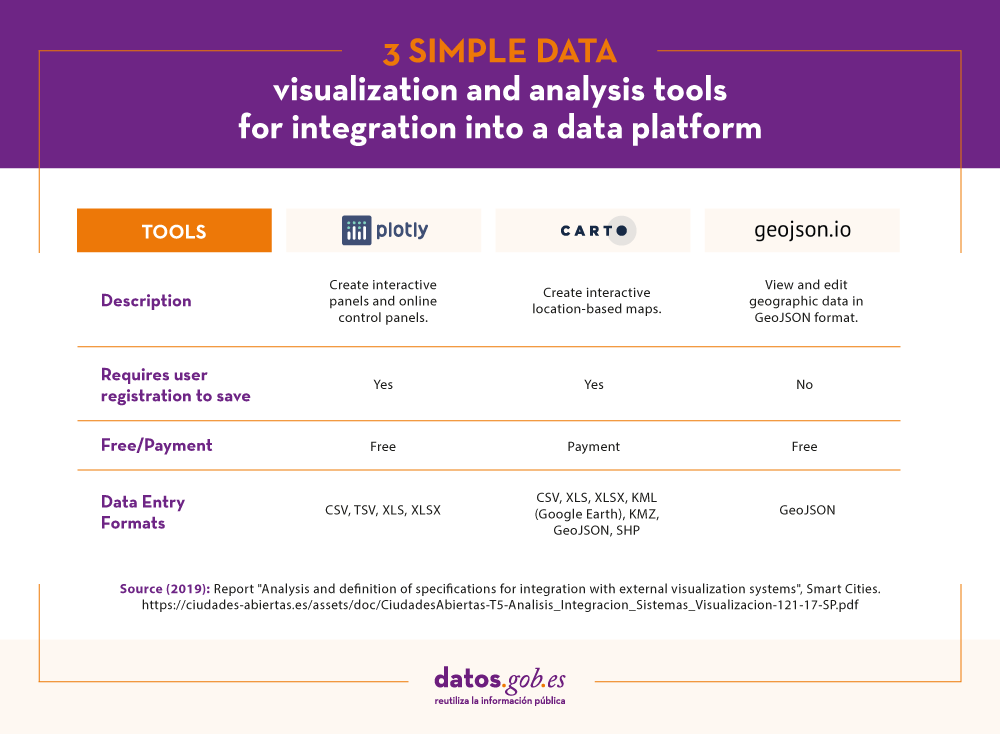
According to the aforementioned report, the 3 platforms that meet the necessary characteristics to achieve such operation are:
- Plotly: facilitates the creation of interactive data visualizations and control panels to share online with the audience. More advanced users can process data with any custom function, as well as create simulations with Python scripts. Supported formats are CSV, TSV, XLS and XLSX.
- Carto: formerly known as CartoDB, it generates interactive maps from geospatial data. The maps are automatically created and the user can filter and refine the data for more information. It accepts files in CSV, XLS, XLSX, KML (Google Earth), KMZ, GeoJSON and SHP formats.
- Geojson.io: allows to visualize and edit geographic data in GeoJSON format, as well as to export to a large number of formats.
For each of these tools the report includes a description of its requirements and limitations, its mode of use, a generic call and specific examples of calls along with the result obtained.
The "Open with" extension
As mentioned above, within the project a CKAN extension called "Open with" has also been developed. This extension allows to visualize the data files using the external visualization systems described above. It can be accessed through the project's GitHub account.
The report explains how to carry out its installation in a simple way, although if any doubt arises about its operation, users can contact Open Cities through the e-mail contacto@ciudadesabiertas.es.
Those interested in other CKAN extensions related to data visualization have at their disposal the report Analysis of the Visualization Extensions for CKAN, carried out within the framework of the same initiative. In the Gighub account, it is expected that examples of visualizations made will be published.
In short, data visualization is a fundamental leg of Smart Cities, and thanks to the work of the Open Cities team it will now be easier for any initiative to integrate simple data visualization solutions into their information management platforms.


