Blog
There is no doubt that digital skills training is necessary today. Basic digital skills are essential to be able to interact in a society where technology already plays a cross-cutting role. In particular, it is important to know the basics of the technology for working with data.
In this context, public sector workers must also keep themselves constantly updated. Training in this area is key to optimising processes, ensuring information security and strengthening trust in institutions.
In this post, we identify digital skills related to open data aimed at both publishing and using open data. Not only did we identify the professional competencies that public employees working with open data must have and maintain, we also compiled a series of training resources that are available to them.
Professional competencies for working with data
A working group was set up in 2024 National Open Data Gathering with one objective: to identify the digital competencies required of public administration professionals working with open data. Beyond conclusions of this event of national relevance, the working group defined profiles and roles needed for data opening, gathering information on their roles and the skills and knowledge required. The main roles identified were:
- Role responsible: has technical responsibility for the promotion of open data policies and organises activities to define policies and data models. Some of the skills required are:
- Leadership in promoting strategies to drive data openness.
- Driving the data strategy to drive openness with purpose.
- Understand the regulatory framework related to data in order to act within the law throughout the data lifecycle.
- Encourage the use of tools and processes for data management.
- Ability to generate synergies in order to reach a consensus on cross-cutting instructions for the entire organisation.
- Technical role of data entry technician (ICT profile): carries out implementation activities more closely linked to the management of systems, extraction processes, data cleansing, etc. EThis profile must have knowledge of, for example:
- How to structure the dataset, the metadata vocabulary, data quality, strategy to follow...
- Be able to analyse a dataset and identify debugging and cleaning processes quickly and intuitively.
- Generate data visualisations, connecting databases of different formats and origins to obtain dynamic and interactive graphs, indicators and maps.
- Master the functionalities of the platform, i.e. know how to apply technological solutions for open data management or know techniques and strategies to access, extract and integrate data from different platforms.
- Open data functional role (technician of a service): executes activities more related to the selection of data to be published, quality, promotion of open data, visualisation, data analytics, etc. For example:
- Handling visualisation and dynamisation tools.
- Knowing the data economy and knowing the information related to data in its full extent (generation by public administrations, open data, infomediaries, reuse of public information, Big Data, Data Driven, roles involved, etc.).
- To know and apply the ethical and personal data protection aspects that apply to the opening of data.
- Data use by public workers: this profile carries out activities on the use of data for decision making, basic data analytics, among others. In order to do so, it must have these competences:
- Navigation, search and filtering of data.
- Data assessment.
- Data storage and export
- Data analysis and exploitation.
In addition, as part of this challenge to increase capacities for open data, a list of free trainings and guides on open data and data analyticswas developed. We compile some of them that are available online and in open format.
| Institution | Resources | Link | Level |
|---|---|---|---|
| Knight Center for Journalism in the Americas | Data journalism and visualisation with free tools | https://journalismcourses.org/es/course/dataviz/ | Beginner |
| Data Europa Academy | Introduction to open data | https://data.europa.eu/en/academy/introducing-open-data | Beginner |
| Data Europa Academy | Understanding the legal side of open data | https://data.europa.eu/en/academy/understanding-legal-side-open-data | Beginner |
| Data Europa Academy | Improve the quality of open data and metadata | https://data.europa.eu/en/academy/improving-open-data-and-metadata-quality | Advanced |
| Data Europa Academy | Measuring success in open data initiatives | https://data.europa.eu/en/training/elearning/measuring-success-open-data-initiatives | Advanced |
| Escuela de Datos | Data Pipeline Course | https://escueladedatos.online/curso/curso-tuberia-de-datos-data-pipeline/ | Intermediate |
| FEMP | Strategic guidance for its implementation - Minimum data sets to be published | https://redtransparenciayparticipacion.es/download/guia-estrategica-para-su-puesta-en-marcha-conjuntos-de-datos-minimos-a-publicar/ | Intermediate |
| Datos.gob.es | Methodological guidelines for data opening | /es/conocimiento/pautas-metodologicas-para-la-apertura-de-datos | Beginner |
| Datos.gob.es | Practical guide to publishing open data using APIs |
/es/conocimiento/guia-practica-para-la-publicacion-de-datos-abiertos-usando-apis |
Intermediate |
| Datos.gob.es | Practical guide to publishing spatial data | /es/conocimiento/guia-practica-para-la-publicacion-de-datos-espaciales | Intermediate |
| Junta de Andalucía | Processing datasets with Open Refine | https://www.juntadeandalucia.es/datosabiertos/portal/tutoriales/usar-openrefine.html | Beginner |
Figure 1. Table of own elaboration with training resources. Source: https://encuentrosdatosabiertos.es/wp-content/uploads/2024/05/Reto-2.pdf
INAP''s continuing professional development training offer
The Instituto Nacional de Administración Pública (INAP) has a Training Activities Programme for 2025, framed in the INAP Learning Strategy 2025-2028.. This training catalogue includes more than 180 activities organised in different learning programmes, which will take place throughout the year with the aim of strengthening the competences of public staff in key areas such as open data management and the use of related technologies.
INAP''s 2025 training programme offers a wide range of courses aimed at improving digital skills and open data literacy. Some of the highlighted trainings include:
- Fundamentals and tools of data analysis.
- Introduction to Oracle SQL.
- Open data and re-use of information.
- Data analysis and visualisation with Power BI.
- Blockchain: technical aspects.
- Advanced Python programming.
These courses, aimed at different profiles of public employees, from open data managers to information management technicians, allow to acquire knowledge on data extraction, processing and visualisation, as well as on strategies for the opening and reuse of open data in the Public Administration. You can consult the full catalogue here..
Other training references
Some public administrations or entities offer training courses related to open data. For more information on its training offer, please see the catalogue with the programmed courses on offer.
- FEMP''s Network of Local Entities for Transparency and Citizen Participation: https://redtransparenciayparticipacion.es/.
- Government of Aragon: Aragon Open Data: https://opendata.aragon.es/informacion/eventos-de-datos-abiertos
- School of Public Administration of Catalonia (EAPC): https://eapc.gencat.cat/ca/inici/index.html#googtrans(ca|es
- Diputació de Barcelona: http://aplicacions.diba.cat/gestforma/public/cercador_baf_ens_locals
- Instituto Geográfico Nacional (IGN): https://cursos.cnig.es/
In short, training in digital skills, in general, and in open data, in particular, is a practice that we recommend at datos.gob.es. Do you need a specific training resource? Write to us in comments, we''ll read you!
Blog
Open source artificial intelligence (AI) is an opportunity to democratise innovation and avoid the concentration of power in the technology industry. However, their development is highly dependent on the availability of high quality datasets and the implementation of robust data governance frameworks. A recent report by Open Future and the Open Source Initiative (OSI) analyses the challenges and opportunities at this intersection, proposing solutions for equitable and accountable data governance. You can read the full report here.
In this post, we will analyse the most relevant ideas of the document, as well as the advice it offers to ensure a correct and effective data governance in artificial intelligence open source and take advantage of all its benefits.
The challenges of data governance in AI
Despite the vast amount of data available on the web, accessing and using it to train AI models poses significant ethical, legal and technical challenges. For example:
- Balancing openness and rights: In line with the Data Governance Regulation (DGA), broad access to data should be guaranteed without compromising intellectual property rights, privacy and fairness.
- Lack of transparency and openness standards: It is important that models labelled as "open" meet clear criteria for transparency in the use of data.
- Structural biases: Many datasets reflect linguistic, geographic and socio-economic biases that can perpetuate inequalities in AI systems.
- Environmental sustainability: the intensive use of resources to train AI models poses sustainability challenges that must be addressed with more efficient practices.
- Engage more stakeholders: Currently, developers and large corporations dominate the conversation on AI, leaving out affected communities and public organisations.
Having identified the challenges, the report proposes a strategy for achieving the main goal: adequate data governance in open source AI models. This approach is based on two fundamental pillars.
Towards a new paradigm of data governance
Currently, access to and management of data for training AI models is marked by increasing inequality. While some large corporations have exclusive access to vast data repositories, many open source initiatives and marginalised communities lack the resources to access quality, representative data. To address this imbalance, a new approach to data management and use in open source AI is needed. The report highlights two fundamental changes in the way data governance is conceived:
On the one hand, adopting a data commons approach which is nothing more than an access model that ensures a balance between data openness and rights protection.. To this end, it would be important to use innovative licences that allow data sharing without undue exploitation. It is also relevant to create governance structures that regulate access to and use of data. And finally, implement compensation mechanisms for communities whose data is used in artificial intelligence.
On the other hand, it is necessary to transcend the vision focused on AI developers and include more actors in data governance, such as:
- Data owners and content-generating communities.
- Public institutions that can promote openness standards.
- Civil society organisations that ensure fairness and responsible access to data.
By adopting these changes, the AI community will be able to establish a more inclusive system, in which the benefits of data access are distributed in a manner that is equitable and respectful of the rights of all stakeholders. According to the report, the implementation of these models will not only increase the amount of data available for open source AI, but will also encourage the creation of fairer and more sustainable tools for society as a whole.
Advice and strategy
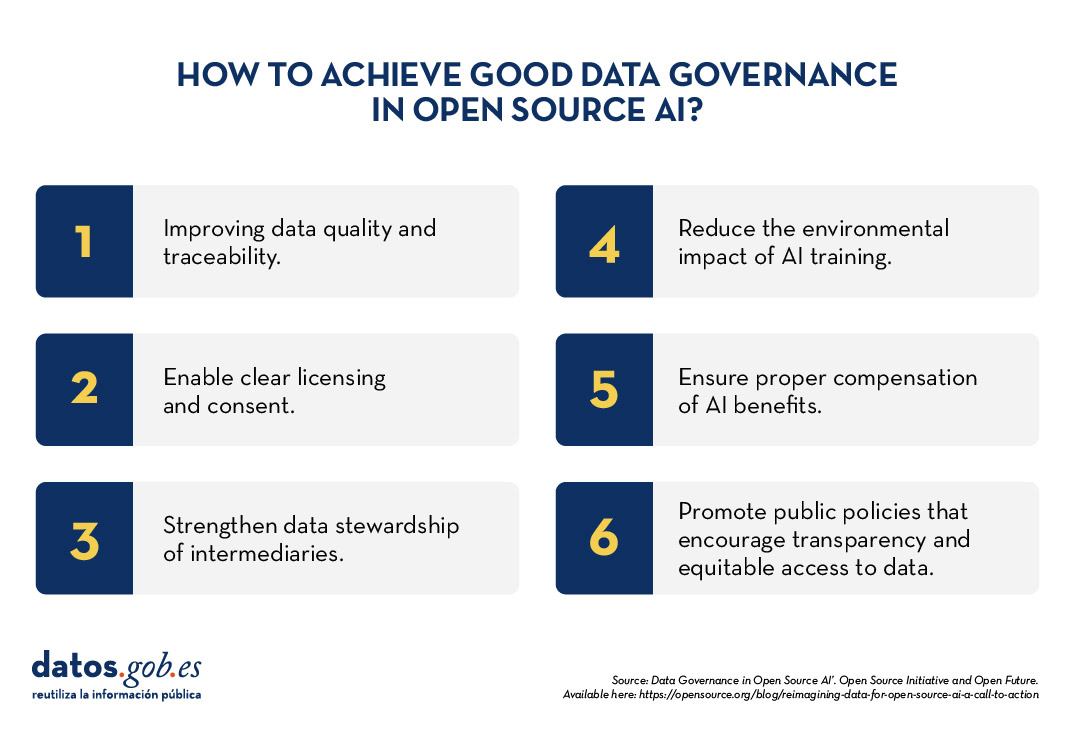
To make robust data governance effective in open source AI, the report proposes six priority areas for action:
- Data preparation and traceability: Improve the quality and documentation of data sets.
- Licensing and consent mechanisms: allow data creators to clearly define their use.
- Data stewardship: strengthen the role of intermediaries who manage data ethically.
- Environmental sustainability: Reduce the impact of AI training with efficient practices.
- Compensation and reciprocity: ensure that the benefits of AI reach those who contribute data.
- Public policy interventions: promote regulations that encourage transparency and equitable access to data.
Open source artificial intelligence can drive innovation and equity, but to achieve this requires a more inclusive and sustainable approach to data governance. Adopting common data models and broadening the ecosystem of actors will build AI systems that are fairer, more representative and accountable to the common good.
The report published by Open Future and Open Source Initiative calls for action from developers, policymakers and civil society to establish shared standards and solutions that balance open data with the protection of rights. With strong data governance, open source AI will be able to deliver on its promise to serve the public interest.
Documentación
Introduction
In previous content, we have explored in depth the exciting world of Large Language Models (LLM) and, in particular, the Retrieval Augmented Generation (RAG) techniques that are revolutionising the way we interact with conversational agents. This exercise marks a milestone in our series, as we will not only explain the concepts, but also guide you step-by-step in building your own RAG-powered conversational agent. For this, we will use a Google Colabnotebook.
Access the data lab repository on Github.
Execute the data pre-processing code on Google Colab.
Through this notebook, we will build a chat that uses RAG to improve its responses, starting from scratch. The notebook will guide the user through the whole process:
- Installation of dependencies.
- Setting up the environment.
- Integration of a source of information in the form of a post.
- Incorporation of this source into the chat knowledge base using RAG techniques.
- Finally, we can see how the model's response changes before and after providing the post and asking a specific question about its content.
Tools used
Before starting, it is necessary to introduce and explain which tools we have used and why we have chosen them. For the construction of this RAG application we have used 3 pieces of technology or tools: Google Colab, OpenAI y LangChain. Both Google Colab and OpenAI are old acquaintances and we have used them several times in previous content. Therefore, in this section, we pay special attention to explaining what LangChain is, as it is a new tool that we have not used in previous posts.
- Google Colab. As usual in our exercises, when computing resources are needed, as well as a user-friendly programming environment, we use Google Colab, as far as possible. Google Colab guarantees that any user who wants to reproduce the exercise can do so without complications derived from the configuration of the particular environments of each programmer. It should be noted that adapting this exercise inspired by previous resources available in LangChain to the Google Colab environment has been a challenge.
- OpenAI. As a provider of the Chat GPT large language model (LLM), OpenAI offers a variety of powerful language models, such as GPT-4, GPT-4o, GPT-4o mini, etc. that are used to process and generate natural language text. In this case, the OpenAI language model is used in the answer generation area, where the user's question and the retrieved documents are combined to produce an accurate answer.
- LangChain. It is an open source framework (set of libraries) designed to facilitate the development of large-scale language model (LLM) based applications. This framework is especially useful for integrating and managing complex flows that combine multiple components, such as language models, vector databases, and information retrieval tools, among others.
LangChain is widely used in the development of applications such as:
- Question and answer systems (QA systems).
- Virtual assistants with specific knowledge.
- Customised text generation systems.
- Data analysis tools based on natural language.
Key features of LangChain
- Modularity and flexibility. LangChain is designed with a modular architecture that allows developers to connect different tools and services. This includes language models (such as OpenAI, Hugging Face, or local LLM) and vector databases (such as Pinecone, ChromaDB or Weaviate). The List of chat models that can be interacted with through Langchain is extensive.
- Support for AGR (Generation Augmented Retrieval) techniques. Langhain facilitates the implementation of RAG techniques by enabling the direct integration of information retrieval and text generation models. This improves the accuracy of responses by enabling LLMs to work with up-to-date and specific knowledge.
- Optimising the handling of prompts. Langhain helps to design and manage complex prompts efficiently. It allows to dynamically build a relevant context that works with the model, optimising the use of tokens and ensuring that responses are accurate and useful.
- Tokens represent the basic units that an AI model uses to process text. A token can be a whole word, a part of a word or a punctuation mark. In the sentence "Hello world!" there are, for example, four different tokens: "Hello", "Hello", "World", "! Text processing requires more computational resources as the number of tokens increases. Free versions of AI models, including the one we use in this exercise, set limits on the number of tokens that can be processed.
- Integrate multiple data sources. The framework can connect to various data sources, such as databases, APIs or user uploaded documents. This makes it ideal for building applications that need access to large volumes of structured or unstructured information.
- Interoperability with multiple LLMs. LangChain is agnostic (can be adapted to various language model providers) with respect to the language model provider, which means that you can use OpenAI, Cohere, Anthropic or even locally hosted language models.
To conclude this section, it is worth noting the open source nature of Langhain, which facilitates collaboration and innovation in the development of applications based on language models. In addition, LangChain gives us incredible flexibility because it allows developers to easily integrate different LLMs, vectorisers and even final web interfaces into their applications.
Step-by-step exploration of the exercise: introduction to the Repository
The Github repository that we will use contains all the resources needed to build our RAG application. Inside, you will find:
- README: this file provides an overview of the project, instructions for use and additional resources.
- Jupyter Notebook: the example has been developed using a Jupyter Notebook format that we have already used in the past to code practical exercises combining a text document with code snippets executable in Google Colab. Here is the detailed implementation of the application, including data loading and processing, integration with language models such as GPT-44, configuration of information retrieval systems and generation of responses based on the retrieved data.
Notebook: preparing the Environment
Before starting, it is advisable to have the following requirements.
- Basic knowledge of Python and Natural Language Processing (NLP): although the notebook is self-explanatory, a basic understanding of these concepts will facilitate learning.
- Access to Google Colab: the notebook runs in this environment, which provides the necessary infrastructure.
- Accounts active in OpenAI and LangChain with valid API keys. These services are free and essential for running the notebook. Once you register with these services, you will need to generate an API Key to interact with the services. You will need to have this key handy so that you can paste it when executing the corresponding code snippet. If you need help to get these keys, any conversational assistant such as chatGPT or Google Gemini can help you step-by-step to get the keys. If you need visual guidance on youtube you will find thousands of tutorials.
- OpenAI API: https://openai.com/api/
- Lanchain API: https://www.langchain.com/
Exploring the Notebook: block by block
The notebook is divided into several blocks, each dedicated to a specific stage of the development of our RAG application. In the following, we will describe each block in detail, including the code used and its explanation.
Note to user. In the following, we are going to reproduce blocks of the code present in the Colab notebook. For clarity we have divided the code into self-contained units and formatted the code to highlight the syntax of the Python programming language. In addition, the outputs provided by the Notebook have been formatted and highlighted in JSON format to make them more readable. Note that this Notebook invokes language model APIs and therefore the model response changes with each run. This means that the outputs (the answers) presented in this post may not be exactly the same as what the user receives when running the Notebook in Colab.
Block 1: Installation and initial configuration
|
import os |
It is very important that you run these two lines at the beginning of the exercise and then do not run it again until you close and exit Google Colab.
|
%%capture |
|
!pip install langchain --quiet |
|
import getpass os.environ["LANGCHAIN_TRACING_V2"] = "true" |
When you run this snippet, a small dialogue box will appear below the snippet. There you must paste your Langchain API Key.
|
!pip install -qU langchain-openai |
|
import getpass |
When you run this snippet, a small dialogue box will appear below the snippet. There you must paste your OpenAI API Key.
In this first block, we have installed the necessary libraries for our project. Some of the most relevant are:
- openai: To interact with the OpenAI API and access models such as GPT-4.
- langchain: A framework that simplifies LLM application development.
- langchain-text-splitters: To break up long texts into smaller fragments that can be processed by language models.
- langchain-community: A collection of additional tools and components for LangChain.
- langchain-openai: To integrate LangChain with the OpenAI API.
- langgraph: To visualise the workflow of our RAG application.
- In addition to installing the libraries, we also set up the API keys for OpenAI and LangChain, using the getpass.getpass() function to enter them securely.
Block 2: Initialising the interaction with the LLM
Next, we start the first programmatic interaction (we pass our first prompt) with the language model. To check that everything works, we ask you to translate a simple sentence.
|
import getpass import os ] |
If everything went well we will get an output like this:
|
{ |
This block is a basic introduction to using an LLM for a simple task: translation. The OpenAI API key is configured and a gpt-4o-mini language model is instantiated using ChatOpenAI.
Two messages are defined:
- SystemMessage: Instruction to the model for translating from English into Italian.
- HumanMessage: The text to be translated ("hi!").
Finally, the model is invoked with llm.invoke(messages) to get the translation.
Block 3: Creating Embeddings
To understand the concept of Embeddings applied to the context of natural language processing, we recommend reading this post.
|
import getpass pip install -qU langchain-core from langchain_core.vectorstores import InMemoryVectorStore |
When you run this snippet, a small dialogue box will appear below the snippet. There you must paste your OpenAI API Key.
This block focuses on the creation of embeddings (vector representations of text) that capture their semantic meaning. We use the OpenAIEmbeddings class to access OpenAI's text-embedding-3-large model, which generates high-quality embeddings .
The embeddings will be stored in an InMemoryVectorStore, an in-memory data structure that allows efficient searches based on semantic similarity.
Block 4: Implementing RAG
|
#RAG import bs4 from langchain_community.document_loaders import WebBaseLoader # Manten únicamente el título del post, los encabezados y el contenido del HTML bs4_strainer = bs4.SoupStrainer(class_=("post-title", "post-header", "post-content")) loader = WebBaseLoader( web_paths=("https://datos.gob.es/es/blog/slm-llm-rag-y-fine-tuning-pilares-de-la-ia…",) ) docs = loader.load() assert len(docs) == 1 print(f"Total characters: {len(docs.page_content)}") from langchain_text_splitters import RecursiveCharacterTextSplitter text_splitter = RecursiveCharacterTextSplitter( chunk_size=1000, chunk_overlap=200, add_start_index=True, ) all_splits = text_splitter.split_documents(docs) print(f"Split blog post into {len(all_splits)} sub-documents.") document_ids = vector_store.add_documents(documents=all_splits) print(document_ids[:3]) |
This block is the heart of the RAG implementation. Start loading the content of a post, using WebBaseLoader and the URL of the post on SLM, LLM, RAG and Fine-tuning..
To prepare our Generation Augmented Retrieval (GAR) system, we start by processing the text of the post using segmentation techniques. This initial step is crucial, as we break down the content into smaller fragments that are complete in meaning. We use LangChain tools to perform this segmentation, assigning each fragment a unique identifier (id). This prior preparation allows us to subsequently perform efficient and accurate searches when the system needs to retrieve relevant information to answer queries.
The bs4.SoupStrainer is used to extract only the relevant sections of the HTML. The text of the post is split into smaller fragments with RecursiveCharacterTextSplitter, ensuring overlap between fragments to maintain context. These fragments are added to the vector_store created in the previous block, generating embeddings for each one.
We see that the result of one of the fragments informs us that it has split the document into 21 sub-documents.
|
Split blog post into 21 sub-documents. |
Documents have their own identifier. For example, the first 3 are identified as:.
|
["409f1bcb-1710-49b0-80f8-e45b7ca51a96", "e242f16c-71fd-4e7b-8b28-ece6b1e37a1c", "9478b11c-61ab-4dac-9903-f8485c4770c6"] |
Block 5: Defining the Prompt and visualising the workflow
|
from langchain import hub prompt = hub.pull("rlm/rag-prompt") example_messages = prompt.invoke( {"context": "(context goes here)", "question": "(question goes here)"} ).to_messages() assert len(example_messages) == 1 print(example_messages.content) from langchain_core.documents import Document from typing_extensions import List, TypedDict class State(TypedDict): question: str context: List[Document] answer: str def retrieve(state: State): retrieved_docs = vector_store.similarity_search(state["question"]) return {"context": retrieved_docs} def generate(state: State): docs_content = "\n\n".join(doc.page_content for doc in state["context"]) messages = prompt.invoke({"question": state["question"], "context": docs_content}) response = llm.invoke(messages) return {"answer": response.content} from langgraph.graph import START, StateGraph graph_builder = StateGraph(State).add_sequence([retrieve, generate]) graph_builder.add_edge(START, "retrieve") graph = graph_builder.compile() from IPython.display import Image, display display(Image(graph.get_graph().draw_mermaid_png())) result = graph.invoke({"question": "What is Task Decomposition?"}) print(f"Context: {result["context"]}\n\n") print(f"Answer: {result["answer"]}") for step in graph.stream( {"question": "¿Cual es el futuro de la IA Generativa?"}, stream_mode="updates" ): print(f"{step}\n\n----------------\n") |
This block defines the prompt to be used to interact with the LLM. A predefined LangChain Hub prompt (rlm/rag-prompt) is used which is designed for RAG tasks.
Two functions are defined:
- retrieve: search the vector_store for snippets most similar to the user's question.
- generate: generates a response using the LLM, taking into account the context provided by the retrieved fragments.
langgraph is used to visualise the RAG workflow.
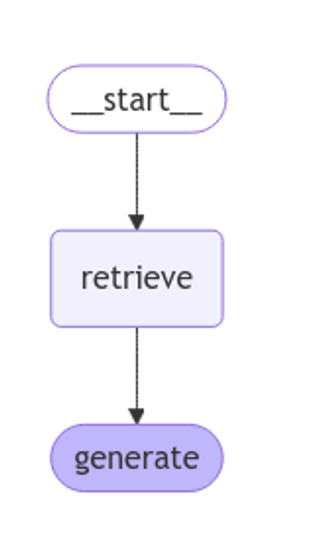
Figure 1: RAG workflow. Own elaboration.
Finally, the system is tested with two questions: one in English ("What is Task Decomposition?") and one in Spanish ("¿Cual es el futuro de la AI Generativa?").
The first question, "What is Task Decomposition?", is in English and is a generic question, unrelated to our content post. Therefore, although the system searches in its knowledge base previously created with the vectorisation of the document (post), it does not find any relation between the question and this context.
This text may vary with each execution
|
Answer: There is no explicit mention of the concept of "Task Decomposition" in the context provided. Therefore, I have no information on what Task Decomposition is. |
|
Answer: Task Decomposition is a process that decomposes a complex task into smaller, more manageable sub-tasks. This allows each subtask to be addressed independently, facilitating their resolution and improving overall efficiency. Although the context provided does not explicitly define Task Decomposition, this concept is common in AI and task optimisation. |
Answer: Task Decomposition is a process that decomposes a complex task into smaller, more manageable sub-tasks. This allows each subtask to be addressed independently, facilitating their resolution and improving overall efficiency. Although the context provided does not explicitly define Task Decomposition, this concept is common in AI and task optimisation.
|
{ |
As you can see in the response, the system retrieves 4 documents (in the diagram above, this corresponds to the "Retrieve" stage) with their corresponding "id" (identifiers), for example, the first document "id":. "53962c40-c08b-4547-a74a-26f63cced7e8" which corresponds to a fragment of the original post "title":. "SLM, LLM, RAG and Fine-tuning: Pillars of Modern Generative AI | datos.gob.es".
With these 4 fragments the system considers that it has enough relevant information to provide (in the diagram above, the "generate" stage) a satisfactory answer to the question.
|
{ |
Bloque 6: personalizando el prompt
|
from langchain_core.prompts import PromptTemplate template = """Use the following pieces of context to answer the question at the end. If you don"t know the answer, just say that you don"t know, don"t try to make up an answer. Use three sentences maximum and keep the answer as concise as possible. Always say "thanks for asking!" at the end of the answer. {context} Question: {question} Helpful Answer:""" custom_rag_prompt = PromptTemplate.from_template(template) |
This block customises the prompt to make answers more concise and add a polite sentence at the end. PromptTemplate is used to create a new prompt with the desired instructions.
Block 7: Adding metadata and refining your search
|
total_documents = len(all_splits) third = total_documents // 3 for i, document in enumerate(all_splits): if i < third: document.metadata["section"] = "beginning" elif i < 2 * third: document.metadata["section"] = "middle" else: document.metadata["section"] = "end" all_splits.metadata from langchain_core.vectorstores import InMemoryVectorStore vector_store = InMemoryVectorStore(embeddings) _ = vector_store.add_documents(all_splits) from typing import Literal from typing_extensions import Annotated class Search(TypedDict): """Search query.""" query: Annotated[str, ..., "Search query to run."] section: Annotated( Literal["beginning", "middle", "end"], ..., "Section to query.", ] class State(TypedDict): question: str query: Search context: List[Document] answer: str def analyze_query(state: State): structured_llm = llm.with_structured_output(Search) query = structured_llm.invoke(state["question"]) return {"query": query} def retrieve(state: State): query = state["query"] retrieved_docs = vector_store.similarity_search( query["query"], filter=lambda doc: doc.metadata.get("section") == query["section"], ) return {"context": retrieved_docs} def generate(state: State): docs_content = "\n\n".join(doc.page_content for doc in state["context"]) messages = prompt.invoke({"question": state["question"], "context": docs_content}) response = llm.invoke(messages) return {"answer": response.content} graph_builder = StateGraph(State).add_sequence([analyze_query, retrieve, generate]) graph_builder.add_edge(START, "analyze_query") graph = graph_builder.compile() display(Image(graph.get_graph().draw_mermaid_png())) for step in graph.stream( {"question": "¿Cual es el furturo de la IA Generativa en palabras del autor?"}, stream_mode="updates", ): print(f"{step}\n\n----------------\n") |
In this block, metadata is added to the post fragments, dividing them into three sections: "beginning", "middle" and "end". This allows for more refined searches, limiting the search to a specific section of the post.
A new analyze_query function is introduced that uses the LLM to determine the section of the post most relevant to the user's question. The RAG workflow is updated to include this new step.
Finally, the system is tested with a question in Spanish ("What is the future of Generative AI in the author's words?"), observing how the system uses the information in the "end" section of the post to generate a more accurate answer.
Let's look at the result:

Figure 2: RAG workflow. Own elaboration.
|
{ ---------------- { |
|
{ |
Conclusions
Through this notebook tour of Google Colab, we have experienced first-hand the construction of a conversational agent with RAG. We have learned to:
- Install the necessary libraries.
- Configure the development environment.
- Upload and process data.
- Create embeddings and store them in a vector_store.
- Implement the RAG recovery and generation stages.
- Customise the prompt to get more specific answers.
- Add metadata to refine the search.
This practical exercise provides you with the tools and knowledge you need to start exploring the potential of RAG and develop your own applications.
Dare to experiment with different information sources, language models and prompts to create increasingly sophisticated conversational agents!
Content prepared by Alejandro Alija, expert in Digital Transformation and Innovation. The contents and points of view reflected in this publication are the sole responsibility of its author.
Documentación
Open data portals are an invaluable source of public information. However, extracting meaningful insights from this data can be challenging for users without advanced technical knowledge.
In this practical exercise, we will explore the development of a web application that democratizes access to this data through the use of artificial intelligence, allowing users to make queries in natural language.
The application, developed using the datos.gob.es portal as a data source, integrates modern technologies such as Streamlit for the user interface and Google's Gemini language model for natural language processing. The modular nature allows any Artificial Intelligence model to be used with minimal changes. The complete project is available in the Github repository.
Access the data laboratory repository on Github.
Run the data preprocessing code on Google Colab.
In this video, the author explains what you will find both on Github and Google Colab.
Application Architecture
The core of the application is based on four main interconnected sections that work together to process user queries:
- Context Generation
- Analyzes the characteristics of the chosen dataset.
- Generates a detailed description including dimensions, data types, and statistics.
- Creates a structured template with specific guidelines for code generation.
- Context and Query Combination
- Combines the generated context with the user's question, creating the prompt that the artificial intelligence model will receive.
- Response Generation
- Sends the prompt to the model and obtains the Python code that allows solving the generated question.
- Code Execution
- Safely executes the generated code with a retry and automatic correction system.
- Captures and displays the results in the application frontend.

Figure 1. Request processing flow
Development Process
The first step is to establish a way to access public data. The datos.gob.es portal offers datasets via API. Functions have been developed to navigate the catalog and download these files efficiently.
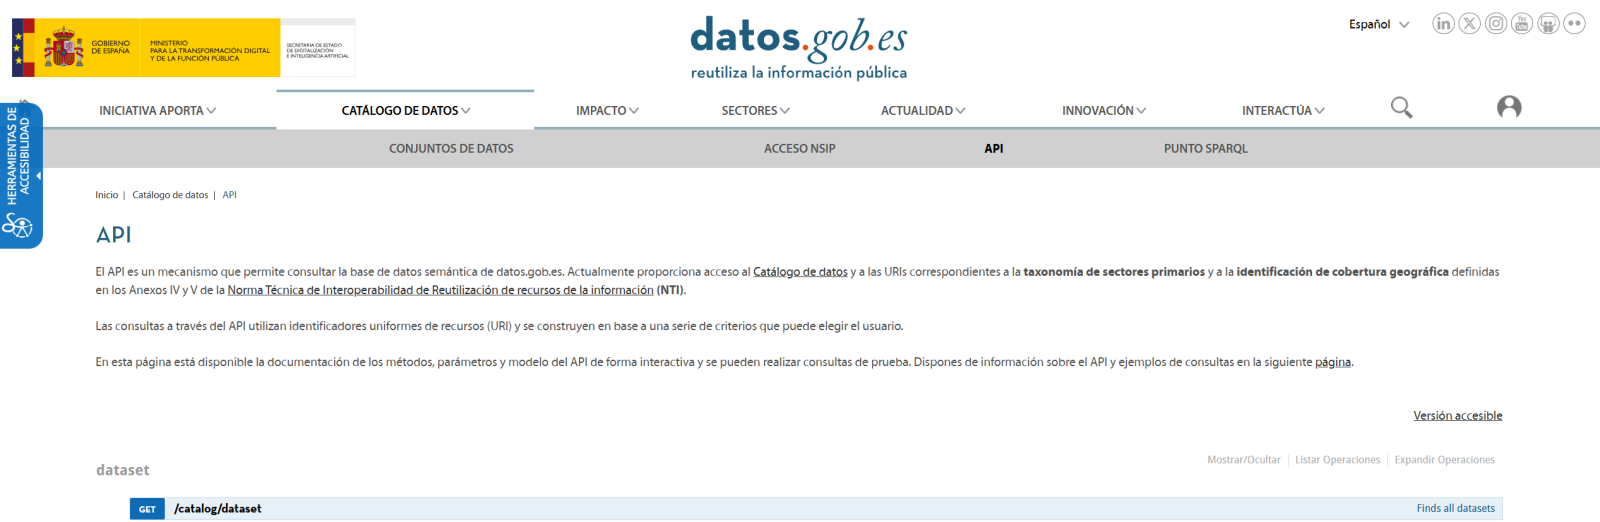
Figura 2. API de datos.gob
The second step addresses the question: how to convert natural language questions into useful data analysis? This is where Gemini, Google's language model, comes in. However, it's not enough to simply connect the model; it's necessary to teach it to understand the specific context of each dataset.
A three-layer system has been developed:
- A function that analyzes the dataset and generates a detailed "technical sheet".
- Another that combines this sheet with the user's question.
- And a third that translates all this into executable Python code.
You can see in the image below how this process develops and, subsequently, the results of the generated code are shown once executed.

Figure 3. Visualization of the application's response processing
Finally, with Streamlit, a web interface has been built that shows the process and its results to the user. The interface is as simple as choosing a dataset and asking a question, but also powerful enough to display complex visualizations and allow data exploration.
The final result is an application that allows anyone, regardless of their technical knowledge, to perform data analysis and learn about the code executed by the model. For example, a municipal official can ask "What is the average age of the vehicle fleet?" and get a clear visualization of the age distribution.

Figure 4. Complete use case. Visualizing the distribution of registration years of the municipal vehicle fleet of Almendralejo in 2018
What Can You Learn?
This practical exercise allows you to learn:
- AI Integration in Web Applications:
- How to communicate effectively with language models like Gemini.
- Techniques for structuring prompts that generate precise code.
- Strategies for safely handling and executing AI-generated code.
- Web Development with Streamlit:
- Creating interactive interfaces in Python.
- Managing state and sessions in web applications.
- Implementing visual components for data.
- Working with Open Data:
- Connecting to and consuming public data APIs.
- Processing Excel files and DataFrames.
- Data visualization techniques.
- Development Best Practices:
- Modular structuring of Python code.
- Error handling and retries.
- Implementation of visual feedback systems.
- Web application deployment using ngrok.
Conclusions and Future
This exercise demonstrates the extraordinary potential of artificial intelligence as a bridge between public data and end users. Through the practical case developed, we have been able to observe how the combination of advanced language models with intuitive interfaces allows us to democratize access to data analysis, transforming natural language queries into meaningful analysis and informative visualizations.
For those interested in expanding the system's capabilities, there are multiple promising directions for its evolution:
- Incorporation of more advanced language models that allow for more sophisticated analysis.
- Implementation of learning systems that improve responses based on user feedback.
- Integration with more open data sources and diverse formats.
- Development of predictive and prescriptive analysis capabilities.
In summary, this exercise not only demonstrates the feasibility of democratizing data analysis through artificial intelligence, but also points to a promising path toward a future where access to and analysis of public data is truly universal. The combination of modern technologies such as Streamlit, language models, and visualization techniques opens up a range of possibilities for organizations and citizens to make the most of the value of open data.
Blog
Artificial Intelligence (AI) is no longer a futuristic concept and has become a key tool in our daily lives. From movie or series recommendations on streaming platforms to virtual assistants like Alexa or Google Assistant on our devices, AI is everywhere. But how do you build an AI model? Despite what it might seem, the process is less intimidating if we break it down into clear and understandable steps.
Step 1: Define the problem
Before we start, we need to be very clear about what we want to solve. AI is not a magic wand: different models will work better in different applications and contexts so it is important to define the specific task we want to execute. For example, do we want to predict the sales of a product? Classify emails as spam or non-spam? Having a clear definition of the problem will help us structure the rest of the process.
In addition, we need to consider what kind of data we have and what the expectations are. This includes determining the desired level of accuracy and the constraints of available time or resources.
Step 2: Collect the data
The quality of an AI model depends directly on the quality of the data used to train it. This step consists of collecting and organising the data relevant to our problem. For example, if we want to predict sales, we will need historical data such as prices, promotions or buying patterns.
Data collection starts with identifying relevant sources, which can be internal databases, sensors, surveys... In addition to the company's own data, there is a wide ecosystem of data, both open and proprietary, that can be drawn upon to build more powerful models. For example, the Government of Spain makes available through the datos.gob.es portal multiple sets of open data published by public institutions. On the other hand, Amazon Web Services (AWS) through its AWS Data Exchange portal allows access and subscription to thousands of proprietary datasets published and maintained by different companies and organisations.
The amount of data required must also be considered here. AI models often require large volumes of information to learn effectively. It is also crucial that the data are representative and do not contain biases that could affect the results. For example, if we train a model to predict consumption patterns and only use data from a limited group of people, it is likely that the predictions will not be valid for other groups with different behaviours.
Step 3: Prepare and explore the data
Once the data have been collected, it is time to clean and normalise them. In many cases, raw data may contain problems such as errors, duplications, missing values, inconsistencies or non-standardised formats. For example, you might find empty cells in a sales dataset or dates that do not follow a consistent format. Before feeding the model with this data, it is essential to fit it to ensure that the analysis is accurate and reliable. This step not only improves the quality of the results, but also ensures that the model can correctly interpret the information.
Once the data is clean, it is essential to perform feature engineering (feature engineering), a creative process that can make the difference between a basic model and an excellent one. This phase consists of creating new variables that better capture the nature of the problem we want to solve. For example, if we are analysing onlinesales, in addition to using the direct price of the product, we could create new characteristics such as the price/category_average ratio, the days since the last promotion, or variables that capture the seasonality of sales. Experience shows that well-designed features are often more important for the success of the model than the choice of the algorithm itself.
In this phase, we will also carry out a first exploratory analysis of the data, seeking to familiarise ourselves with the data and detect possible patterns, trends or irregularities that may influence the model. Further details on how to conduct an exploratory data analysis can be found in this guide .
Another typical activity at this stage is to divide the data into training, validation and test sets. For example, if we have 10,000 records, we could use 70% for training, 20% for validation and 10% for testing. This allows the model to learn without overfitting to a specific data set.
To ensure that our evaluation is robust, especially when working with limited datasets, it is advisable to implement cross-validationtechniques. This methodology divides the data into multiple subsets and performs several iterations of training and validation. For example, in a 5-fold cross-validation, we split the data into 5 parts and train 5 times, each time using a different part as the validation set. This gives us a more reliable estimate of the real performance of the model and helps us to detect problems of over-fitting or variability in the results.
Step 4: Select a model
There are multiple types of AI models, and the choice depends on the problem we want to solve. Common examples are regression, decision tree models, clustering models, time series models or neural networks. In general, there are supervised models, unsupervised models and reinforcement learning models. More detail can be found in this post on how machines learn.
When selecting a model, it is important to consider factors such as the nature of the data, the complexity of the problem and the ultimate goal. For example, a simple model such as linear regression may be sufficient for simple, well-structured problems, while neural networks or advanced models might be needed for tasks such as image recognition or natural language processing. In addition, the balance between accuracy, training time and computational resources must also be considered. A more accurate model generally requires more complex configurations, such as more data, deeper neural networks or optimised parameters. Increasing the complexity of the model or working with large datasets can significantly lengthen the time needed to train the model. This can be a problem in environments where decisions must be made quickly or resources are limited and require specialised hardware, such as GPUs or TPUs, and larger amounts of memory and storage.
Today, many open source libraries facilitate the implementation of these models, such as TensorFlow, PyTorch or scikit-learn.
Step 5: Train the model
Training is at the heart of the process. During this stage, we feed the model with training data so that it learns to perform its task. This is achieved by adjusting the parameters of the model to minimise the error between its predictions and the actual results.
Here it is key to constantly evaluate the performance of the model with the validation set and make adjustments if necessary. For example, in a neural network-type model we could test different hyperparameter settings such as learning rate, number of hidden layers and neurons, batch size, number of epochs, or activation function, among others.
Step 6: Evaluate the model
Once trained, it is time to test the model using the test data set we set aside during the training phase. This step is crucial to measure how it performs on data that is new to the model and ensures that it is not "overtrained", i.e. that it not only performs well on training data, but that it is able to apply learning on new data that may be generated on a day-to-day basis.
When evaluating a model, in addition to accuracy, it is also common to consider:
- Confidence in predictions: assess how confident the predictions made are.
- Response speed: time taken by the model to process and generate a prediction.
- Resource efficiency: measure how much memory and computational usage the model requires.
- Adaptability: how well the model can be adjusted to new data or conditions without complete retraining.
Step 7: Deploy and maintain the model
When the model meets our expectations, it is ready to be deployed in a real environment. This could involve integrating the model into an application, automating tasks or generating reports.
However, the work does not end here. The AI needs continuous maintenance to adapt to changes in data or real-world conditions. For example, if buying patterns change due to a new trend, the model will need to be updated.
Building AI models is not an exact science, it is the result of a structured process that combines logic, creativity and perseverance. This is because multiple factors are involved, such as data quality, model design choices and human decisions during optimisation. Although clear methodologies and advanced tools exist, model building requires experimentation, fine-tuning and often an iterative approach to obtain satisfactory results. While each step requires attention to detail, the tools and technologies available today make this challenge accessible to anyone interested in exploring the world of AI.
ANNEX I - Definitions Types of models
-
Regression: supervised techniques that model the relationship between a dependent variable (outcome) and one or more independent variables (predictors). Regression is used to predict continuous values, such as future sales or temperatures, and may include approaches such as linear, logistic or polynomial regression, depending on the complexity of the problem and the relationship between the variables.
-
Decision tree models: supervised methods that represent decisions and their possible consequences in the form of a tree. At each node, a decision is made based on a characteristic of the data, dividing the set into smaller subsets. These models are intuitive and useful for classification and prediction, as they generate clear rules that explain the reasoning behind each decision.
-
Clustering models: unsupervised techniques that group data into subsets called clusters, based on similarities or proximity between the data. For example, customers with similar buying habits can be grouped together to personalise marketing strategies. Models such as k-means or DBSCAN allow useful patterns to be identified without the need for labelled data.
-
Time series models: designed to work with chronologically ordered data, these models analyse temporal patterns and make predictions based on history. They are used in cases such as demand forecasting, financial analysis or meteorology. They incorporate trends, seasonality and relationships between past and future data.
-
Neural networks: models inspired by the workings of the human brain, where layers of artificial neurons process information and detect complex patterns. They are especially useful in tasks such as image recognition, natural language processing and gaming. Neural networks can be simple or deep learning, depending on the problem and the amount of data.
-
Supervised models: these models learn from labelled data, i.e., sets in which each input has a known outcome. The aim is for the model to generalise to predict outcomes in new data. Examples include spam and non-spam mail classification and price predictions.
-
Unsupervised models: twork with unlabelled data, looking for hidden patterns, structures or relationships within the data. They are ideal for exploratory tasks where the expected outcome is not known in advance, such as market segmentation or dimensionality reduction.
- Reinforcement learning model: in this approach, an agent learns by interacting with an environment, making decisions and receiving rewards or penalties based on performance. This type of learning is useful in problems where decisions affect a long-term goal, such as training robots, playing video games or developing investment strategies.
Content prepared by Juan Benavente, senior industrial engineer and expert in technologies linked to the data economy. The contents and points of view reflected in this publication are the sole responsibility of the author.
Entrevista
In this episode we will discuss artificial intelligence and its challenges, based on the European Regulation on Artificial Intelligence that entered into force this year. Come and find out about the challenges, opportunities and new developments in the sector from two experts in the field:
- Ricard Martínez, professor of constitutional law at the Universitat de València where he directs the Chair of Privacy and Digital Transformation Microsoft University of Valencia.
- Carmen Torrijos, computational linguist, expert in AI applied to language and professor of text mining at the Carlos III University.
Listen to the full podcast (only available in Spanish)
Summary / Transcript of the interview
1. It is a fact that artificial intelligence is constantly evolving. To get into the subject, I would like to hear about the latest developments in AI?
Carmen Torrijos: Many new applications are emerging. For example, this past weekend there has been a lot of buzz about an AI for image generation in X (Twitter), I don't know if you've been following it, called Grok. It has had quite an impact, not because it brings anything new, as image generation is something we have been doing since December 2023. But this is an AI that has less censorship, that is, until now we had a lot of difficulties with the generalist systems to make images that had faces of celebrities or had certain situations and it was very monitored from any tool. What Grok does is to lift all that up so that anyone can make any kind of image with any famous person or any well-known face. It is probably a passing fad. We will make images for a while and then it will pass.
And then there are also automatic podcast creation systems, such as Notebook LM. We've been watching them for a couple of months now and it's really been one of the things that has really surprised me in the last few months. Because it already seems that they are all incremental innovations: on top of what we already have, they give us something better. But this is something really new and surprising. You upload a PDF and it can generate a podcast of two people talking in a totally natural, totally realistic way about that PDF. This is something that Notebook LM, which is owned by Google, can do.
2. The European Regulation on Artificial Intelligence is the world's first legal regulation on AI, with what objectives is this document, which is already a reference framework at international level, being published?
Ricard Martínez: The regulation arises from something that is implicit in what Carmen has told us. All this that Carmen tells is because we have opened ourselves up to the same unbridled race that we experienced with the emergence of social media. Because when this happens, it's not innocent, it's not that companies are being generous, it's that companies are competing for our data. They gamify us, they encourage us to play, they encourage us to provide them with information, so they open up. They do not open up because they are generous, they do not open up because they want to work for the common good or for humanity. They open up because we are doing their work for them. What does the EU want to stop? What we learned from social media. The European Union has two main approaches, which I will try to explain very succinctly. The first approach is a systemic risk approach. The European Union has said: "I will not tolerate artificial intelligence tools that may endanger the democratic system, i.e. the rule of law and the way I operate, or that may seriously infringe fundamental rights". That is a red line.
The second approach is a product-oriented approach. An AI is a product. When you make a car, you follow rules that manage how you produce that car, and that car comes to market when it is safe, when it has all the specifications. This is the second major focus of the Regulation. The regulation says that you can be developing a technology because you are doing research and I almost let you do whatever you want. Now, if this technology is to come to market, you will catalogue the risk. If the risk is low or slight, you are going to be able to do a lot of things and, practically speaking, with transparency and codes of conduct, I will give you a pass. But if it's a high risk, you're going to have to follow a standardised design process, and you're going to need a notified body to verify that technology, make sure that in your documentation you've met what you have to meet, and then they'll give you a CE mark. And that's not the end of it, because there will be post-trade surveillance. So, throughout the life cycle of the product, you need to ensure that this works well and that it conforms to the standard.
On the other hand, a tight control is established with regard to big data models, not only LLM, but also image or other types of information, where it is believed that they may pose systemic risks.
In that case, there is a very direct control by the Commission. So, in essence, what they are saying is: "respect rights, guarantee democracy, produce technology in an orderly manner according to certain specifications".
Carmen Torrijos: Yes, in terms of objectives it is clear. I have taken up Ricard's last point about producing technology in accordance with this Regulation. We have this mantra that the US does things, Europe regulates things and China copies things. I don't like to generalise like that. But it is true that Europe is a pioneer in terms of legislation and we would be much stronger if we could produce technology in line with the regulatory standards we are setting. Today we still can't, maybe it's a question of giving ourselves time, but I think that is the key to technological sovereignty in Europe.
3. In order to produce such technology, AI systems need data to train their models. What criteria should the data meet in order to train an AI system correctly? Could open data sets be a source? In what way?
Carmen Torrijos: The data we feed AI with is the point of greatest conflict. Can we train with any dataset even if it is available? We are not talking about open data, but about available data.
Open data is, for example, the basis of all language models, and everyone knows this, which is Wikipedia. Wikipedia is an ideal example for training, because it is open, it is optimised for computational use, it is downloadable, it is very easy to use, there is a lot of language, for example, for training language models, and there is a lot of knowledge of the world. This makes it the ideal dataset for training an AI model. And Wikipedia is in the open, it is available, it belongs to everyone and it is for everyone, you can use it.
But can all the datasets available on the Internet be used to train AI systems? That is a bit of a doubt. Because the fact that something is published on the Internet does not mean that it is public, for public use, although you can take it and train a system and start generating profit from that system. It had a copyright, authorship and intellectual property. That I think is the most serious conflict we have right now in generative AI because it uses content to inspire and create. And there, little by little, Europe is taking small steps. For example, the Ministry of Culture has launched an initiative to start looking at how we can create content, licensed datasets, to train AI in a way that is legal, ethical and respectful of authors' intellectual property rights.
All this is generating a lot of friction. Because if we go on like this, we will turn against many illustrators, translators, writers, etc. (all creators who work with content), because they will not want this technology to be developed at the expense of their content. Somehow you have to find a balance in regulation and innovation to make both happen. From the large technological systems that are being developed, especially in the United States, there is a repeated idea that only with licensed content, with legal datasets that are free of intellectual property, or that the necessary returns have been paid for their intellectual property, it is not possible to reach the level of quality of AIs that we have now. That is, only with legal datasets alone we would not have ChatGPT at the level ChatGPT is at now.
This is not set in stone and does not have to be the case. We have to continue researching, that is, we have to continue to see how we can achieve a technology of that level, but one that complies with the regulation. Because what they have done in the United States, what GPT-4 has done, the great models of language, the great models of image generation, is to show us the way. This is as far as we can go. But you have done so by taking content that is not yours, that it was not permissible to take. We have to get back to that level of quality, back to that level of performance of the models, respecting the intellectual property of the content. And that is a role that I believe is primarily Europe's responsibility.
4. Another issue of public concern with regard to the rapid development of AI is the processing of personal data. How should they be protected and what conditions does the European regulation set for this?
Ricard Martínez: There is a set of conducts that have been prohibited essentially to guarantee the fundamental rights of individuals. But it is not the only measure. I attach a great deal of importance to an article in the regulation that we are probably not going to give much thought to, but for me it is key. There is an article, the fourth one, entitled AI Literacy, which says that any subject that is intervening in the value chain must have been adequately trained. You have to know what this is about, you have to know what the state of the art is, you have to know what the implications are of the technology you are going to develop or deploy. I attach great value to it because it means incorporating throughout the value chain (developer, marketer, importer, company deploying a model for use, etc.) a set of values that entail what is called accountability, proactive responsibility, by default. This can be translated into a very simple element, which has been talked about for two thousand years in the world of law, which is 'do no harm', the principle of non-maleficence.
With something as simple as that, "do no harm to others, act in good faith and guarantee your rights", there should be no perverse effects or harmful effects, which does not mean that it cannot happen. And this is precisely what the Regulation says in particular when it refers to high-risk systems, but it is applicable to all systems. The Regulation tells you that you have to ensure compliance processes and safeguards throughout the life cycle of the system. That is why it is so important to have robustness, resilience and contingency plans that allow you to revert, shut down, switch to human control, change the usage model when an incident occurs.
Therefore, the whole ecosystem is geared towards this objective of no harm, no rights, no harm. And there is an element that no longer depends on us, it depends on public policy. AI will not only infringe on rights, it will change the way we understand the world. If there are no public policies in the education sector that ensure that our children develop computational thinking skills and are able to have a relationship with a machine-interface, their access to the labour market will be significantly affected. Similarly, if we do not ensure the continuous training of active workers and also the public policies of those sectors that are doomed to disappear.
Carmen Torrijos: I find Ricard's approach of to train is to protect very interesting. Train people, inform people, get people trained in AI, not only people in the value chain, but everybody. The more you train and empower, the more you are protecting people.
When the law came out, there was some disappointment in AI environments and especially in creative environments. Because we were in the midst of the generative AI boom and generative AI was hardly being regulated, but other things were being regulated that we took for granted would not happen in Europe, but that have to be regulated so that they cannot happen. For example, biometric surveillance: Amazon can't read your face to decide whether you are sadder that day and sell you more stuff or get more advertising or a particular advertisement. I say Amazon, but it can be any platform. This, for example, will not be possible in Europe because it is forbidden by law, it is an unacceptable use: biometric surveillance.
Another example is social scoring, the social scoring that we see happening in China, where citizens are given points and access to public services based on these points. That is not going to be possible either. And this part of the law must also be considered, because we take it for granted that this is not going to happen to us, but when you don't regulate it, that's when it happens. China has installed 600 million TRF cameras, facial recognition technology, which recognise you with your ID card. That is not going to happen in Europe because it cannot, because it is also biometric surveillance. So you have to understand that the law perhaps seems to be slowing down on what we are now enraptured by, which is generative AI, but it has been dedicated to addressing very important points that needed to be covered in order to protect people. In order not to lose fundamental rights that we have already won.
Finally, ethics has a very uncomfortable component, which nobody wants to look at, which is that sometimes it has to be revoked. Sometimes it is necessary to remove something that is in operation, even that is providing a benefit, because it is incurring some kind of discrimination, or because it is bringing some kind of negative consequence that violates the rights of a collective, of a minority or of someone vulnerable. And that is very complicated. When we have become accustomed to having an AI operating in a certain context, which may even be a public context, to stop and say that this is discriminating against people, then this system cannot continue in production and has to be removed. This point is very complicated, it is very uncomfortable and when we talk about ethics, which we talk very easily about ethics, we must also think about how many systems we are going to have to stop and review before we can put them back into operation, however easy they make our lives or however innovative they may seem.
5. In this sense, taking into account all that the Regulation contains, some Spanish companies, for example, will have to adapt to this new framework. What should organisations already be doing to prepare? What should Spanish companies review in the light of the European regulation?
Ricard Martínez: This is very important, because there is a corporate business level of high capabilities that I am not worried about because these companies understand that we are talking about an investment. And just as they invested in a process-based model that integrated the compliance from the design for data protection. The next leap, which is to do exactly the same thing with artificial intelligence, I won't say that it is unimportant, because it is of relevant importance, but let's say that it is going down a path that has already been tried. These companies already have compliance units, they already have advisors, and they already have routines into which the artificial intelligence regulatory framework can be integrated as part of the process. In the end, what it will do is to increase risk analysis in one sense. It will surely force the design processes and also the design phases themselves to be modular, i.e., while in software design we are practically talking about going from a non-functional model to chopping up code, here there are a series of tasks of enrichment, annotation, validation of the data sets, prototyping that surely require more effort, but they are routines that can be standardised.
My experience in European projects where we have worked with clients, i.e. SMEs, who expect AI to be plug and play, what we have seen is a huge lack of capacity building. The first question you should ask yourself is not whether your company needs AI, but whether your company is ready for AI. This is an earlier and rather more relevant question. Hey, you think you can make a leap into AI, that you can contract a certain type of services, and we are realising that you don't even comply with the data protection regulation.
There is something, an entity called the Spanish Agency for Artificial Intelligence, AESIA, and there is a Ministry of Digital Transformation, and if there are no accompanying public policies, we may incur risky situations. Why? Because I have the great pleasure of training future entrepreneurs in artificial intelligence in undergraduate and postgraduate courses. When confronted with the ethical and legal framework, I won't say they want to die, but the world comes crashing down on them. Because there is no support, there is no accompaniment, there are no resources, or they cannot see them, that do not involve a round of investment that they cannot bear, or there are no guided models that help them in a way that is, I won't say easy, but at least usable.
Therefore, I believe that there is a substantial challenge in public policies, because if this combination does not happen, the only companies that will be able to compete are those that already have a critical mass, an investment capacity and an accumulated capital that allows them to comply with the standard. This situation could lead to a counterproductive outcome.
We want to regain European digital sovereignty, but if there are no public investment policies, the only ones who will be able to comply with the European standard are companies from other countries.
Carmen Torrijos: Not because they are from other countries but because they are bigger.
Ricard Martínez: Yes, not to mention countries.
6. We have talked about challenges, but it is also important to highlight opportunities. What positive aspects could you highlight as a result of this recent regulation?
Ricard Martínez: I am working on the construction, with European funding, of Cancer Image EU , which is intended to be a digital infrastructure for cancer imaging. At the moment, we are talking about a partnership involving 14 countries, 76 organisations, on the way to 93, to generate a medical imaging database of 25 million cancer images with associated clinical information for the development of artificial intelligence. The infrastructure is being built, it does not yet exist, and even so, at the Hospital La Fe in Valencia, research is already underway with mammograms of women who have undergone biennial screening and then developed cancer, to see if it is capable of training an image analysis model that is capable of preventively recognising that little spot that the oncologist or radiologist did not see and that later turned out to be a cancer. Does it mean you're getting chemotherapy five minutes later? No. It means they are going to monitor you, they are going to have an early reaction capability. And that the health system will save 200,000 euros. To mention just one opportunity.
On the other hand, opportunities must also be sought in other rules. Not only in the Artificial Intelligence Regulation. You have to go to Data Governance Act. It wants to counter the data monopoly held by US companies with a sharing of data from the public, private sectorand from the citizenry itself. With Data Act, which aims to empower citizens to retrieve their data and share it by consent. And finally with the European Health Data Space which aims to create ahealth data ecosystem to promote innovation, research and entrepreneurship. It is this ecosystem of data spaces that should be a huge generator of opportunity spaces.
And furthermore, I don't know whether they will succeed or not, but it aims to be coherent with our business ecosystem. That is to say, an ecosystem of small and medium-sized enterprises that does not have high data generation capabilities and what we are going to do is to build the field for them. We are going to create the data spaces for them, we are going to create the intermediaries, the intermediation services, and we hope that this ecosystem as a whole will allow European talent to emerge from small and medium-sized enterprises. Will it be achieved or not? I don't know, but the opportunity scenario looks very interesting.
Carmen Torrijos: If you ask for opportunities, all opportunities. Not only artificial intelligence, but all technological progress, is such a huge field that it can bring opportunities of all kinds. What needs to be done is to lower the barriers, which is the problem we have. And we also have barriers of many kinds, because we have technical barriers, talent barriers, salary barriers, disciplinary barriers, gender barriers, generational barriers, and so on.
We need to focus energies on lowering those barriers, and then I also think we still come from the analogue world and have little global awareness that both digital and everything that affects AI and data is a global phenomenon. There is no point in keeping it all local, or national, or even European, but it is a global phenomenon. The big problems we have come because we have technology companies that are developed in the United States working in Europe with European citizens' data. A lot of friction is generated there. Anything that can lead to something more global will always be in favour of innovation and will always be in favour of technology. The first thing is to lift the barriers within Europe. That is a very positive part of the law.
7. At this point, we would like to take a look at the state we are in and the prospects for the future. How do you see the future of artificial intelligence in Europe?
Ricard Martínez: I have two visions: one positive and one negative. And both come from my experience in data protection. If now that we have a regulatory framework, the regulatory authorities, I am referring to artificial intelligence and data protection, are not capable of finding functional and grounded solutions, and they generate public policies from the top down and from an excellence that does not correspond to the capacities and possibilities of research - I am referring not only to business research, but also to university research - I see a very dark future. If, on the other hand, we understand regulation in a dynamic way with supportive and accompanying public policies that generate the capacities for this excellence, I see a promising future because in principle what we will do is compete in the market with the same solutions as others, but responsive: safe, responsible and reliable.
Carmen: Yes, I very much agree. I introduce the time variable into that, don't I? Because I think we have to be very careful not to create more inequality than we already have. More inequality among companies, more inequality among citizens. If we are careful with this, which is easy to say but difficult to do, I believe that the future can be bright, but it will not be bright immediately. In other words, we are going to have to go through a darker period of adapting to change. Just as many issues of digitalisation are no longer alien to us, have already been worked on, we have already gone through them and have already regulated them, artificial intelligence also needs its time.
We have had very few years of AI, very few years of generative AI. In fact, two years is nothing in a worldwide technological change. And we have to give time to laws and we also have to give time for things to happen. For example, I give a very obvious example, the New York Times' complaint against Microsoft and OpenAI has not yet been resolved. It's been a year, it was filed in December 2023, the New York Times complains that they have trained AI systems with their content and in a year nothing has been achieved in that process. Court proceedings are very slow. We need more to happen. And that more processes of this type are resolved in order to have precedents and to have maturity as a society in what is happening, and we still have a long way to go. It's like almost nothing has happened. So, the time variable I think is important and I think that, although at the beginning we have a darker future, as Ricard says, I think that in the long term, if we keep clear limits, we can reach something brilliant.
Interview clips
1. What criteria should the data have to train an AI system?
2. What should Spanish companies review in light of the IA Regulation?
Noticia
Since last week, the Artificial Intelligence (AI) language models trained in Spanish, Catalan, Galician, Valencian and Basque, which have been developed within ALIA, the public infrastructure of AI resources, are now available. Through the ALIA Kit users can access the entire family of models and learn about the methodology used, related documentation and training and evaluation datasets. In this article we tell you about its key features.
What is ALIA?
ALIA is a project coordinated by the Barcelona Supercomputing Center-Centro Nacional de Supercomputación (BSC-CNS). It aims to provide a public infrastructure of open and transparent artificial intelligence resources, capable of generating value in both the public and private sectors.
Specifically, ALIA is a family of text, speech and machine translation models. The training of artificial intelligence systems is computationally intensive, as huge volumes of data need to be processed and analysed. These models have been trained in Spanish, a language spoken by more than 600 million people worldwide, but also in the four co-official languages. The Real Academia Española (RAE) and the Asociación de Academias de la Lengua Española, which brings together the Spanish language institutions around the world, have collaborated in this project.
The MareNostrum 5, one of the most powerful supercomputers in the world, which is located at the Barcelona Supercomputing Center, has been used for the training. It has taken thousands of hours of work to process several billion words at a speed of 314,000 trillion calculations per second.
A family of open and transparent models
The development of these models provides an alternative that incorporates local data. One of ALIA's priorities is to be an open and transparent network, which means that users, in addition to being able to access the models, have the possibility of knowing and downloading the datasets used and all related documentation. This documentation makes it easier to understand how the models work and also to detect more easily where they fail, which is essential to avoid biases and erroneous results. Openness of models and transparency of data is essential, as it creates more inclusive and socially just models, which benefit society as a whole.
Having open and transparent models encourages innovation, research and democratises access to artificial intelligence, while ensuring that it is based on quality training data.
What can I find in ALIA Kit?
Through ALIA Kit, it is currently possible to access five massive language models (LLM) of general purpose, of which two have been trained with instructions from various open corpora. Also available are nine multilingual machine translation models, some of them trained from scratch, such as one for machine translation between Galician and Catalan, or between Basque and Catalan. In addition, translation models have been trained in Aranese, Aragonese and Asturian.
We also find the data and tools used to build and evaluate the text models, such as the massive CATalog textual corpus, consisting of 17.45 billion words (about 23 billion tokens), distributed over 34.8 million documents from a wide variety of sources, which have been largely manually reviewed.
To train the speech models, different speech corpora with transcription have been used, such as, for example, a dataset of the Valencian Parliament with more than 270 hours of recordings of its sessions. It is also possible to know the corpora used to train the machine translation models.
A freeAPI (from Python, Javascript or Curl) is also available through the ALIA Kit, with which tests can be carried out.
What can these models be used for?
The models developed by ALIA are designed to be adaptable to a wide range of natural language processing tasks. However, for specific needs it is preferable to use specialised models, which are more accurate and less resource-intensive.
As we have seen, the models are available to all interested users, such as independent developers, researchers, companies, universities or institutions. Among the main beneficiaries of these tools are developers and small and medium-sized enterprises, for whom it is not feasible to develop their own models from scratch, both for economic and technical reasons. Thanks to ALIA they can adapt existing models to their specific needs.
Developers will find resources to create applications that reflect the linguistic richness of Spanish and the co-official languages. For their part, companies will be able to develop new applications, products or services aimed at the broad international market offered by the Spanish language, opening up new business and expansion opportunities.
An innovative project financed with public funds
The ALIA project is fully publicly funded with the aim of fostering innovation and the adoption of value-generating technologies in both the public and private sectors. Having a public AI infrastructure democratises access to advanced technologies, allowing small businesses, institutions and governments to harness their full potential to innovate and improve their services. It also facilitates ethical oversight of AI development and encourages innovation.
ALIA is part of the Spain's Artificial Intelligence Strategy 2024, which aims to provide the country with the necessary capabilities to meet the growing demand for AI products and services and to boost the adoption of this technology, especially in the public sector and SMEs. Within Axis 1 of this strategy is the so-called Lever 3, which focuses on the generation of models and corpora for a public infrastructure of language models. With the publication of this family of models, advances in the development of artificial intelligence resources in Spain.
Blog
It is possible that our ability to be surprised by new generative artificial intelligence (AI) tools is beginning to wane. The best example is GPT-o1, a new language model with the highest reasoning ability achieved so far, capable of verbalising - something similar to - its own logical processes, but which did not arouse as much enthusiasm at its launch as might have been expected. In contrast to the previous two years, in recent months we have had less of a sense of disruption and have reacted less massively to new developments.
One possible reflection is that we do not need, for now, more intelligence in the models, but to see with our own eyes a landing in concrete uses that make our lives easier: how do I use the power of a language model to consume content faster, to learn something new or to move information from one format to another? Beyond the big general-purpose applications, such as ChatGPT or Copilot, there are free and lesser-known tools that help us think better, and offer AI-based capabilities to discover, understand and share knowledge.
Generate podcasts from a file: NotebookLM
The NotebookLM automated podcasts first arrived in Spain in the summer of 2024 and did raise a significant stir, despite not even being available in Spanish. Following Google's style, the system is simple: simply upload a PDF file as a source to obtain different variations of the content provided by Gemini 2.0 (Google's AI system), such as a summary of the document, a study guide, a timeline or a list of frequently asked questions. In this case, we have used a report on artificial intelligence and democracy published by UNESCO in 2024 as an example.

Figure 1. Different summary options in NotebookLM.
While the study guide is an interesting output, offering a system of questions and answers to memorise and a glossary of terms, the star of NotebookLM is the so-called "audio summary": a completely natural conversational podcast between two synthetic interlocutors who comment in a pleasant way on the content of the PDF.

Figure 2. Audio summary in NotebookLM.
The quality of the content of this podcast still has room for improvement, but it can serve as a first approach to the content of the document, or help us to internalise it more easily from the audio while we take a break from screens, exercise or move around.
The trick: apparently, you can't generate the podcast in Spanish, only in English, but you can try with this prompt: "Make an audio summary of the document in Spanish". It almost always works.
Create visualisations from text: Napkin AI
Napkin offers us something very valuable: creating visualisations, infographics and mind maps from text content. In its free version, the system only asks you to log in with an email address. Once inside, it asks us how we want to enter the text from which we are going to create the visualisations. We can paste it or directly generate with AI an automatic text on any topic.
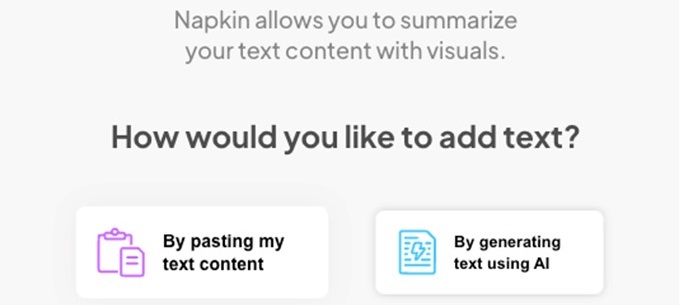
Figure 3. Starting points in Napkin.ai.
In this case, we will copy and paste an excerpt from the UNESCO report which contains several recommendations for the democratic governance of AI. From the text it receives, Napkin.ai provides illustrations and various types of diagrams. We can find from simpler proposals with text organised in keys and quadrants to others illustrated with drawings and icons.
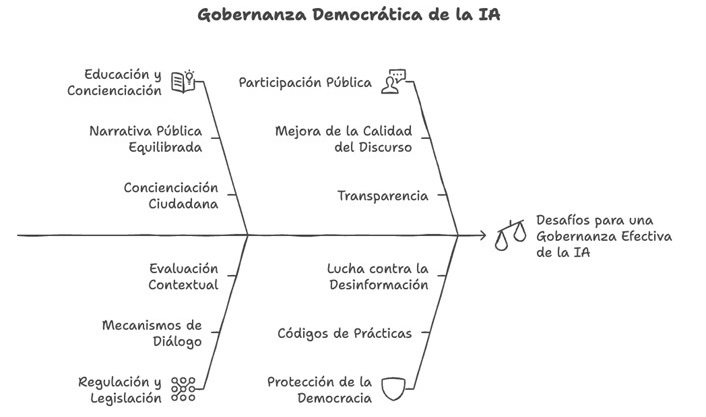
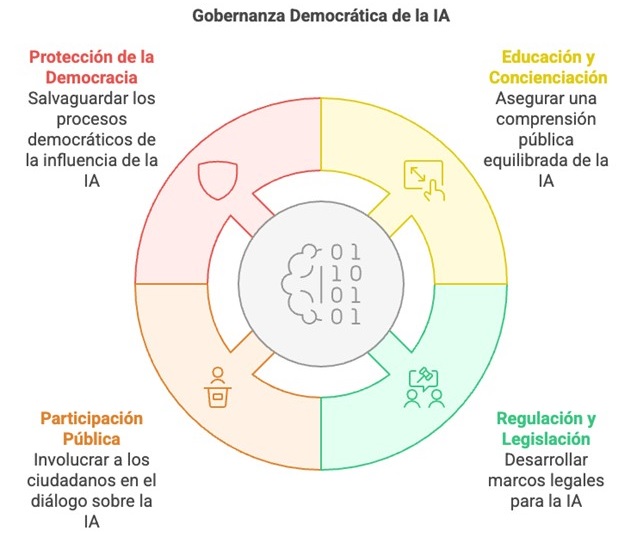
Figure 4. Proposed scheme in Napkin.ai.
Although they are far from the quality of professional infographics, these visualisations can be useful on a personal and learning level, to illustrate a post in networks, to explain concepts internally to our team or to enrich our own content in the educational field.
The trick: if you click on Stylesin each scheme proposal, you will find more variations of the scheme with different colours and lines. You can also modify the texts by simply clicking on them once you select a visualisation.
Automatic presentations and slides: Gamma
Of all the content formats that AI is capable of generating, slideshows are probably the least successful. Sometimes the designs are not too elaborate, sometimes we don't get the template we want to use to be respected, almost always the texts are too simple. The particularity of Gamma, and what makes it more practical than other options such as Beautiful.ai, is that we can create a presentation directly from a text content that we can paste, generate with AI or upload in a file.

Figure 5. Starting points for Gamma.
If we paste the same text as in the previous example, about UNESCO's recommendations for democratic governance of AI, in the next step Gamma gives us the choice between "free form" or "card by card". In the first option, the system's AI organises the content into slides while preserving the full meaning of each slide. In the second, it proposes that we divide the text to indicate the content we want on each slide.
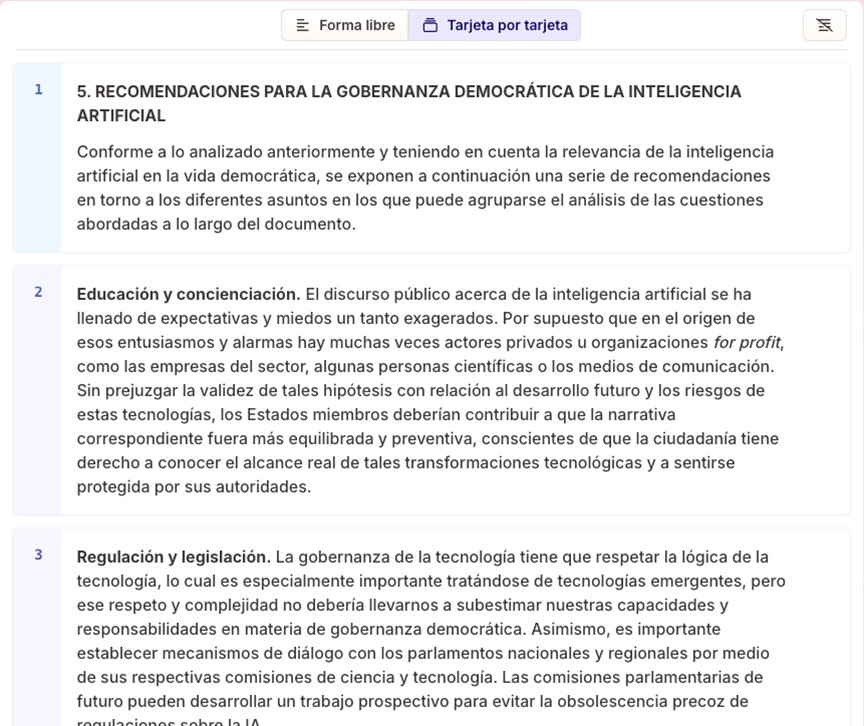
Figure 6. Text automatically split into slides by Gamma.
We select the second option, and the text is automatically divided into different blocks that will be our future slides. By clicking on "Continue", we are asked to select a base theme. Finally, by clicking on "Generate", the complete presentation is automatically created.

Figure 7. Example of a slide created with Gamma.
Gamma accompanies the slides with AI-created images that keep a certain coherence with the content, and gives us the option of modifying the texts or generating different images. Once ready, we can export it directly to Power Point format.
A trick: in the "edit with AI" button on each slide we can ask it to automatically translate it into another language, correct the spelling or even convert the text into a timeline.
Summarise from any format: NoteGPT
The aim of NoteGPT is very clear: to summarise content that we can import from many different sources. We can copy and paste a text, upload a file or an image, or directly extract the information from a link, something very useful and not so common in AI tools. Although the latter option does not always work well, it is one of the few tools that offer it.
Figure 8. Starting points for NoteGPT.
In this case, we introduce the link to a YouTube video containing an interview with Daniel Innerarity on the intersection between artificial intelligence and democratic processes. On the results screen, the first thing you get on the left is the full transcript of the interview, in good quality. We can locate the transcript of a specific fragment of the video, translate it into different languages, copy it or download it, even in an SRT file of time-mapped subtitles.

Figure 9. Example of transcription with minutes in NoteGPT
Meanwhile, on the right, we find the summary of the video with the most important points, sorted and illustrated with emojis. Also in the "AI Chat" button we can interact with a conversational assistant and ask questions about the content.
Figure 10. NoteGPT summary from a YouTube interview.
And although this is already very useful, the best thing we can find in NoteGPT are the flashcards, learning cards with questions and answers to internalise the concepts of the video.
Figure 11. NoteGPT learning card (question and answer).
A trick: if the summary only appears in English, try changing the language in the three dots on the right, next to "Summarize" and click "Summarize" again. The summary will appear in English below. In the case of flashcards, to generate them in English, do not try from the home page, but from "AI flashcards". Under "Create" you can select the language.
Figure 12. Creation of flashcards in NoteGPT.
Create videos about anything: Lumen5
Lumen5 makes it easy to create videos with AI by creating the script and images automatically from text or voice content. The most interesting thing about Lumen5 is the starting point, which can be a text, a document, simply an idea or also an existing audio recording or video.

Figure 13. Lumen5 options.
The system allows us, before creating the video and also once created, to change the format from 16:9 (horizontal) to 1:1 (square) or 9:16 (vertical), even with a special 9:16 option for Instagram stories.
Figure 14. Video preview and aspect ratio options.
In this case, we will start from the same text as in previous tools: UNESCO's recommendations for democratic governance of AI. Select the starting option "Text on media", paste it directly into the box and click on "Compose script". The result is a very simple and schematic script, divided into blocks with the basic points of the text, and a very interesting indication: a prediction of the length of the video with that script, approximately 1 minute and 19 seconds.
An important note: the script is not a voice-over, but the text that will be written on the different screens. Once the video is finished, you can translate the whole video into any other language.

Figure 15. Script proposal in Lumen5.
Clicking on "Continue" will take you to the last opportunity to modify the script, where you can add new text blocks or delete existing ones. Once ready, click on "Convert to video" and you will find the story board ready to modify images, colours or the order of the screens. The video will have background music, which you can also change, and at this point you can record your voice over the music to voice the script. Without too much effort, this is the end result:
Figura 16. Resultado final de un vídeo creado con Lumen5.
From the wide range of AI-based digital products that have flourished in recent years, perhaps thousands of them, we have gone through just five examples that show us that individual and collaborative knowledge and learning are more accessible than ever before. The ease of converting content from one format to another and the automatic creation of study guides and materials should promote a more informed and agile society, not only through text or images but also through information condensed in files or databases.
It would be a great boost to collective progress if we understood that the value of AI-based systems is not as simple as writing or creating content for us, but to support our reasoning processes, objectify our decision-making and enable us to handle much more information in an efficient and useful way. Harnessing new AI capabilities together with open data initiatives may be key to the next step in the evolution of human thinking.
Content prepared by Carmen Torrijos, expert in AI applied to language and communication. The contents and points of view reflected in this publication are the sole responsibility of the author.
Blog
Web API design is a fundamental discipline for the development of applications and services, facilitating the fluid exchange of data between different systems. In the context of open data platforms, APIs are particularly important as they allow users to access the information they need automatically and efficiently, saving costs and resources.
This article explores the essential principles that should guide the creation of effective, secure and sustainable web APIs, based on the principles compiled by the Technical Architecture Group linked to the World Wide Web Consortium (W3C), following ethical and technical standards. Although these principles refer to API design, many are applicable to web development in general.
The aim is to enable developers to ensure that their APIs not only meet technical requirements, but also respect users' privacy and security, promoting a safer and more efficient web for all.
In this post, we will look at some tips for API developers and how they can be put into practice.
Prioritise user needs
When designing an API, it is crucial to follow the hierarchy of needs established by the W3C:
- First, the needs of the end-user.
- Second, the needs of web developers.
- Third, the needs of browser implementers.
- Finally, theoretical purity.
In this way we can drive a user experience that is intuitive, functional and engaging. This hierarchy should guide design decisions, while recognising that sometimes these levels are interrelated: for example, an API that is easier for developers to use often results in a better end-user experience.
Ensures security
Ensuring security when developing an API is crucial to protect both user data and the integrity of the system. An insecure API can be an entry point for attackers seeking to access sensitive information or compromise system functionality. Therefore, when adding new functionalities, we must meet the user's expectations and ensure their security.
In this sense, it is essential to consider factors related to user authentication, data encryption, input validation, request rate management (or Rate Limiting, to limit the number of requests a user can make in a given period and avoid denial of service attacks), etc. It is also necessary to continually monitor API activities and keep detailed logs to quickly detect and respond to any suspicious activity.
Develop a user interface that conveys trust and confidence
It is necessary to consider how new functionalities impact on user interfaces. Interfaces must be designed so that users can trust and verify that the information provided is genuine and has not been falsified. Aspects such as the address bar, security indicators and permission requests should make it clear who you are interacting with and how.
For example, the JavaScript alert function, which allows the display of a modal dialogue box that appears to be part of the browser, is a case history that illustrates this need. This feature, created in the early days of the web, has often been used to trick users into thinking they are interacting with the browser, when in fact they are interacting with the web page. If this functionality were proposed today, it would probably not be accepted because of these security risks.
Ask for explicit consent from users
In the context of satisfying a user need, a website may use a function that poses a threat. For example, access to the user's geolocation may be helpful in some contexts (such as a mapping application), but it also affects privacy.
In these cases, the user's consent to their use is required. To do this:
- The user must understand what he or she is accessing. If you cannot explain to a typical user what he or she is consenting to in an intelligible way, you will have to reconsider the design of the function.
- The user must be able to choose to effectively grant or refuse such permission. If a permission request is rejected, the website will not be able to do anything that the user thinks they have dismissed.
By asking for consent, we can inform the user of what capabilities the website has or does not have, reinforcing their confidence in the security of the site. However, the benefit of a new feature must justify the additional burden on the user in deciding whether or not to grant permission for a feature.
Uses identification mechanisms appropriate to the context
It is necessary to be transparent and allow individuals to control their identifiers and the information attached to them that they provide in different contexts on the web.
Functionalities that use or rely on identifiers linked to data about an individual carry privacy risks that may go beyond a single API or system. This includes passively generated data (such as your behaviour on the web) and actively collected data (e.g. through a form). In this regard, it is necessary to understand the context in which they will be used and how they will be integrated with other web functionalities, ensuring that the user can give appropriate consent.
It is advisable to design APIs that collect the minimum amount of data necessary and use short-lived temporary identifiers, unless a persistent identifier is absolutely necessary.
Creates functionalities compatible with the full range of devices and platforms
As far as possible, ensure that the web functionalities are operational on different input and output devices, screen sizes, interaction modes, platforms and media, favouring user flexibility.
For example, the 'display: block', 'display: flex' and 'display: grid' layout models in CSS, by default, place content within the available space and without overlaps. This way they work on different screen sizes and allow users to choose their own font and size without causing text overflow.
Add new capabilities with care
Adding new capabilities to the website requires consideration of existing functionality and content, to assess how it will be integrated. Do not assume that a change is possible or impossible without first verifying it.
There are many extension points that allow you to add functionality, but there are changes that cannot be made by simply adding or removing elements, because they could generate errors or affect the user experience. It is therefore necessary to verify the current situation first, as we will see in the next section.
Before removing or changing functionality, understand its current use
It is possible to remove or change functions and capabilities, but the nature and extent of their impact on existing content must first be understood. This may require investigating how current functions are used.
The obligation to understand existing use applies to any function on which the content depends. Web functions are not only defined in the specifications, but also in the way users use them.
Best practice is to prioritise compatibility of new features with existing content and user behaviour. Sometimes a significant amount of content may depend on a particular behaviour. In these situations, it is not advisable to remove or change such behaviour.
Leave the website better than you found it
The way to add new capabilities to a web platform is to improve the platform as a whole, e.g. its security, privacy or accessibility features.
The existence of a defect in a particular part of the platform should not be used as an excuse to add or extend additional functionalities in order to fix it, as this may duplicate problems and diminish the overall quality of the platform. Wherever possible, new web capabilities should be created that improve the overall quality of the platform, mitigating existing shortcomings across the board.
Minimises user data
Functionalities must be designed to be operational with the minimal amount of user input necessary to achieve their objectives. In doing so, we limit the risks of disclosure or misuse.
It is recommended to design APIs so that websites find it easier to request, collect and/or transmit a small amount of data (more granular or specific data), than to work with more generic or massive data. APIs should provide granularity and user controls, in particular if they work on personal data.
Other recommendations
The document also provides tips for API design using various programming languages. In this sense, it provides recommendations linked to HTML, CSS, JavaScript, etc. You can read the recommendations here.
In addition, if you are thinking of integrating an API into your open data platform, we recommend reading the Practical guide to publishing Open Data using APIs.
By following these guidelines, you will be able to develop consistent and useful websites for users, allowing them to achieve their objectives in an agile and resource-optimised way.
Blog
Over the last decade, the amount of data that organisations generate and need to manage has grown exponentially. With the rise of the cloud, Internet of Things (IoT), edge computing and artificial intelligence (AI), enterprises face the challenge of integrating and governing data from multiple sources and environments. In this context, two key approaches to data management have emerged that seek to solve the problems associated with data centralisation: Data Mesh y Data Fabric. Although these concepts complement each other, each offers a different approach to solving the data challenges of modern organisations.
Why is a data lake not enough?
Many companies have implemented data lakes or centralised data warehouses with dedicated teams as a strategy to drive company data analytics. However, this approach often creates problems as the company scales up, for example:
- Centralised data equipment becomes a bottleneck. These teams cannot respond quickly enough to the variety and volume of questions that arise from different areas of the business.
- Centralisation creates a dependency that limits the autonomy of domain teams, who know their data needs best.
This is where the Data Meshapproach comes in.
Data Mesh: a decentralised, domain-driven approach
Data Mesh breaks the centralisation of data and distributes it across specific domains, allowing each business team (or domain team) to manage and control the data it knows and uses most. This approach is based on four basic principles:
- Domain ownership: instead of a central data computer having all the control, each computer is responsible for the data it generates. That is, if you are the sales team, you manage the sales data; if you are the marketing team, you manage the marketing data. Nobody knows this data better than the team that uses it on a daily basis.
- Data as a product: this idea reminds us that data is not only for the use of the domain that generates it, but can be useful for the entire enterprise. So each team should think of its data as a "product" that other teams can also use. This implies that the data must be accessible, reliable and easy to find, almost as if it were a public API.
- Self-service platform: decentralisation does not mean that every team has to reinvent the wheel. To prevent each domain team from specialising in complex data tools, the Data Mesh is supported by a self-service infrastructure that facilitates the creation, deployment and maintenance of data products. This platform should allow domain teams to consume and generate data without relying on high technical expertise.
- Federated governance: although data is distributed, there are still common rules for all. In a Data Mesh, governance is "federated", i.e. each device follows globally defined interoperability standards. This ensures that all data is secure, high quality and compliant.
These principles make Data Mesh an ideal architecture for organisations seeking greater agility and team autonomy without losing sight of quality and compliance. Despite decentralisation, Data Mesh does not create data silos because it encourages collaboration and standardised data sharing between teams, ensuring common access and governance across the organisation.
Data Fabric: architecture for secure and efficient access to distributed data
While the Data Mesh focuses on organising and owning data around domains, the Data Fabric is an architecture that allows connecting and exposing an organisation''s data, regardless of its location. Unlike approaches based on data centralisation, such as the data lake, the Data Fabric acts as a unified layer, providing seamless access to data distributed across multiple systems without the need to physically move it to a single repository.
In general terms, the Data Fabric is based on three fundamental aspects:
- Access to data: in a modern enterprise, data is scattered across multiple locations, such as data lakes, data warehouses, relational databases and numerous SaaS (Software as-a-Service) applications. Instead of consolidating all this data in one place, the Data Fabric employs a virtualisation layer that allows it to be accessed directly from its original sources. This approach minimises data duplication and enables real-time access, thus facilitating agile decision-making. In cases where an application requires low latencies, the Data Fabric also has robust integration tools, such as ETL (extract, transform and load), to move and transform data when necessary.
- Data lifecycle management: the Data Fabric not only facilitates access, but also ensures proper management throughout the entire data lifecycle. This includes critical aspects such as governance, privacy and compliance. The architecture of the Data Fabric relies on active metadata that automates the application of security and access policies, ensuring that only users with the appropriate permissions access the corresponding information. It also offers advanced traceability (lineage) functionalities, which allow tracking the origin of data, knowing its transformations and assessing its quality, which is essential in environments regulated under regulations such as the General Data Protection Regulation (GDPR).
- Data exposure: after connecting the data and applying the governance and security policies, the next step of the Data Fabric is to make that data available to end users. Through enterprise catalogues, data is organised and presented in a way that is accessible to analysts, data scientists and developers, who can locate and use it efficiently.
In short, the Data Fabric does not replace data lakes or data warehouses, but facilitates the integration and management of the organisation''s existing data. It aims to create a secure and flexible environment that enables the controlled flow of data and a unified view, without the need to physically move it, thus driving more agile and informed decision-making.
Data Mesh vs. Data Fabric. Competitors or allies?
While Data Mesh and Data Fabric have some objectives in common, each solves different problems and, in fact, benefits can be found in applying mechanisms from both approaches in a complementary manner. The following table shows a comparison of the two approaches:
| APEARANCE | DATA MESH | DATA FABRIC |
|---|---|---|
| Approach | Organisational and structural, domain-oriented. | Technical, focusing on data integration. |
| Purpose | Decentralise ownership and responsibility for data to domain teams. | Create a unified data access layer distributed across multiple environments. |
| Data management | Each domain manages its own data and defines quality standards. | Data is integrated through services and APIs, allowing a unified view without physically moving data. |
| Governance | Federated, with rules established by each domain, maintaining common standards. | Centralised at platform level, with automation of access and security policies through active metadata. |
Figure 1. Comparative table of Data Mesh VS. Data Fabric. Source: Own elaboration.
Conclusion
Both Data Mesh and Data Fabric are designed to solve the challenges of data management in modern enterprises. Data Mesh brings an organisational approach that empowers domain teams, while Data Fabric enables flexible and accessible integration of distributed data without the need to physically move it. The choice between the two, or a combination of the two, will depend on the specific needs of each organisation, although it is important to consider the investment in infrastructure, training and possible organisational changes that these approaches require. For small to medium-sized companies, a traditional data warehouse can be a practical and cost-effective alternative, especially if their data volumes and organisational complexity are manageable. However, given the growth of data ecosystems in organisations, both models represent a move towards a more agile, secure and useful data environment, facilitating data management that is better aligned with strategic objectives in an environment.
Definitions
- Data Lake: it is a storage repository that allows large volumes of data to be stored in their original format, whether structured, semi-structured or unstructured. Its flexible structure allows raw data to be stored and used for advanced analytics and machine learning.
- Data Warehouse: it is a structured data storage system that organises, processes and optimises data for analysis and reporting. It is designed for quick queries and analysis of historical data, following a predefined scheme for easy access to information.
References
- Dehghani, Zhamak. Data Mesh Principles and Logical Architecture. https://martinfowler.com/articles/data-mesh-principles.html.
- Dehghani, Zhamak. Data Mesh: Delivering Data-Driven Value at Scale. O''Reilly Media. Book detailing the implementation and fundamental principles of Data Mesh in organisations.
- Data Mesh Architecture. Website about Data Mesh and data architectures. https://www.datamesh-architecture.com/
- IBM Data Fabric. IBM Topics. https://www.ibm.com/topics/data-fabric
- IBM Technology. Data Fabric. Unifying Data Across Hybrid and Multicloud Environments. YouTube. https://www.youtube.com/watch?v=0Zzn4eVbqfk&t=4s&ab_channel=IBMTechnology
Content prepared by Juan Benavente, senior industrial engineer and expert in technologies linked to the data economy. The contents and points of view reflected in this publication are the sole responsibility of the author.