Blog
La The European Commission has recently presented the document setting out a new EU Strategy in the field of data. Among other ambitious objectives, this initiative aims to address a transcendental challenge in the era of generative artificial intelligence: the insufficient availability of data under the right conditions.
Since the previous 2020 Strategy, we have witnessed an important regulatory advance that aimed to go beyond the 2019 regulation on open data and reuse of public sector information.
Specifically, on the one hand, the Data Governance Act served to promote a series of measures that tended to facilitate the use of data generated by the public sector in those cases where other legal rights and interests were affected – personal data, intellectual property.
On the other hand, through the Data Act, progress was made, above all, in the line of promoting access to data held by private subjects, taking into account the singularities of the digital environment.
The necessary change of focus in the regulation on access to data.
Despite this significant regulatory effort, the European Commission has detected an underuse of data , which is also often fragmented in terms of the conditions of its accessibility. This is due, in large part, to the existence of significant regulatory diversity. Measures are therefore needed to facilitate the simplification and streamlining of the European regulatory framework on data.
Specifically, it has been found that there is regulatory fragmentation that generates legal uncertainty and disproportionate compliance costs due to the complexity of the applicable regulatory framework itself. Specifically, the overlap between the General Data Protection Regulation (GDPR), the Data Governance Act, the Data Act, the Open Data Directive and, likewise, the existence of sectoral regulations specific to some specific areas has generated a complex regulatory framework which is difficult to face, especially if we think about the competitiveness of small and medium-sized companies. Each of these standards was designed to address specific challenges that were addressed successively, so a more coherent overview is needed to resolve potential inconsistencies and ultimately facilitate their practical implementation.
In this regard, the Strategy proposes to promote a new legislative instrument – the proposal for a Regulation called Digital Omnibus – which aims to consolidate the rules relating to the European single market in the field of data into a single standard. Specifically, with this initiative:
- The provisions of the Data Governance Act are merged into the regulation of the Data Act, thus eliminating duplications.
- The Regulation on non-personal data, whose functions are also covered by the Data Act, is repealed;
- Public sector data standards are integrated into the Data Act, as they were previously included in both the 2019 Directive and the Data Governance Act.
This regulation therefore consolidates the role of the Data Act as a general reference standard in the field. It also strengthens the clarity and precision of its forecasts, with the aim of facilitating its role as the main regulatory instrument through which it is intended to promote the accessibility of data in the European digital market.
Modifications in terms of personal data protection
The Digital Omnibus proposal also includes important new features with regard to the regulations on the protection of personal data, amending several provisions of Regulation (EU) 1016/679 of the European Parliament and of the Council of 27 April 2016 on the protection of natural persons with regard to the processing of personal data.
In order for personal data to be used – that is, any information referring to an identified or identifiable natural person – it is necessary that one of the circumstances referred to in Article 6 of the aforementioned Regulation is present, including the consent of the owner or the existence of a legitimate interest on the part of the person who is going to process the data.
Legitimate interest allows personal data to be processed when it is necessary for a valid purpose (improving a service, preventing fraud, etc.) and does not adversely affect the rights of the individual.
Source: Guide on legitimate interest. ISMS Forum and Data Privacy Institute. Available here: guiaintereslegitimo1637794373.pdf
Regarding the possibility of resorting to legitimate interest as a legal basis for training artificial intelligence tools, the current regulation allows the processing of personal data as long as the rights of the interested parties who own such data do not prevail.
However, given the generality of the concept of "legitimate interest", when deciding when personal data may be used under this clause , there will not always be absolute certainty, it will be necessary to analyse on a case-by-case basis: specifically, it will be necessary to carry out an activity of weighing the conflicting legal interests and, therefore, its application may give rise to reasonable doubts in many cases.
Although the European Data Protection Board has tried to establish some guidelines to specify the application of legitimate interest, the truth is that the use of open and indeterminate legal concepts will not always allow clear and definitive answers to be reached. To facilitate the specification of this expression in each case, the Strategy refers as a criterion to takeinto account the potential benefit that the processing may entail for the data subject and for society in general. Likewise, given that the consent of the owner of the data will not be necessary – and therefore, its revocation would not be applicable – it reinforces the right of opposition by the owner to the processing of their data and, above all, guarantees greater transparency regarding the conditions under which the data will be processed. Thus, by strengthening the legal position of the data subject and referring to this potential benefit, the Strategy aims to facilitate the use of legitimate interest as a legal basis for the use of personal data without the consent of the data subject, but with appropriate safeguards.
Another major data protection measure concerns the distinction between anonymised and pseudonymised data. The GDPR defines pseudonymisation as data processing that, until now, could no longer be attributed to a data subject without recourse to additional, separate information. However, pseudonymised data is still personal data and, therefore, subject to this regulation. On the other hand, anonymous data does not relate to identified or identifiable persons and therefore its use would not be subject to the GDPR. Consequently, in order to know whether we are talking about anonymous or pseudo-nimized data, it is essential to specify whether there is a "reasonable probability" of identifying the owner of the data.
However, the technologies currently available multiply the risk of re-identification of the data subject, which directly affects what could be considered reasonable, generating uncertainty that has a negative impact on technological innovation. For this reason, the Digital Omnibus proposal, along the lines already stated by the Court of Justice of the European Union, aims to establish the conditions under which pseudonymised data could no longer be considered personal data, thus facilitating its use. To this end, it empowers the European Commission, through implementing acts, to specify such circumstances, in particular taking into account the state of the art and, likewise, offering criteria that allow the risk of re-identification to be assessed in each specific case.
Scaling High-Value Datasets
The Strategy also aims to expand the catalogue of High Value Data (HVD) provided for in Implementing Regulation (EU) 2023/138. These are datasets with exceptional potential to generate social, economic and environmental benefits, as they are high-quality, structured and reliable data that are accessible under technical, organisational and semantic conditions that are very favourable for automated processing. Six categories are currently included (geospatial, Earth observation and environment, meteorology, statistics, business and mobility), to which the Commission would add, among other things, legal, judicial and administrative data.
Opportunity and challenge
The European Data Strategy represents a paradigmatic shift that is certainly relevant: it is not only a matter of promoting regulatory frameworks that facilitate the accessibility of data at a theoretical level but, above all, of making them work in their practical application, thus promoting the necessary conditions of legal certainty that allow a competitive and innovative data economy to be energized.
To this end, it is essential, on the one hand, to assess the real impact of the measures proposed through the Digital Omnibus and, on the other, to offer small and medium-sized enterprises appropriate legal instruments – practical guides, suitable advisory services, standard contractual clauses, etc. – to face the challenge that regulatory compliance poses for them in a context of enormous complexity. Precisely, this difficulty requires, on the part of the supervisory authorities and, in general, of public entities, to adopt advanced and flexible data governance models that adapt to the singularities posed by artificial intelligence, without affecting legal guarantees.
Content prepared by Julián Valero, professor at the University of Murcia and coordinator of the Innovation, Law, and Technology Research Group (iDerTec). The content and views expressed in this publication are the sole responsibility of the author.
Application
Web viewer that displays the fiber deployments of all PEBA and UNICO programs on a single map, based on publicly available data. Each area has the background color of the awarded operator, and the border is a different color for each program. In the case of the 2013-2019 PEBA plan, as deployments are assigned to individual population entities, a marker is shown with the location obtained from the CNIG. In addition, when the map is not zoomed in, a heat map is displayed showing the distribution of deployments by area.
This visualization avoids having to compare different map viewers if what we are interested in is seeing which operators reach which areas or simply having an overview of which deployments are pending in my area. It also allows us to consult aspects such as the updated completion date, which were previously only available in the different Excel files for each program. I also think it could be useful for analyzing how the areas are distributed among the different programs (for example, if an area covered in UNICO 2021 then has nearby areas in UNICO 2022 covered by another operator, for example), or even possible overlaps (for example, due to areas that were not executed in previous programs).
Noticia
Did you know that Spain created the first state agency specifically dedicated to the supervision of artificial intelligence (AI) in 2023? Even anticipating the European Regulation in this area, the Spanish Agency for the Supervision of Artificial Intelligence (AESIA) was born with the aim of guaranteeing the ethical and safe use of AI, promoting responsible technological development.
Among its main functions is to ensure that both public and private entities comply with current regulations. To this end, it promotes good practices and advises on compliance with the European regulatory framework, which is why it has recently published a series of guides to ensure the consistent application of the European AI regulation.
In this post we will delve into what the AESIA is and we will learn relevant details of the content of the guides.
What is AESIA and why is it key to the data ecosystem?
The AESIA was created within the framework of Axis 3 of the Spanish AI Strategy. Its creation responds to the need to have an independent authority that not only supervises, but also guides the deployment of algorithmic systems in our society.
Unlike other purely sanctioning bodies, the AESIA is designed as an intelligence Think & Do, i.e. an organisation that investigates and proposes solutions. Its practical usefulness is divided into three aspects:
- Legal certainty: Provides clear frameworks for businesses, especially SMEs, to know where to go when innovating.
- International benchmark: it acts as the Spanish interlocutor before the European Commission, ensuring that the voice of our technological ecosystem is heard in the development of European standards.
- Citizen trust: ensures that AI systems used in public services or critical areas respect fundamental rights, avoiding bias and promoting transparency.
Since datos.gob.es, we have always defended that the value of data lies in its quality and accessibility. The AESIA complements this vision by ensuring that, once data is transformed into AI models, its use is responsible. As such, these guides are a natural extension of our regular resources on data governance and openness.
Resources for the use of AI: guides and checklists
The AESIA has recently published materials to support the implementation and compliance with the European Artificial Intelligence regulations and their applicable obligations. Although they are not binding and do not replace or develop existing regulations, they provide practical recommendations aligned with regulatory requirements pending the adoption of harmonised implementing rules for all Member States.
They are the direct result of the Spanish AI Regulatory Sandbox pilot. This sandbox allowed developers and authorities to collaborate in a controlled space to understand how to apply European regulations in real-world use cases.
It is essential to note that these documents are published without prejudice to the technical guides that the European Commission is preparing. Indeed, Spain is serving as a "laboratory" for Europe: the lessons learned here will provide a solid basis for the Commission's working group, ensuring consistent application of the regulation in all Member States.
The guides are designed to be a complete roadmap, from the conception of the system to its monitoring once it is on the market.
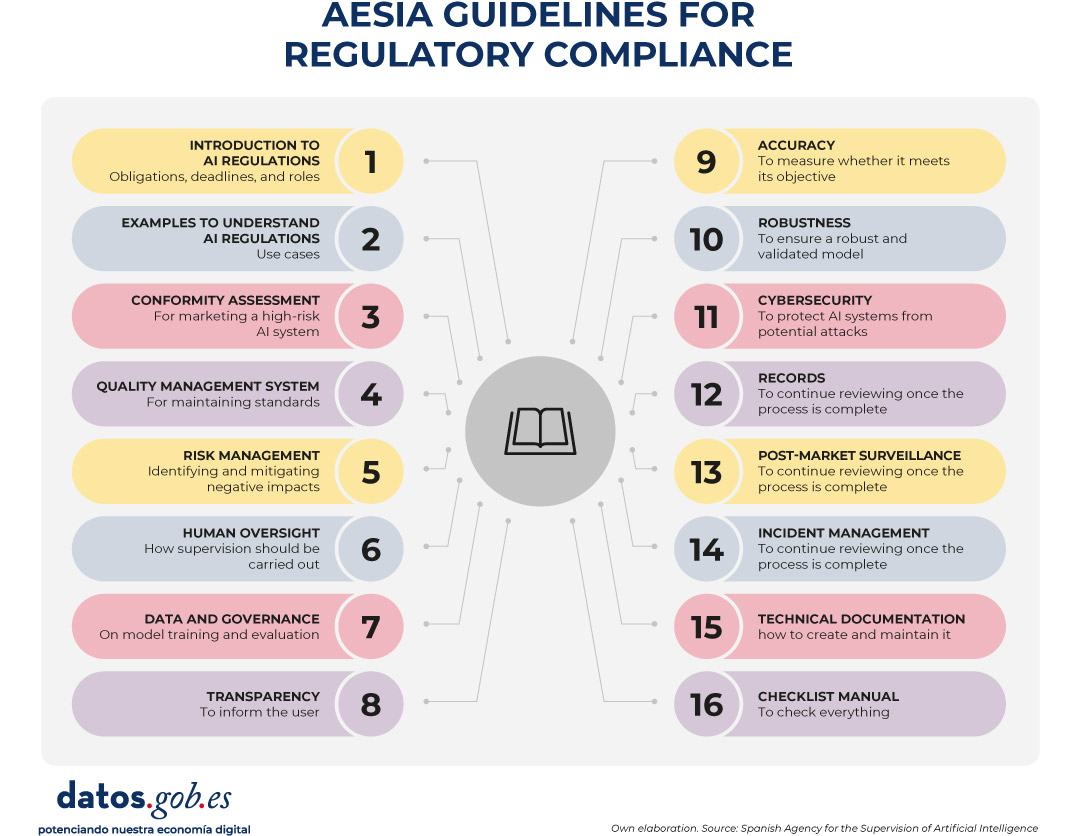
Figure 1. AESIA guidelines for regulatory compliance. Source: Spanish Agency for the Supervision of Artificial Intelligence
- 01. Introductory to the AI Regulation: provides an overview of obligations, implementation deadlines and roles (suppliers, deployers, etc.). It is the essential starting point for any organization that develops or deploys AI systems.
- 02. Practice and examples: land legal concepts in everyday use cases (e.g., is my personnel selection system a high-risk AI?). It includes decision trees and a glossary of key terms from Article 3 of the Regulation, helping to determine whether a specific system is regulated, what level of risk it has, and what obligations are applicable.
- 03. Conformity assessment: explains the technical steps necessary to obtain the "seal" that allows a high-risk AI system to be marketed, detailing the two possible procedures according to Annexes VI and VII of the Regulation as valuation based on internal control or evaluation with the intervention of a notified body.
- 04. Quality management system: defines how organizations must structure their internal processes to maintain constant standards. It covers the regulatory compliance strategy, design techniques and procedures, examination and validation systems, among others.
- 05. Risk management: it is a manual on how to identify, evaluate and mitigate possible negative impacts of the system throughout its life cycle.
- 06. Human surveillance: details the mechanisms so that AI decisions are always monitorable by people, avoiding the technological "black box". It establishes principles such as understanding capabilities and limitations, interpretation of results, authority not to use the system or override decisions.
- 07. Data and data governance: addresses the practices needed to train, validate, and test AI models ensuring that datasets are relevant, representative, accurate, and complete. It covers data management processes (design, collection, analysis, labeling, storage, etc.), bias detection and mitigation, compliance with the General Data Protection Regulation, data lineage, and design hypothesis documentation, being of particular interest to the open data community and data scientists.
- 08. Transparency: establishes how to inform the user that they are interacting with an AI and how to explain the reasoning behind an algorithmic result.
- 09. Accuracy: Define appropriate metrics based on the type of system to ensure that the AI model meets its goal.
- 10. Robustness: Provides technical guidance on how to ensure AI systems operate reliably and consistently under varying conditions.
- 11. Cybersecurity: instructs on protection against threats specific to the field of AI.
- 12. Logs: defines the measures to comply with the obligations of automatic registration of events.
- 13. Post-market surveillance: documents the processes for executing the monitoring plan, documentation and analysis of data on the performance of the system throughout its useful life.
- 14. Incident management: describes the procedure for reporting serious incidents to the competent authorities.
- 15. Technical documentation: establishes the complete structure that the technical documentation must include (development process, training/validation/test data, applied risk management, performance and metrics, human supervision, etc.).
- 16. Requirements Guides Checklist Manual: explains how to use the 13 self-diagnosis checklists that allow compliance assessment, identifying gaps, designing adaptation plans and prioritizing improvement actions.
All guides are available here and have a modular structure that accommodates different levels of knowledge and business needs.
The self-diagnostic tool and its advantages
In parallel, the AESIA publishes material that facilitates the translation of abstract requirements into concrete and verifiable questions, providing a practical tool for the continuous assessment of the degree of compliance.
These are checklists that allow an entity to assess its level of compliance autonomously.
The use of these checklists provides multiple benefits to organizations. First, they facilitate the early identification of compliance gaps, allowing organizations to take corrective action prior to the commercialization or commissioning of the system. They also promote a systematic and structured approach to regulatory compliance. By following the structure of the rules of procedure, they ensure that no essential requirement is left unassessed.
On the other hand, they facilitate communication between technical, legal and management teams, providing a common language and a shared reference to discuss regulatory compliance. And finally, checklists serve as a documentary basis for demonstrating due diligence to supervisory authorities.
We must understand that these documents are not static. They are subject to an ongoing process of evaluation and review. In this regard, the EASIA continues to develop its operational capacity and expand its compliance support tools.
From the open data platform of the Government of Spain, we invite you to explore these resources. AI development must go hand in hand with well-governed data and ethical oversight.
Blog
For more than a decade, open data platforms have measured their impact through relatively stable indicators: number of downloads, web visits, documented reuses, applications or services created based on them, etc. These indicators worked well in an ecosystem where users – companies, journalists, developers, anonymous citizens, etc. – directly accessed the original sources to query, download and process the data.
However, the panorama has changed radically. The emergence of generative artificial intelligence models has transformed the way people access information. These systems generate responses without the need for the user to visit the original source, which is causing a global drop in web traffic in media, blogs and knowledge portals.
In this new context, measuring the impact of an open data platform requires rethinking traditional indicators to incorporate new ones to the metrics already used that also capture the visibility and influence of data in an ecosystem where human interaction is changing.
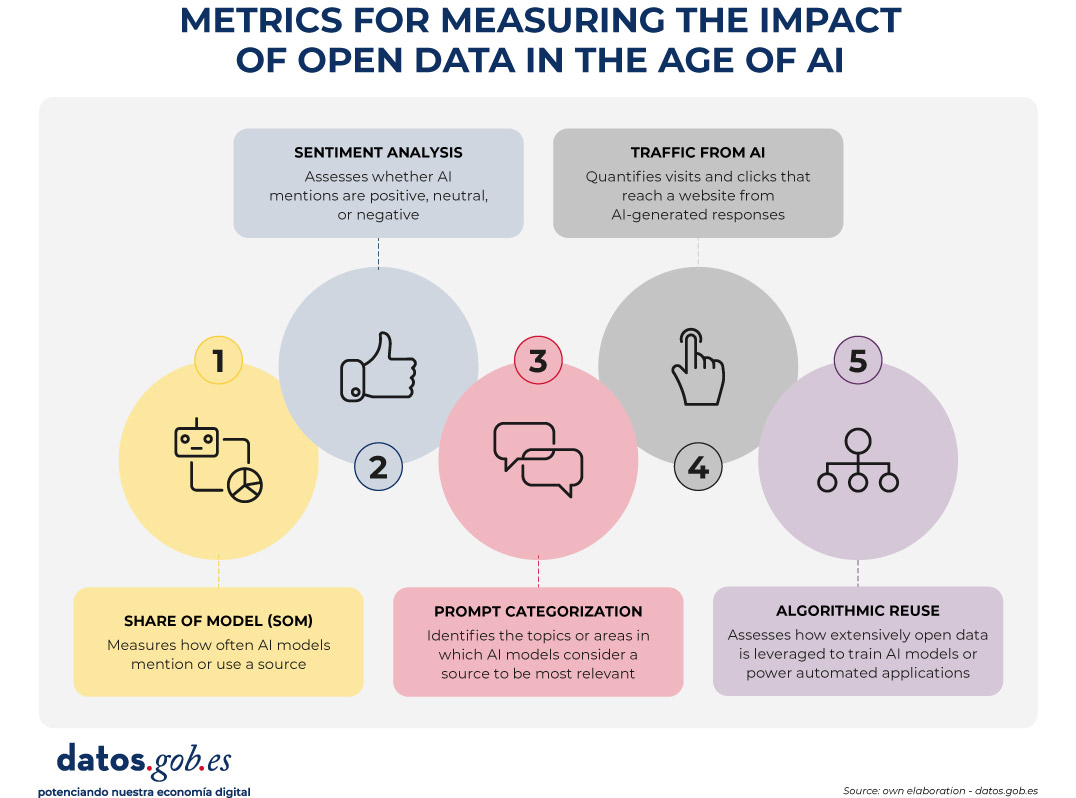
Figure 1. Metrics for measuring the impact of open data in the age of AI.
A structural change: from click to indirect consultation
The web ecosystem is undergoing a profound transformation driven by the rise of large language models (LLMs). More and more people are asking their questions directly to systems such as ChatGPT, Copilot, Gemini or Perplexity, obtaining immediate and contextualized answers without the need to resort to a traditional search engine.
At the same time, those who continue to use search engines such as Google or Bing are also experiencing relevant changes derived from the integration of artificial intelligence on these platforms. Google, for example, has incorporated features such as AI Overviews, which offers automatically generated summaries at the top of the results, or AI Mode, a conversational interface that allows you to drill down into a query without browsing links. This generates a phenomenon known as Zero-Click: the user performs a search on an engine such as Google and gets the answer directly on the results page itself. As a result, you don't need to click on any external links, which limits visits to the original sources from which the information is extracted.
All this implies a key consequence: web traffic is no longer a reliable indicator of impact. A website can be extremely influential in generating knowledge without this translating into visits.
New metrics to measure impact
Faced with this situation, open data platforms need new metrics that capture their presence in this new ecosystem. Some of them are listed below.
-
Share of Model (SOM): Presence in AI models
Inspired by digital marketing metrics, the Share of Model measures how often AI models mention, cite, or use data from a particular source. In this way, the SOM helps to see which specific data sets (employment, climate, transport, budgets, etc.) are used by the models to answer real questions from users, revealing which data has the greatest impact.
This metric is especially valuable because it acts as an indicator of algorithmic trust: when a model mentions a web page, it is recognizing its reliability as a source. In addition, it helps to increase indirect visibility, since the name of the website appears in the response even when the user does not click.
-
Sentiment analysis: tone of mentions in AI
Sentiment analysis allows you to go a step beyond the Share of Model, as it not only identifies if an AI model mentions a brand or domain, but how it does so. Typically, this metric classifies the tone of the mention into three main categories: positive, neutral, and negative.
Applied to the field of open data, this analysis helps to understand the algorithmic perception of a platform or dataset. For example, it allows detecting whether a model uses a source as an example of good practice, if it mentions it neutrally as part of an informative response, or if it associates it with problems, errors, or outdated data.
This information can be useful to identify opportunities for improvement, strengthen digital reputation, or detect potential biases in AI models that affect the visibility of an open data platform.
-
Categorization of prompts: in which topics a brand stands out
Analyzing the questions that users ask allows you to identify what types of queries a brand appears most frequently in. This metric helps to understand in which thematic areas – such as economy, health, transport, education or climate – the models consider a source most relevant.
For open data platforms, this information reveals which datasets are being used to answer real user questions and in which domains there is greater visibility or growth potential. It also allows you to spot opportunities: if an open data initiative wants to position itself in new areas, it can assess what kind of content is missing or what datasets could be strengthened to increase its presence in those categories.
-
Traffic from AI: clicks from digests generated
Many models already include links to the original sources. While many users don't click on such links, some do. Therefore, platforms can start measuring:
- Visits from AI platforms (when these include links).
- Clicks from rich summaries in AI-integrated search engines.
This means a change in the distribution of traffic that reaches websites from the different channels. While organic traffic—traffic from traditional search engines—is declining, traffic referred from language models is starting to grow.
This traffic will be smaller in quantity than traditional traffic, but more qualified, since those who click from an AI usually have a clear intention to go deeper.
It is important that these aspects are taken into account when setting growth objectives on an open data platform.
-
Algorithmic Reuse: Using Data in Models and Applications
Open data powers AI models, predictive systems, and automated applications. Knowing which sources have been used for their training would also be a way to know their impact. However, few solutions directly provide this information. The European Union is working to promote transparency in this field, with measures such as the template for documenting training data for general-purpose models, but its implementation – and the existence of exceptions to its compliance – mean that knowledge is still limited.
Measuring the increase in access to data through APIs could give an idea of its use in applications to power intelligent systems. However, the greatest potential in this field lies in collaboration with companies, universities and developers immersed in these projects, so that they offer a more realistic view of the impact.
Conclusion: Measure what matters, not just what's easy to measure
A drop in web traffic doesn't mean a drop in impact. It means a change in the way information circulates. Open data platforms must evolve towards metrics that reflect algorithmic visibility, automated reuse, and integration into AI models.
This doesn't mean that traditional metrics should disappear. Knowing the accesses to the website, the most visited or the most downloaded datasets continues to be invaluable information to know the impact of the data provided through open platforms. And it is also essential to monitor the use of data when generating or enriching products and services, including artificial intelligence systems. In the age of AI, success is no longer measured only by how many users visit a platform, but also by how many intelligent systems depend on its information and the visibility that this provides.
Therefore, integrating these new metrics alongside traditional indicators through a web analytics and SEO strategy * allows for a more complete view of the real impact of open data. This way we will be able to know how our information circulates, how it is reused and what role it plays in the digital ecosystem that shapes society today.
*SEO (Search Engine Optimization) is the set of techniques and strategies aimed at improving the visibility of a website in search engines.
Blog
Massive, superficial AI-generated content isn't just a problem, it's also a symptom. Technology amplifies a consumption model that rewards fluidity and drains our attention span.
We listen to interviews, podcasts and audios of our family at 2x. We watch videos cut into highlights, and we base decisions and criteria on articles and reports that we have only read summarized with AI. We consume information in ultra-fast mode, but at a cognitive level we give it the same validity as when we consumed it more slowly, and we even apply it in decision-making. What is affected by this process is not the basic memory of contents, which seems to be maintained according to controlled studies, but the ability to connect that knowledge with what we already had and to elaborate our own ideas with it. More than superficiality, it is worrying that this new way of thinking is sufficient in so many contexts.
What's new and what's not?
We may think that generative AI has only intensified an old dynamic in which content production is infinite, but our attention spans are the same. We cannot fool ourselves either, because since the Internet has existed, infinity is not new. If we were to say that the problem is that there is too much content, we would be complaining about a situation in which we have been living for more than twenty years. Nor is the crisis of authority of official information or the difficulty in distinguishing reliable sources from those that are not.
However, the AI slop, which is the flood of AI-generated digital content on the Internet, brings its own logic and new considerations, such as breaking the link between effort and content, or that all that is generated is a statistical average of what already existed. This uniform and uncontrolled flow has consequences: behind the mass-generated content there may be an orchestrated intention of manipulation, an algorithmic bias, voluntary or not, that harms certain groups or slows down social advances, and also a random and unpredictable distortion of reality.
But how much of what I read is AI?
By 2025, it has been estimated that a large portion of online content incorporates synthetic text: an Ahrefs analysis of nearly one million web pages published in the first half of the year found that 74.2% of new pages contained signals of AI-generated content. Graphite research from the same year cites that, during the first year of ChatGPT alone, 39% of all online content was already generated with AI. Since November 2024, that figure has remained stable at around 52%, meaning that since then AI content outnumbers human content.
However, there are two questions we should ask ourselves when we come across estimates of this type:
1. Is there a reliable mechanism to distinguish a written text from a generated text? If the answer is no, no matter how striking and coherent the conclusions are, we cannot give them value, because they could be true or not. It is a valuable quantitative data, but one that does not yet exist.
With the information we currently have, we can say that "AI-generated text" detectors fail as often as a random model would, so we cannot attribute reliability to them. In a recent study cited by The Guardian, detectors were correct about whether the text was generated with AI or not in less than 40% of cases. On the other hand, in the first paragraph of Don Quixote, certain detectors have also returned an 86% probability that the text was created by AI.
2. What does it mean that a text is generated with AI? On the other hand, the process is not always completely automatic (what we call copying and pasting) but there are many grays in the scale: AI inspires, organizes, assists, rewrites or expands ideas, and denying, delegitimizing or penalizing this writing would be ignoring an installed reality.
The two nuances above do not cancel out the fact that the AI slop exists, but this does not have to be an inevitable fate. There are ways to mitigate its effects on our abilities.
What are the antidotes?
We may not contribute to the production of synthetic content, but we cannot slow down what is happening, so the challenge is to review the criteria and habits of mind with which we approach both reading and writing content.
1. Prioritize what clicks: one of the few reliable signals we have left is that clicking sensation at the moment when something connects with a previous knowledge, an intuition that we had diffused or an experience of our own, and reorganizes it or makes it clear. We also often say that it "resonates". If something clicks, it's worth following, confirming, researching, and briefly elaborating on a personal level.
2. Look for friction with data: anchoring content in open data and verifiable sources introduces healthy friction against the AI slop. It reduces, above all, arbitrariness and the feeling of interchangeable content, because the data force us to interpret and put it in context. It is a way of putting stones in the excessively fluid river that is the generation of language, and it works when we read and when we write.
3. Who is responsible? The text exists easily now, the question is why it exists or what it wants to achieve, and who is ultimately responsible for that goal. It seeks the signature of people or organizations, not so much for authorship but for responsibility. He is wary of collective signatures, also in translations and adaptations.
4. Change the focus of merit: evaluate your inertia when reading, because perhaps one day you learned to give merit to texts that sounded convincing, used certain structures or went up to a specific register. It shifts value to non-generatable elements such as finding a good story, knowing how to formulate a vague idea or daring to give a point of view in a controversial context.
On the other side of the coin, it is also a fact that content created with AI enters with an advantage in the flow, but with a disadvantage in credibility. This means that the real risk now is that AI can create high-value content, but people have lost the ability to concentrate on valuing it. To this we must add the installed prejudice that, if it is with AI, it is not valid content. Protecting our cognitive abilities and learning to differentiate between compressible and non-compressible content is therefore not a nostalgic gesture, but a skill that in the long run can improve the quality of public debate and the substrate of common knowledge.
Content created by Carmen Torrijos, expert in AI applied to language and communication. The content and views expressed in this publication are the sole responsibility of the author.
Documentación
IA agents (such as Google ADK, Langchain and so) are so-called "brains". But these brains without "hands" cannot operate on the real world performing API requests or database queries. These "hands" are the tools.
The challenge is the following: how do you connect brain with hands in an standard, decoupled and scalable fashion? The answers is the Model Context Protocol (MCP).
As a practical exercise, we built a conversational agent system that explores the Open Data national repository hosted at datos.gob.es through natural language questions, smoothing in this way the access to open data.
In this practical exercise, the main objective is to illustrate, step by step, how to build an independent tools server that interacts with the MCP protocol.
To make this exercise tangible and not just theoretical, we will use FastMCP to build the server. To prove that our server works, we will create a simple agent with Google ADK that uses it. The use case (querying the datos.gob.es API) illustrates this connection between tools and agents. The real learning lies in the architecture, which you could reuse for any API or database.
Below are the technologies we will use and a diagram showing how the different components are related to each other.
-
FastMCP (mcp.server.fastmcp): a lightweight implementation of the MCP protocol that allows you to create tool servers with very little code using Python decorators. It is the “main character” of the exercise.
-
Google ADK (Agent Development Kit): a framework to define the AI agent, its prompt, and connect it to the tools. It is the “client” that tests our server.
-
FastAPI: used to serve the agent as a REST API with an interactive web interface.
-
httpx: used to make asynchronous calls to the external datos.gob.es API.
-
Docker and Docker Compose: used to package and orchestrate the two microservices, allowing them to run and communicate in isolation.
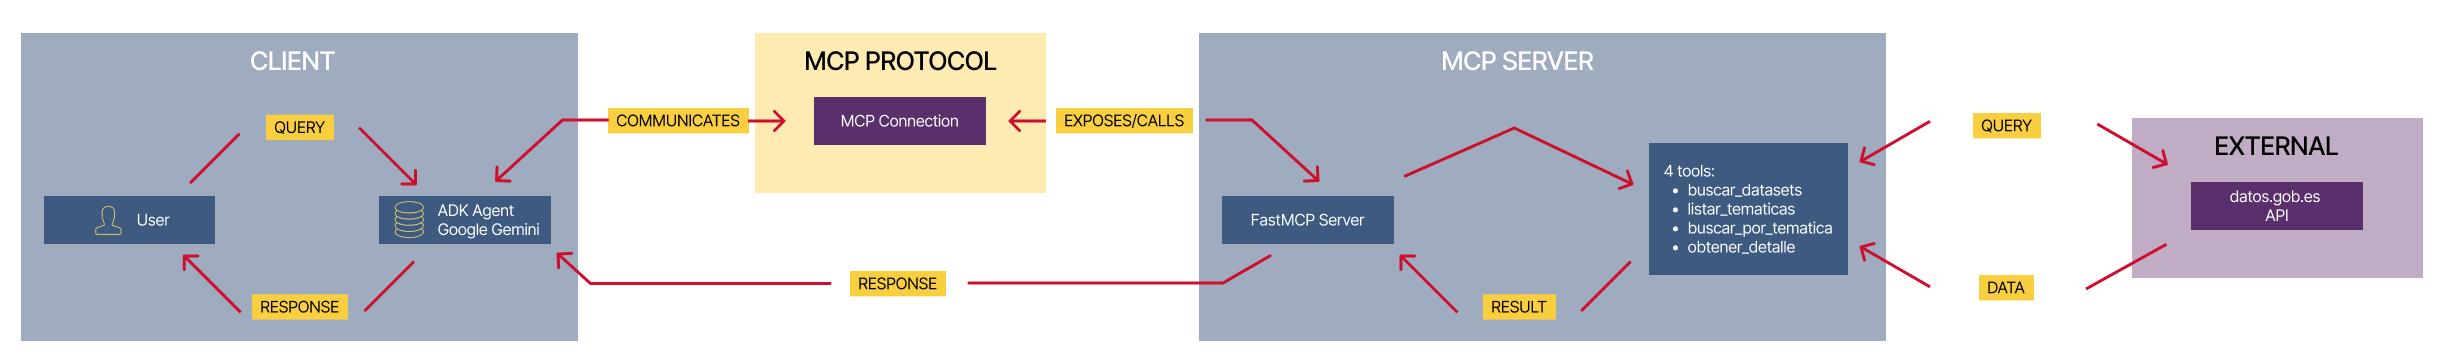
Figure 1. Decoupled architecture with MCP comunication.
Figure 1 illustrates a decoupled architecture divided into four main components that communicate via the MCP protocol. When the user makes a natural language query, the ADK Agent (based on Google Gemini) processes the intent and communicates with the MCP server through the MCP Protocol, which acts as a standardized intermediary. The MCP server exposes four specialized tools (search datasets, list topics, search by topic, and get details) that encapsulate all the business logic for interacting with the external datos.gob.es API. Once the tools execute the required queries and receive the data from the national catalog, the result is propagated back to the agent, which finally generates a user-friendly response, thus completing the communication cycle between the “brain” (agent) and the “hands” (tools).
Access the data lab repository on GitHub.
Run the data pre-processing code on Google Colab.
The architecture: MCP server and consumer agent
The key to this exercise is understanding the client–server relationship:
- The Server (Backend): it is the protagonist of this exercise. Its only job is to define the business logic (the “tools”) and expose them to the outside world using the standard MCP “contract.” It is responsible for encapsulating all the logic for communicating with the datos.gob.es API.
- The Agent (Frontend): it is the “client” or “consumer” of our server. Its role in this exercise is to prove that our MCP server works. We use it to connect, discover the tools that the server offers, and call them.
- The MCP Protocol: it is the “language” or “contract” that allows the agent and the server to understand each other without needing to know the internal details of the other.
Development process
The core of the exercise is divided into three parts: creating the server, creating a client to test it, and running them.
1. The tool server (the backend with MCP)
This is where the business logic lives and the main focus of this tutorial. In the main file (server.py), we define simple Python functions and use the FastMCP @mcp.tool decorator to expose them as consumable “tools.”
The description we add to the decorator is crucial, since it is the documentation that any MCP client (including our ADK agent) will read to know when and how to use each tool.
The tools we will define in this exercise are:
- buscar_datasets(titulo: str): to search for datasets by keywords in the title.
- listar_tematicas(): to discover which data categories exist.
- buscar_por_tematica(tematica_id: str): to find datasets for a specific topic.
- obtener_detalle_dataset(dataset_id: str): to retrieve the complete information for a dataset.
2. The consumer agent (the frontend with Google ADK)
Once our MCP server is built, we need a way to test it. This is where Google ADK comes in. We use it to create a simple “consumer agent.”
The magic of the connection happens in the tools argument. Instead of defining the tools locally, we simply pass it the URL of our MCP server. When the agent starts, it will query that URL, read the MCP “contract,” and automatically know which tools are available and how to use them.
# Ejemplo de configuración en agent.py
root_agent = LlmAgent(
   ...
   instruction="Eres un asistente especializado en datos.gob.es...",
   tools=[
       MCPToolset(
           connection_params=StreamableHTTPConnectionParams(
               url="http://mcp-server:8000/mcp",
           ),
       )
   ]
)
3. Orchestration with Docker Compose
Finally, to run our MCP Server and the consumer agent together, we use docker-compose.yml. Docker Compose takes care of building the images for each service, creating a private network so they can communicate (which is why the agent can call http://mcp-server:8000), and exposing the necessary ports.
Testing the MCP server in action
Once we run docker-compose up --build, we can access the agent’s web interface at http://localhost:8080.
The goal of this test is not only to see whether the bot responds correctly, but to verify that our MCP server works properly and that the ADK agent (our test client) can discover and use the tools it exposes.

Figure 2. Screenshot of the agent showing its tools.
The true power of decoupling becomes evident when the agent logically chains together the tools provided by our server.

Figure 3. Screenshot of the agent showing the joint use of tools.
What can we learn?
The goal of this exercise is to learn the fundamentals of a modern agent architecture, focusing on the tool server. Specifically:
- How to build an MCP server: how to create a tool server from scratch that speaks MCP, using decorators such as
@mcp.tool. - The decoupled architecture pattern: the fundamental pattern of separating the “brain” (LLM) from the “tools” (business logic).
- Dynamic tool discovery: how an agent (in this case, an ADK agent) can dynamically connect to an MCP server to discover and use tools.
- External API integration: the process of “wrapping” a complex API (such as datos.gob.es) in simple functions within a tool server.
- Orchestration with Docker: how to manage a microservices project for development.
Conclusions and future work
We have built a robust and functional MCP tool server. The real value of this exercise lies in the how: a scalable architecture centered around a tool server that speaks a standard protocol.
This MCP-based architecture is incredibly flexible. The datos.gob.es use case is just one example. We could easily:
- Change the use case: replace
server.pywith one that connects to an internal database or the Spotify API, and any agent that speaks MCP (not just ADK) could use it. - Change the “brain”: swap the ADK agent for a LangChain agent or any other MCP client, and our tool server would continue to work unchanged.
For those interested in taking this work to the next level, the possibilities focus on improving the MCP server:
- Implement more tools: add filters by format, publisher, or date to the MCP server.
- Integrate caching: use Redis in the MCP server to cache API responses and improve speed.
- Add persistence: store chat history in a database (this would be on the agent side).
Beyond these technical improvements, this architecture opens the door to many applications across very different contexts.
- Journalists and academics can have research assistants that help them discover relevant datasets in seconds.
- Transparency organizations can build monitoring tools that automatically detect new publications of public procurement or budget data.
- Consulting firms and business intelligence teams can develop systems that cross-reference information from multiple government sources to produce sector reports.
- Even in education, this architecture serves as a didactic foundation for teaching advanced concepts such as asynchronous programming, API integration, and AI agent design.
The pattern we have built—a decoupled tool server that speaks a standard protocol—is the foundation on which you can develop solutions tailored to your specific needs, regardless of the domain or data source you are working with.
Blog
Open data is a central piece of digital innovation around artificial intelligence as it allows, among other things, to train models or evaluate machine learning algorithms. But between "downloading a CSV from a portal" and accessing a dataset ready to apply machine learning techniques , there is still an abyss.
Much of that chasm has to do with metadata, i.e. how datasets are described (at what level of detail and by what standards). If metadata is limited to title, description, and license, the work of understanding and preparing data becomes more complex and tedious for the person designing the machine learning model. If, on the other hand, standards that facilitate interoperability are used, such as DCAT, the data becomes more FAIR (Findable, Accessible, Interoperable, Reusable) and, therefore, easier to reuse. However, additional metadata is needed to make the data easier to integrate into machine learning flows.
This article provides an overview of the various initiatives and standards needed to provide open data with metadata that is useful for the application of machine learning techniques.
DCAT as the backbone of open data portals
The DCAT (Data Catalog Vocabulary) vocabulary was designed by the W3C to facilitate interoperability between data catalogs published on the Web. It describes catalogs, datasets, and distributions, being the foundation on which many open data portals are built.
In Europe, DCAT is embodied in the DCAT-AP application profile, recommended by the European Commission and widely adopted to describe datasets in the public sector, for example, in Spain with DCAT-AP-ES. DCAT-AP answers questions such as:
- What datasets exist on a particular topic?
- Who publishes them, under what license and in what formats?
- Where are the download URLs or access APIs?
Using a standard like DCAT is imperative for discovering datasets, but you need to go a step further in order to understand how they are used in machine learning models or what quality they are from the perspective of these models.
MLDCAT-AP: Machine Learning in an Open Data Portal Catalog
MLDCAT-AP (Machine Learning DCAT-AP) is a DCAT application profile developed by SEMIC and the Interoperable Europe community, in collaboration with OpenML, that extends DCAT-AP to the machine learning domain.
MLDCAT-AP incorporates classes and properties to describe:
- Machine learning models and their characteristics.
- Datasets used in training and assessment.
- Quality metrics obtained on datasets.
- Publications and documentation associated with machine learning models.
- Concepts related to risk, transparency and compliance with the European regulatory context of the AI Act.
With this, a catalogue based on MLDCAT-AP no longer only responds to "what data is there", but also to:
- Which models have been trained on this dataset?
- How has that model performed by certain metrics?
- Where is this work described (scientific articles, documentation, etc.)?
MLDCAT-AP represents a breakthrough in traceability and governance, but the definition of metadata is maintained at a level that does not yet consider the internal structure of the datasets or what exactly their fields mean. To do this, it is necessary to go down to the level of the structure of the dataset distribution itself.
Metadata at the internal structure level of the dataset
When you want to describe what's inside the distributions of datasets (fields, types, constraints), an interesting initiative is Data Package, part of the Frictionless Data ecosystem.
A Data Package is defined by a JSON file that describes a set of data. This file includes not only general metadata (such as name, title, description or license) and resources (i.e. data files with their path or a URL to access their corresponding service), but also defines a schema with:
- Field names.
- Data types (integer, number, string, date, etc.).
- Constraints, such as ranges of valid values, primary and foreign keys, and so on.
From a machine learning perspective, this translates into the possibility of performing automatic structural validation before using the data. In addition, it also allows for accurate documentation of the internal structure of each dataset and easier sharing and versioning of datasets.
In short, while MLDCAT-AP indicates which datasets exist and how they fit into the realm of machine learning models, Data Package specifies exactly "what's there" within datasets.
Croissant: Metadata that prepares open data for machine learning
Even with the support of MLDCAT-AP and Data Package, it would be necessary to connect the underlying concepts in both initiatives. On the one hand, the field of machine learning (MLDCAT-AP) and on the other hand, that of the internal structures of the data itself (Data Package). In other words, the metadata of MLDCAT-AP and Data Package may be used, but in order to overcome some limitations that both suffer, it is necessary to complement it. This is where Croissant comes into play, a metadata format for preparing datasets for machine learning application. Croissant is developed within the framework of MLCommons, with the participation of industry and academia.
Specifically, Croissant is implemented in JSON-LD and built on top of schema.org/Dataset, a vocabulary for describing datasets on the Web. Croissant combines the following metadata:
- General metadata of the dataset.
- Description of resources (files, tables, etc.).
- Data structure.
- Semantic layer on machine learning (separation of training/validation/test data, target fields, etc.)
It should be noted that Croissant is designed so that different repositories (such as Kaggle, HuggingFace, etc.) can publish datasets in a format that machine learning libraries (TensorFlow, PyTorch, etc.) can load homogeneously. There is also a CKAN extension to use Croissant in open data portals.
Other complementary initiatives
It is worth briefly mentioning other interesting initiatives related to the possibility of having metadata to prepare datasets for the application of machine learning ("ML-ready datasets"):
- schema.org/Dataset: Used in web pages and repositories to describe datasets. It is the foundation on which Croissant rests and is integrated, for example, into Google's structured data guidelines to improve the localization of datasets in search engines.
- CSV on the Web (CSVW): W3C set of recommendations to accompany CSV files with JSON metadata (including data dictionaries), very aligned with the needs of tabular data documentation that is then used in machine learning.
- Datasheets for Datasets and Dataset Cards: Initiatives that enable the development of narrative and structured documentation to describe the context, provenance, and limitations of datasets. These initiatives are widely adopted on platforms such as Hugging Face.
Conclusions
There are several initiatives that help to make a suitable metadata definition for the use of machine learning with open data:
- DCAT-AP and MLDCAT-AP articulate catalog-level, machine learning models, and metrics.
- Data Package describes and validates the structure and constraints of data at the resource and field level.
- Croissant connects this metadata to the machine learning flow, describing how the datasets are concrete examples for each model.
- Initiatives such as CSVW or Dataset Cards complement the previous ones and are widely used on platforms such as HuggingFace.
These initiatives can be used in combination. In fact, if adopted together, open data is transformed from simply "downloadable files" to machine learning-ready raw material, reducing friction, improving quality, and increasing trust in AI systems built on top of it.
Jose Norberto Mazón, Professor of Computer Languages and Systems at the University of Alicante. The contents and views expressed in this publication are the sole responsibility of the author.
Blog
Three years after the acceleration of the massive deployment of Artificial Intelligence began with the launch of ChatGPT, a new term emerges strongly: Agentic AI. In the last three years, we have gone from talking about language models (such as LLMs) and chatbots (or conversational assistants) to designing the first systems capable not only of answering our questions, but also of acting autonomously to achieve objectives, combining data, tools and collaborations with other AI agents or with humans. That is, the global conversation about AI is moving from the ability to "converse" to the ability to "act" of these systems.
In the private sector, recent reports from large consulting firms describe AI agents that resolve customer incidents from start to finish, orchestrate supply chains, optimize inventories in the retail sector or automate business reporting. In the public sector, this conversation is also beginning to take shape and more and more administrations are exploring how these systems can help simplify procedures or improve citizen service. However, the deployment seems to be somewhat slower because logically the administration must not only take into account technical excellence but also strict compliance with the regulatory framework, which in Europe is set by the AI Regulation, so that autonomous agents are, above all, allies of citizens.
What is Agentic AI?
Although it is a recent concept that is still evolving, several administrations and bodies are beginning to converge on a definition. For example, the UK government describes agent AI as systems made up of AI agents that "can autonomously behave and interact to achieve their goals." In this context, an AI agent would be a specialized piece of software that can make decisions and operate cooperatively or independently to achieve the system's goals.
We might think, for example, of an AI agent in a local government who receives a request from a person to open a small business. The agent, designed in accordance with the corresponding administrative procedure, would check the applicable regulations, consult urban planning and economic activity data, verify requirements, fill in draft documents, propose appointments or complementary procedures and prepare a summary so that the civil servants could review and validate the application. That is, it would not replace the human decision, but would automate a large part of the work between the request made by the citizen and the resolution issued by the administration.
Compared to a conversational chatbot – which answers a question and, in general, ends the interaction there – an AI agent can chain multiple actions, review results, correct errors, collaborate with other AI agents and continue to iterate until it reaches the goal that has been defined for it. This does not mean that autonomous agents decide on their own without supervision, but that they can take over a good part of the task always following well-defined rules and safeguards.
Key characteristics of a freelance agent include:
- Perception and reasoning: is the ability of an agent to understand a complex request, interpret the context, and break down the problem into logical steps that lead to solving it.
- Planning and action: it is the ability to order these steps, decide the sequence in which they are going to be executed, and adapt the plan when the data changes or new constraints appear.
- Use of tools: An agent can, for example, connect to various APIs, query databases, open data catalogs, open and read documents, or send emails as required by the tasks they are trying to solve.
- Memory and context: is the ability of the agent to maintain the memory of interactions in long processes, remembering past actions and responses and the current state of the request it is resolving.
- Supervised autonomy: an agent can make decisions within previously established limits to advance towards the goal without the need for human intervention at each step, but always allowing the review and traceability of decisions.
We could summarize the change it entails with the following analogy: if LLMs are the engine of reasoning, AI agents are systems that , in addition to the ability to "think" about the actions that should be done, have "hands" to interact with the digital world and even with the physical world and execute those same actions.
The potential of AI agents in public services
Public services are organized, to a large extent, around processes of a certain complexity such as the processing of aid and subsidies, the management of files and licenses or the citizen service itself through multiple channels. They are processes with many different steps, rules and actors, where repetitive tasks and manual work of reviewing documentation abound.
As can be seen in the European Union's eGovernment Benchmark, eGovernment initiatives in recent decades have made it possible to move towards greater digitalisation of public services. However, the new wave of AI technologies, especially when foundational models are combined with agents, opens the door to a new leap to intelligently automate and orchestrate a large part of administrative processes.
In this context, autonomous agents would allow:
- Orchestrate end-to-end processes such as collecting data from different sources, proposing forms already completed, detecting inconsistencies in the documentation provided, or generating draft resolutions for validation by the responsible personnel.
- Act as "co-pilots" of public employees, preparing drafts, summaries or proposals for decisions that are then reviewed and validated, assisting in the search for relevant information or pointing out possible risks or incidents that require human attention.
- Optimise citizen service processes by supporting tasks such as managing medical appointments, answering queries about the status of files, facilitating the payment of taxes or guiding people in choosing the most appropriate procedure for their situation.
Various analyses on AI in the public sector suggest that this type of intelligent automation, as in the private sector, can reduce waiting times, improve the quality of decisions and free up staff time for more value-added tasks. A recent report by PWC and Microsoft exploring the potential of Agent AI for the public sector sums up the idea well, noting that by incorporating Agent AI into public services, governments can improve responsiveness and increase citizen satisfaction, provided that the right safeguards are in place.
In addition, the implementation of autonomous agents allows us to dream of a transition from a reactive administration (which waits for the citizen to request a service) to a proactive administration that offers to do part of those same actions for us: from notifying us that a grant has been opened for which we probably meet the requirements, to proposing the renewal of a license before it expires or reminding us of a medical appointment.
An illustrative example of the latter could be an AI agent that, based on data on available services and the information that the citizen himself has authorised to use, detects that a new aid has been published for actions to improve energy efficiency through the renovation of homes and sends a personalised notice to those who could meet the requirements. Even offering them a pre-filled draft application for review and acceptance. The final decision is still human, but the effort of seeking information, understanding conditions, and preparing documentation could be greatly reduced.
The role of open data
For an AI agent to be able to act in a useful and responsible way, they need to leverage on an environment rich in quality data and a robust data governance system. Among those assets needed to develop a good autonomous agent strategy, open data is important in at least three dimensions:
- Fuel for decision-making: AI agents need information on current regulations, service catalogues, administrative procedures, socio-economic and demographic indicators, data on transport, environment, urban planning, etc. To this end, data quality and structure is of great importance as outdated, incomplete, or poorly documented data can lead agents to make costly mistakes. In the public sector, these mistakes can translate into unfair decisions that could ultimately lead to a loss of public trust.
- Testbed for evaluating and auditing agents: Just as open data is important for evaluating generative AI models, it can also be important for testing and auditing autonomous agents. For example, simulating fictitious files with synthetic data based on real distributions to check how an agent acts in different scenarios. In this way, universities, civil society organizations and the administration itself can examine the behavior of agents and detect problems before scaling their use.
- Transparency and explainability: Open data could help document where the data an agent uses came from, how it has been transformed, or which versions of the datasets were in place when a decision was made. This traceability contributes to explainability and accountability, especially when an AI agent intervenes in decisions that affect people's rights or their access to public services. If citizens can consult, for example, the criteria and data that are applied to grant aid, confidence in the system is reinforced.
The panorama of agent AI in Spain and the rest of the world
Although the concept of agent AI is recent, there are already initiatives underway in the public sector at an international level and they are also beginning to make their way in the European and Spanish context:
- The Government Technology Agency (GovTech) of Singapore has published an Agentic AI Primer guide to guide developers and public officials on how to apply this technology, highlighting both its advantages and risks. In addition, the government is piloting the use of agents in various settings to reduce the administrative burden on social workers and support companies in complex licensing processes. All this in a controlled environment (sandbox) to test these solutions before scaling them.
- The UK government has published a specific note within its "AI Insights" documentation to explain what agent AI is and why it is relevant to government services. In addition, it has announced a tender to develop a "GOV.UK Agentic AI Companion" that will serve as an intelligent assistant for citizens from the government portal.
- The European Commission, within the framework of the Apply AI strategy and the GenAI4EU initiative, has launched calls to finance pilot projects that introduce scalable and replicable generative AI solutions in public administrations, fully integrated into their workflows. These calls seek precisely to accelerate the pace of digitalization through AI (including specialized agents) to improve decision-making, simplify procedures and make administration more accessible.
In Spain, although the label "agéntica AI" is not yet widely used, some experiences that go in that direction can already be identified. For example, different administrations are incorporating co-pilots based on generative AI to support public employees in tasks of searching for information, writing and summarizing documents, or managing files, as shown by initiatives of regional governments such as that of Aragon and local entities such as Barcelona City Council that are beginning to document themselves publicly.
The leap towards more autonomous agents in the public sector therefore seems to be a natural evolution on the basis of the existing e-government. But this evolution must, at the same time, reinforce the commitment to transparency, fairness, accountability, human oversight and regulatory compliance required by the AI Regulation and the rest of the regulatory framework and which should guide the actions of the public administration.
Looking to the Future: AI Agents, Open Data, and Citizen Trust
The arrival of agent AI once again offers the public administration new tools to reduce bureaucracy, personalize care and optimize its always scarce resources. However, technology is only a means, the ultimate goal is still to generate public value by reinforcing the trust of citizens.
In principle, Spain is in a good position: it has an Artificial Intelligence Strategy 2024 that is committed to transparent, ethical and human-centred AI, with specific lines to promote its use in the public sector; it has aconsolidated open data infrastructure; and it has created the Spanish Agency for the Supervision of Artificial Intelligence (AESIA) as a body in charge of ensuring an ethical and safe use of AI, in accordance with the European AI Regulation.
We are, therefore, facing a new opportunity for modernisation that can build more efficient, closer and even proactive public services. If we are able to adopt the Agent AI properly, the agents that are deployed will not be a "black box" that acts without supervision, but digital, transparent and auditable "public agents", designed to work with open data, explain their decisions and leave a trace of the actions they take. Tools, in short, inclusive, people-centred and aligned with the values of public service.
Content created by Jose Luis Marín, Senior Consultant in Data, Strategy, Innovation & Digitalisation. The contents and views expressed in this publication are the sole responsibility of the author.
Empresa reutilizadora
Geomatico is a company specializing in the development of open source Geographic Information Systems (GIS). They offer customized web maps and GIS dashboards that add value to their clients' data.
Blog
Cities, infrastructures and the environment today generate a constant flow of data from sensors, transport networks, weather stations and Internet of Things (IoT) platforms, understood as networks of physical devices (digital traffic lights, air quality sensors, etc.) capable of measuring and transmitting information through digital systems. This growing volume of information makes it possible to improve the provision of public services, anticipate emergencies, plan the territory and respond to challenges associated with climate, mobility or resource management.
The increase in connected sources has transformed the nature of geospatial data. In contrast to traditional sets – updated periodically and oriented towards reference cartography or administrative inventories – dynamic data incorporate the temporal dimension as a structural component. An observation of air quality, a level of traffic occupancy or a hydrological measurement not only describes a phenomenon, but also places it at a specific time. The combination of space and time makes these observations fundamental elements for operating systems, predictive models and analyses based on time series.
In the field of open data, this type of information poses both opportunities and specific requirements. Opportunities include the possibility of building reusable digital services, facilitating near-real-time monitoring of urban and environmental phenomena, and fostering a reuse ecosystem based on continuous flows of interoperable data. The availability of up-to-date data also increases the capacity for evaluation and auditing of public policies, by allowing decisions to be contrasted with recent observations.
However, the opening of geospatial data in real time requires solving problems derived from technological heterogeneity. Sensor networks use different protocols, data models, and formats; the sources generate high volumes of observations with high frequency; and the absence of common semantic structures makes it difficult to cross-reference data between domains such as mobility, environment, energy or hydrology. In order for this data to be published and reused consistently, an interoperability framework is needed that standardizes the description of observed phenomena, the structure of time series, and access interfaces.
The open standards of the Open Geospatial Consortium (OGC) provide that framework. They define how to represent observations, dynamic entities, multitemporal coverages or sensor systems; establish APIs based on web principles that facilitate the consultation of open data; and allow different platforms to exchange information without the need for specific integrations. Its adoption reduces technological fragmentation, improves coherence between sources and favours the creation of public services based on up-to-date data.
Interoperability: The basic requirement for opening dynamic data
Public administrations today manage data generated by sensors of different types, heterogeneous platforms, different suppliers and systems that evolve independently. The publication of geospatial data in real time requires interoperability that allows information from multiple sources to be integrated, processed and reused. This diversity causes inconsistencies in formats, structures, vocabularies and protocols, which makes it difficult to open the data and reuse it by third parties. Let's see which aspects of interoperability are affected:
- Technical interoperability: refers to the ability of systems to exchange data using compatible interfaces, formats and models. In real-time data, this exchange requires mechanisms that allow for fast queries, frequent updates, and stable data structures. Without these elements, each flow would rely on ad hoc integrations, increasing complexity and reducing reusability.
- The Semantic interoperability: Dynamic data describe phenomena that change over short periods – traffic levels, weather parameters, flows, atmospheric emissions – and must be interpreted consistently. This implies having observation models, Vocabularies and common definitions that allow different applications to understand the meaning of each measurement and its units, capture conditions or constraints. Without this semantic layer, the opening of data in real time generates ambiguity and limits its integration with data from other domains.
- Structural interoperability: Real-time data streams tend to be continuous and voluminous, making it necessary to represent them as time series or sets of observations with consistent attributes. The absence of standardized structures complicates the publication of complete data, fragments information and prevents efficient queries. To provide open access to these data, it is necessary to adopt models that adequately represent the relationship between observed phenomenon, time of observation, associated geometry and measurement conditions.
- Interoperability in access via API: it is an essential condition for open data. APIs must be stable, documented, and based on public specifications that allow for reproducible queries. In the case of dynamic data, this layer guarantees that the flows can be consumed by external applications, analysis platforms, mapping tools or monitoring systems that operate in contexts other than the one that generates the data. Without interoperable APIs, real-time data is limited to internal uses.
Together, these levels of interoperability determine whether dynamic geospatial data can be published as open data without creating technical barriers.
OGC Standards for Publishing Real-Time Geospatial Data
The publication of georeferenced data in real time requires mechanisms that allow any user – administration, company, citizens or research community – to access them easily, with open formats and through stable interfaces. The Open Geospatial Consortium (OGC) develops a set of standards that enable exactly this: to describe, organize and expose spatial data in an interoperable and accessible way, which contributes to the openness of dynamic data.
What is OGC and why are its standards relevant?
The OGC is an international organization that defines common rules so that different systems can understand, exchange and use geospatial data without depending on specific technologies. These rules are published as open standards, which means that any person or institution can use them. In the realm of real-time data, these standards make it possible to:
- Represent what a sensor measures (e.g., temperature or traffic).
- Indicate where and when the observation was made.
- Structure time series.
- Expose data through open APIs.
- Connect IoT devices and networks with public platforms.
Together, this ecosystem of standards allows geospatial data – including data generated in real time – to be published and reused following a consistent framework. Each standard covers a specific part of the data cycle: from the definition of observations and sensors, to the way data is exposed using open APIs or web services. This modular organization makes it easier for administrations and organizations to select the components they need, avoiding technological dependencies and ensuring that data can be integrated between different platforms.
The OGC API family: Modern APIs for accessing open data
Within OGC, the newest line is family OGC API, a set of modern web interfaces designed to facilitate access to geospatial data using URLs and formats such as JSON or GeoJSON, common in the open data ecosystem.
Estas API permiten:
- Get only the part of the data that matters.
- Perform spatial searches ("give me only what's in this area").
- Access up-to-date data without the need for specialized software.
- Easily integrate them into web or mobile applications.
In this report: "How to use OGC APIs to boost geospatial data interoperability", we already told you about some of the most popular OGP APIs. While the report focuses on how to use OGC APIs for practical interoperability, this post expands the focus by explaining the underlying OGC data models—such as O&M, SensorML, or Moving Features—that underpin that interoperability.
On this basis, this post focuses on the standards that make this fluid exchange of information possible, especially in open data and real-time contexts. The most important standards in the context of real-time open data are:
|
OGC Standard |
What it allows you to do |
Primary use in open data |
|---|---|---|
|
OGC API – Features |
Query features with geometry; filter by time or space; get data in JSON/GeoJSON. |
Open publication of dynamic mobility data, urban inventories, static sensors. |
|
OGC API – Environmental Data Retrieval (EDR) |
Request environmental observations at a point, zone or time interval. |
Open data on meteorology, climate, air quality or hydrology. |
|
OGC SensorThings API |
Manage sensors and their time series; transmit large volumes of IoT data. |
Publication of urban sensors (air, noise, water, energy) in real time. |
|
OGC API – Connected Systems |
Describe networks of sensors, devices and associated infrastructures. |
Document the structure of municipal IoT systems as open data. |
|
OGC Moving Features |
Represent moving objects using space-time trajectories. |
Open mobility data (vehicles, transport, boats). |
|
WMS-T |
View maps that change over time. |
Publication of multi-temporal weather or environmental maps. |
Table 1. OGC Standards Relevant to Real-Time Geospatial Data
Models that structure observations and dynamic data
In addition to APIs, OGC defines several conceptual data models that allow you to consistently describe observations, sensors, and phenomena that change over time:
- O&M (Observations & Measurements): A model that defines the essential elements of an observation—measured phenomenon, instant, unity, and result—and serves as the semantic basis for sensor and time series data.
- SensorML: Language that describes the technical and operational characteristics of a sensor, including its location, calibration, and observation process.
- Moving Features: A model that allows mobile objects to be represented by means of space-time trajectories (such as vehicles, boats or fauna).
These models make it easy for different data sources to be interpreted uniformly and combined in analytics and applications.
The value of these standards for open data
Using OGC standards makes it easier to open dynamic data because:
- It provides common models that reduce heterogeneity between sources.
- It facilitates integration between domains (mobility, climate, hydrology).
- Avoid dependencies on proprietary technology.
- It allows the data to be reused in analytics, applications, or public services.
- Improves transparency by documenting sensors, methods, and frequencies.
- It ensures that data can be consumed directly by common tools.
Together, they form a conceptual and technical infrastructure that allows real-time geospatial data to be published as open data, without the need to develop system-specific solutions.
Real-time open geospatial data use cases
Real-time georeferenced data is already published as open data in different sectoral areas. These examples show how different administrations and bodies apply open standards and APIs to make dynamic data related to mobility, environment, hydrology and meteorology available to the public.
Below are several domains where Public Administrations already publish dynamic geospatial data using OGC standards.
Mobility and transport
Mobility systems generate data continuously: availability of shared vehicles, positions in near real-time, sensors for crossing in cycle lanes, traffic gauging or traffic light intersection status. These observations rely on distributed sensors and require data models capable of representing rapid variations in space and time.
OGC standards play a central role in this area. In particular, the OGC SensorThings API allows you to structure and publish observations from urban sensors using a uniform model – including devices, measurements, time series and relationships between them – accessible through an open API. This makes it easier for different operators and municipalities to publish mobility data in an interoperable way, reducing fragmentation between platforms.
The use of OGC standards in mobility not only guarantees technical compatibility, but also makes it possible for this data to be reused together with environmental, cartographic or climate information, generating multi-thematic analyses for urban planning, sustainability or operational transport management.
Example:
The open service of Toronto Bike Share, which publishes in SensorThings API format the status of its bike stations and vehicle availability.
Here each station is a sensor and each observation indicates the number of bicycles available at a specific time. This approach allows analysts, developers or researchers to integrate this data directly into urban mobility models, demand prediction systems or citizen dashboards without the need for specific adaptations.
Air quality, noise and urban sensors
Networks for monitoring air quality, noise or urban environmental conditions depend on automatic sensors that record measurements every few minutes. In order for this data to be integrated into analytics systems and published as open data, consistent models and APIs need to be available.
In this context, services based on OGC standards make it possible to publish data from fixed stations or distributed sensors in an interoperable way. Although many administrations use traditional interfaces such as OGC WMS to serve this data, the underlying structure is usually supported by observation models derived from the Observations & Measurements (O&M) family, which defines how to represent a measured phenomenon, its unit and the moment of observation.
Example:
The service Defra UK-AIR Sensor Observation Service provides access to near-real-time air quality measurement data from on-site stations in the UK.
The combination of O&M for data structure and open APIs for publication makes it easier for these urban sensors to be part of broader ecosystems that integrate mobility, meteorology or energy, enabling advanced urban analyses or environmental dashboards in near real-time.
Water cycle, hydrology and risk management
Hydrological systems generate crucial data for risk management: river levels and flows, rainfall, soil moisture or information from hydrometeorological stations. Interoperability is especially important in this domain, as this data is combined with hydraulic models, weather forecasting, and flood zone mapping.
To facilitate open access to time series and hydrological observations, several agencies use OGC API – Environmental Data Retrieval (EDR), an API designed to retrieve environmental data using simple queries at points, areas, or time intervals.
Example:
The USGS (United States Geological Survey), which documents the use of OGC API – EDR to access precipitation, temperature, or hydrological variable series.
This case shows how EDR allows you to request specific observations by location or date, returning only the values needed for analysis. While the USGS's specific hydrology data is served through its proprietary API, this case demonstrates how EDR fits into the hydrometeorological data structure and how it is applied in real operational flows.
The use of OGC standards in this area allows dynamic hydrological data to be integrated with flood zones, orthoimages or climate models, creating a solid basis for early warning systems, hydraulic planning and risk assessment.
Weather observation and forecasting
Meteorology is one of the domains with the highest production of dynamic data: automatic stations, radars, numerical prediction models, satellite observations and high-frequency atmospheric products. To publish this information as open data, the OGC API family is becoming a key element, especially through OGC API – EDR, which allows observations or predictions to be retrieved in specific locations and at different time levels.
Example:
The service NOAA OGC API – EDR, which provides access to weather data and atmospheric variables from the National Weather Service (United States).
This API allows data to be consulted at points, areas or trajectories, facilitating the integration of meteorological observations into external applications, models or services based on open data.
The use of OGC API in meteorology allows data from sensors, models, and satellites to be consumed through a unified interface, making it easy to reuse for forecasting, atmospheric analysis, decision support systems, and climate applications.
Best Practices for Publishing Open Geospatial Data in Real-Time
The publication of dynamic geospatial data requires adopting practices that ensure its accessibility, interoperability, and sustainability. Unlike static data, real-time streams have additional requirements related to the quality of observations, API stability, and documentation of the update process. Here are some best practices for governments and organizations that manage this type of data.
- Stable open formats and APIs: The use of OGC standards – such as OGC API, SensorThings API or EDR – makes it easy for data to be consumed from multiple tools without the need for specific adaptations. APIs must be stable over time, offer well-defined versions, and avoid dependencies on proprietary technologies. For raster data or dynamic models, OGC services such as WMS, WMTS, or WCS are still suitable for visualization and programmatic access.
- DCAT-AP and OGC Models Compliant Metadata: Catalog interoperability requires describing datasets using profiles such as DCAT-AP, supplemented by O&M-based geospatial and observational metadata or SensorML. This metadata should document the nature of the sensor, the unit of measurement, the sampling rate, and possible limitations of the data.
- Quality, update frequency and traceability policies: dynamic datasets must explicitly indicate their update frequency, the origin of the observations, the validation mechanisms applied and the conditions under which they were generated. Traceability is essential for third parties to correctly interpret data, reproduce analyses and integrate observations from different sources.
- Documentation, usage limits, and service sustainability: Documentation should include usage examples, query parameters, response structure, and recommendations for managing data volume. It is important to set reasonable query limits to ensure the stability of the service and ensure that management can maintain the API over the long term.
- Licensing aspects for dynamic data: The license must be explicit and compatible with reuse, such as CC BY 4.0 or CC0. This allows dynamic data to be integrated into third-party services, mobile applications, predictive models or services of public interest without unnecessary restrictions. Consistency in the license also facilitates the cross-referencing of data from different sources.
These practices allow dynamic data to be published in a way that is reliable, accessible, and useful to the entire reuse community.
Dynamic geospatial data has become a structural piece for understanding urban, environmental and climatic phenomena. Its publication through open standards allows this information to be integrated into public services, technical analyses and reusable applications without the need for additional development. The convergence of observation models, OGC APIs, and best practices in metadata and licensing provides a stable framework for administrations and reusers to work with sensor data reliably. Consolidating this approach will allow progress towards a more coherent, connected public data ecosystem that is prepared for increasingly demanding uses in mobility, energy, risk management and territorial planning.
Content created by Mayte Toscano, Senior Consultant in Technologies related to the data economy. The content and views expressed in this publication are the sole responsibility of the author.