Noticia
Training is one of the pillars that support the open data ecosystem in Europe. Publishing data is essential, but just as important is that there are capabilities to understand, reuse and manage it properly. In this context, the European Open Data Portal (data.europa.eu) offers an online training programme that allows you to become familiar with the open data ecosystem from different angles: basic concepts, legal frameworks, emerging trends, success stories or good practices of publication and reuse.
This program has incorporated a relevant novelty in 2026: learning paths or structured learning itineraries, which allow you to advance step by step in the domain of open data.
From datos.gob.es we want to publicize this update, which reinforces the European training offer and complements already consolidated initiatives. We tell you about it in this post.
What changes in 2026? Step-by-step itineraries
The main novelty is the incorporation of learning paths, conceived as structured training paths that group content (readings, videos and quizzes) in a logical and progressive order.
Until now, the academy allowed free access to courses organized by subject (Policy, Legal, Quality, Business, Impact, Communication and Portal) and level (beginner, intermediate or advanced). With the new itineraries, learning becomes a more guided experience:
- An itinerary is chosen according to the level of experience.
- Progress is made sequentially.
- Activities and questionnaires are carried out.
- A certification is obtained at the end.
This structure makes learning particularly easy for those who are looking for an orderly training, with clear objectives and a defined progression.
The new itineraries are especially aimed at the public sector, although anyone interested can take them. They are organized into three levels.
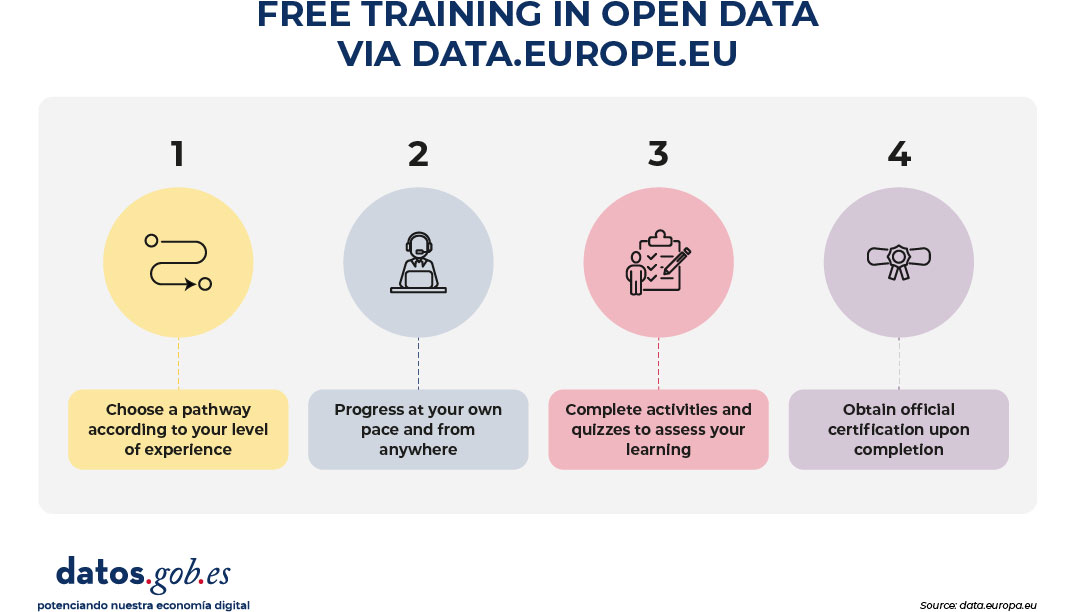
Figure 1. Free training process in open data via data.europe.eu
1. Beginner Level: The Basics of Open Data
Approximate duration: 4 hours and 23 minutes.
This itinerary provides a solid foundation for understanding:
- What is open data?
- What are its fundamental principles?
- How they are published.
- What benefits they generate for innovation, transparency and reuse.
It is intended for people who are new to working with data or want to understand the general framework of open data. It is also useful for non-technical profiles that need a strategic vision. The goal is to build a robust conceptual foundation before addressing more complex aspects.
2. Intermediate level: the legal and strategic framework
Approximate duration: 7 hours and 3 minutes.
The second itinerary delves into the legal and public policy aspects that underpin the European data strategy. Among the topics covered are:
- The European regulatory framework on data.
- The legal implications of information sharing.
- Reuse licenses.
- Regulatory compliance.
This level is especially relevant for transparency managers, legal advisors, portal managers and profiles involved in data governance.
Understanding the legal framework is a requirement to publish data with guarantees and encourage its reuse in a secure way and in accordance with European regulations.
3. Advanced level: quality and interoperability
Approximate duration: 4 hours and 39 minutes.
The third itinerary addresses two critical issues for the success of open data: quality and interoperability.
Content includes:
- Data quality principles and metrics.
- Interoperability methodologies.
- Standardization guidelines.
- Advanced metadata management.
- Application of European standards such as DCAT-AP.
This level is aimed at technical or strategic profiles that want to improve the coherence, accessibility and reuse of published data.
In a European context where cross-border interoperability is essential, adopting common standards is a condition for generating real impact.
Digital Certificates & Badges
One of the most attractive elements of the update is the possibility of obtaining official certificates upon completion of each training itinerary.
To get them, the process is simple:
- Complete all the modules of the itinerary.
- Pass the final quiz.
- Download the corresponding certificate.
In addition, the academy allows you to earn digital badges as you progress through the content. These credentials can be shared in professional profiles and are a tangible way to accredit open data competencies.
In a work environment where data literacy is increasingly in demand, having European certificates reinforces the professional profile and demonstrates commitment to continuous training.
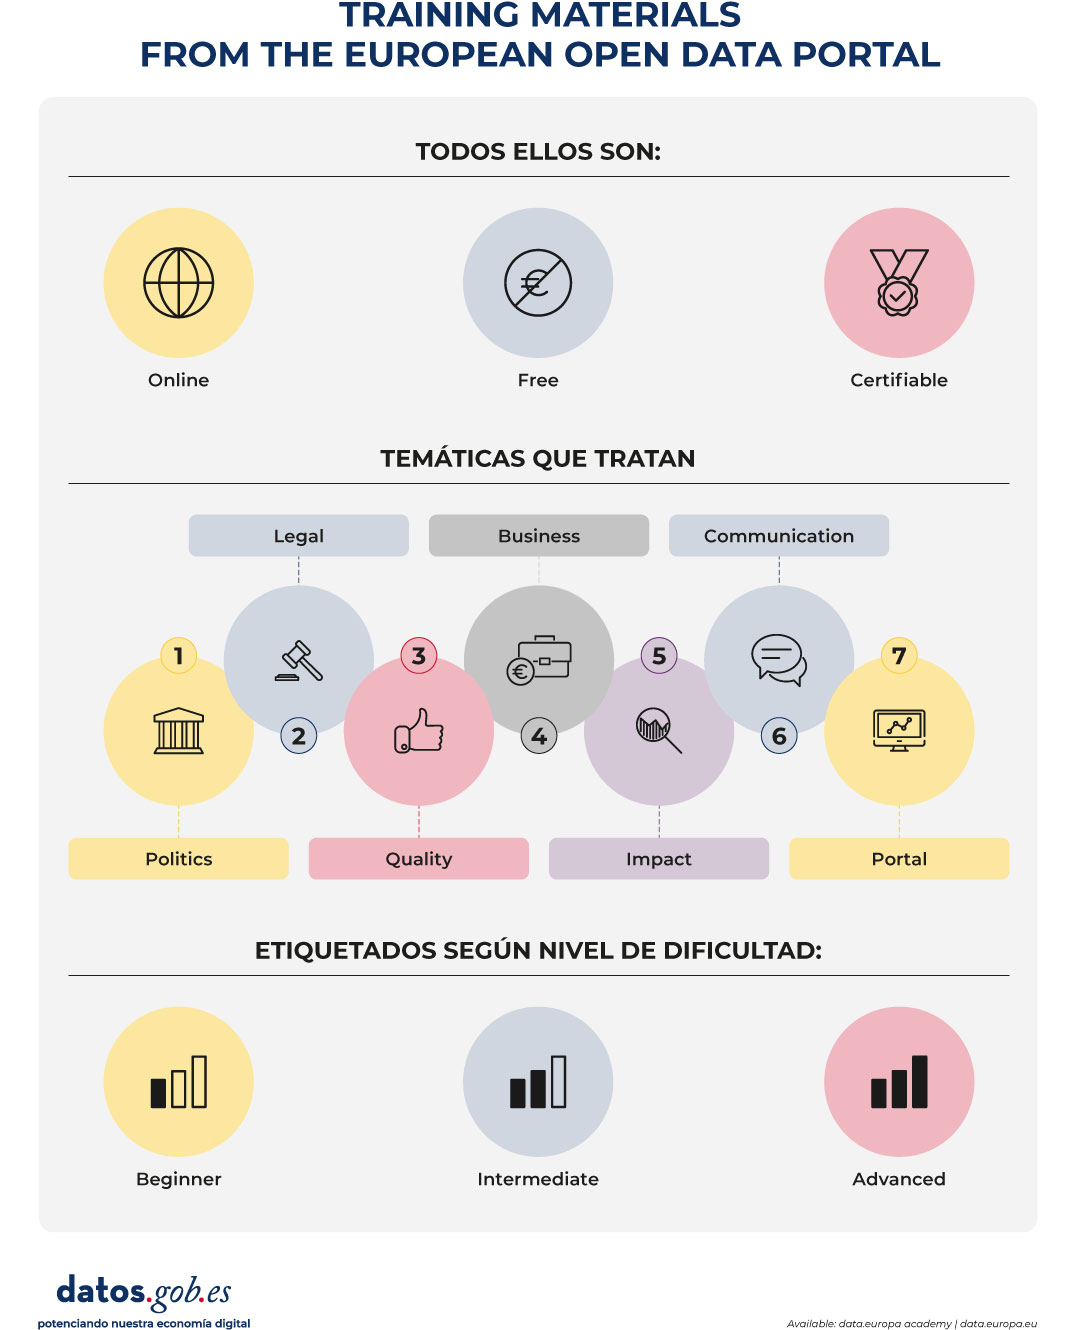
Figure 2. Training materials from the European open data portal. Source: own elaboration
Continuous training as a strategic element
One of the strengths of the academy is its applied approach. The contents show how open data is connected to specific challenges such as improving public services, promoting innovation and economic development or transparency and the evaluation of public policies.
In addition, as it is a free and accessible online platform, it eliminates economic barriers and facilitates participation from any territory.
In this sense, learning paths represent a step forward towards a more structured, coherent and recognizable training. Because, by integrating content, evaluation and certification in a single journey, the academy reinforces the value of learning and makes it easier for each person to advance at their own pace.
The European data ecosystem is evolving rapidly. The European data strategy, sectoral data spaces and common interoperability standards require trained professionals aligned with a shared vision.
The incorporation of structured itineraries in the data.europa.eu academy is a commitment to strengthen the skills necessary for open data to generate public value. Because these new training itineraries define a clearer, more progressive and accessible learning path for the entire community. The academy update will roll out throughout 2026. From datos.gob.es we will continue to share relevant information for the Spanish open data community.
Blog
Data visualization is not a recent discipline. For centuries, people have used graphs , maps, and diagrams to represent complex information. Classic examples such as the statistical maps of the nineteenth century or the graphs used in the press show that the need to "see" the data in order to understand it has always existed.
For a long time, creating visualizations required specialized knowledge and access to professional tools, which limited their production to very specific profiles. However, the digital and technological revolution has profoundly transformed this landscape. Today, anyone with access to a computer and data can create visualizations. Tools have been democratized, many of them are free or open source, and visualization work has extended beyond design to integrate into areas such as statistics, data science, academic research, public administration, or education.
Today, data visualization is a transversal competence that allows citizens to explore public information, institutions to better communicate their policies, and reusers to generate new services and knowledge from open data. In this post we present some of the most accessible and used options in data visualization.
A broad and diverse ecosystem of tools
The ecosystem of data visualization tools is broad and diverse, both in functionalities and levels of complexity. There are options designed for a first exploration of the data, others aimed at in-depth analysis and some designed to create interactive visualizations or complex digital narratives.
This variety allows you to tailor the visualization to different contexts and goals—from understanding a dataset in advance to publishing interactive charts, dashboards, or maps on the web.
The Data Visualization Society's annual survey reflects this diversity and shows how the use of certain tools evolves over time, consolidating some widely known options and giving way to new solutions that respond to emerging needs. These are some of the tools mentioned in the survey, ordered according to usage profiles.
The following criteria have been taken into account for the preparation of this list:
- Degree of use and maturity of the tool.
- Free access, free or with open versions.
- Useful for projects related to public data.
- Priority to open tools or with free versions.
Simple tools to get started
These tools are characterized by visual interfaces, a low learning curve, and the ability to create basic charts quickly. They are especially useful for getting started exploring open datasets or for outreach activities.
- Excel: it is one of the most widespread and well-known tools. It allows basic graphs and first data scans to be carried out in a simple way. While not specifically designed for advanced visualization, it is still a common gateway to working with data and its graphical representation.
- Google Sheets: works as a free and collaborative alternative to Excel. Its main advantage is the ability to work in a shared way and publish simple graphics online, which facilitates the dissemination of basic visualizations.
- Datawrapper: widely used in public communication and data journalism. It allows you to create clear graphs, maps, and interactive tables without the need for technical knowledge. It is particularly suitable for explaining data in a way that is understandable to a wide audience.
- RAWGraphs: free software tool aimed at visual exploration. It allows you to experiment with less common types of charts and discover new ways to represent data. It is especially useful in exploratory phases.
- Canva: While its approach is more informative than analytical, it can be useful for creating simple visual pieces that integrate basic graphics with design elements. It is suitable for visual communication of results, not so much for data analysis.
Data exploration and analysis tools
This group of tools is geared towards profiles that want to go beyond basic charts and perform more structured analysis. Many of them are open and widely consolidated in the field of data analysis.
- A: Free programming language widely used in statistics and data analysis. It has a wide ecosystem of packages that allow you to work with public data in a reproducible and transparent way.
- Ggplot2: R language display library. It is one of the most powerful tools for creating rigorous and well-structured graphs, both for analysis and for communicating results.
- Python (Matplotlib and Plotly): Python is one of the most widely used languages in data analysis. Matplotlib allows you to create customizable static charts, while Plotly makes it easy to create interactive visualizations. Together they offer a good balance between power and flexibility.
- Apache Superset: Open source platform for data analysis and dashboard creation. It has a more institutional and scalable approach, making it suitable for organizations that work with large volumes of public data.
This block is especially relevant for open data reusers and intermediate technical profiles who seek to combine analysis and visualization in a systematic way.
Tools for interactive and web visualization
These tools allow you to create advanced visualizations for publication in web environments. Although they require greater technical knowledge, they offer great flexibility and expressive possibilities.
- D3.js: it is one of the benchmarks in web visualization. It is based on open standards and allows full control over the visual representation of data. Its flexibility is very high, although so is its complexity.
In this practical exercise you can see how to use this library
- Vega and Vega-Lite: declarative languages for visualization that simplify the use of D3. They allow you to define graphics in a structured and reproducible way, offering a good balance between power and simplicity.
- Observable: interactive environment closely linked to D3 and Vega. It's especially useful for creating educational examples, prototypes, and exploratory visualizations that combine code, text, and graphics.
- Three.js and WebGL: technologies aimed at advanced and three-dimensional visualizations. Its use is more experimental and is usually linked to dissemination projects or visual research.
In this section, it should be noted that, although the technical barriers are greater, these tools allow for the creation of rich interactive experiences that can be very effective in communicating complex public data.
Geospatial data and mapping tools
Geographic visualization is especially relevant in the field of open data, since a large part of public information has a territorial dimension. In this field, free software has a prominent weight and is closely aligned with use in public administrations.
- QGIS: a benchmark in free software for geographic information systems (GIS). It is widely used in public administrations and allows spatial data to be analysed and visualised in great detail.
- ArcGIS: very widespread in the institutional field. Although it is not free software, its use is well established and is part of the regular ecosystem of many public organizations.
- Mapbox: platform aimed at creating interactive web maps. It is widely used in online visualization projects and allows geographic data to be integrated into web applications.
- Leaflet: A popular open-source library for creating interactive maps on the web. It is lightweight, flexible, and widely used in geographic open data reuse projects.
This toolkit facilitates the territorial representation of data and its reuse in local, regional or national contexts.
In conclusion, the choice of a visualization tool depends largely on the goal being pursued. Learning and experimenting is not the same as analyzing data in depth or communicating results to a wide audience. Therefore, it is useful to reflect beforehand on the type of data available, the audience to which the visualization is aimed and the message you want to convey.
Betting on accessible and open tools allows more people to explore, interpret and communicate public data. In this sense, visualising data is also a way of bringing information closer to citizens and encouraging its reuse.
Blog
Data visualizations act as bridges between complex information and human understanding. A well-designed graph can communicate in seconds data that would take minutes or even hours to decipher in tabular format. What's more, interactive visualizations allow each user to explore data from their own perspective, filtering, comparing, and uncovering personalized insights.
To achieve these ends there are multiple tools, some of which we have addressed on previous occasions. Today we are approaching a new example: the free bookstore D3.js. In this post, we explain how it allows you to generate useful and attractive data visualizations together with the open source tool Observable.
What is D3?
D3.js (Data-Driven Documents) is a JavaScript library that allows you to create custom data visualizations in web browsers. Unlike tools that offer predefined charts, D3.js provides the fundamental elements to build virtually any type of visualization imaginable.
The library is completely free and open source, published under a BSD license, which means that any person or organization can use, modify, and distribute it without restrictions. This feature has contributed to its widespread adoption: international media such as The New York Times, The Guardian, Financial Times, and local media such as El País or ABC use D3.js to create journalistic visualizations that help tell stories with data.
D3.js works by manipulating the browser's DOM (Document Object Model). In practical terms, this means that it takes information (e.g., a CSV file with population data) and transforms it into visual elements (circles, bars, lines) that the browser can display. The power of D3.js lies in its flexibility: it doesn't impose a specific way to visualize data, but rather provides the tools to create exactly what is needed.
What is Observable?
Observable is a web-based platform for creating and sharing code, specially designed to work with data and visualizations. Although it offers a freemium service with some free and some paid features, it maintains an open-source philosophy that is particularly relevant for working with public data.
The distinguishing feature of Observable is its "notebook" format. Similar to tools like Jupyter Notebooks in Python, an Observable notebook combines code, visualizations, and explanatory text into a single interactive document. Each cell in the notebook can contain JavaScript code that runs immediately, displaying results instantly. This creates an ideal experimentation environment for exploring data.
You can see it in practice in this data science exercise that we have published in datos.gob.es
Observable integrates naturally with D3.js and other display libraries. In fact, the creator of D3.js is also one of the founders of Observable, so both tools work together in a fluid way. Observable notebooks can be shared publicly, allowing other users to view both the code and the results, fork them to create their own versions, or integrate them into their own projects.
Advantages of the tool to work with all types of data
Both D3.js and Observable have features that can be useful for working with data, including open data:
- Transparency and reproducibility: by publishing a visualization created with these tools, it is possible to share both the final result and the entire data transformation process. Anyone can inspect the code, verify the calculations, and reproduce the results. This transparency is essential when working with public information, where trust and verifiability are essential.
- No licensing costs: Both D3.js and the free version of Observable allow you to create and publish visualizations without the need to purchase software licenses. This removes economic barriers for organizations, journalists, researchers, or citizens who want to work with open data.
- Standard web formats: The created visualizations work directly in web browsers without the need for plugins or additional software. This makes it easy to integrate them into institutional websites, newspaper articles or digital reports, making them accessible from any device.
- Community and resources: There is a large community of users who share examples, tutorials, and solutions to common problems. Observable, in particular, houses thousands of public notebooks that serve as examples and reusable templates.
- Technical flexibility: Unlike tools with predefined options, these libraries allow you to create completely customized visualizations that are exactly tailored to the specific needs of each dataset or story you want to tell.
It is important to note that these tools require programming knowledge, specifically JavaScript. For people with no programming experience, there is a learning curve that can be steep initially. Other tools such as spreadsheets or visualization software with graphical interfaces may be more appropriate for users looking for quick results without writing code.
For those looking for open source alternatives with a smooth learning curve, there are visual interface-based tools that don't require programming. For example, RawGraphs allows you to create complex visualizations by simply dragging and dropping files, while Datawrapper is an excellent and very intuitive option for generating ready-to-publish charts and maps.
In addition, there are numerous open source and commercial alternatives for visualizing data: Python with libraries such as Matplotlib or Plotly, R with ggplot2, Tableau Public, Power BI, among many others. In the didactic section of visualization and data science exercises of datos.gob.es you can find practical examples of how to use some of them.
In summary, the choice of tools should always be based on an assessment of specific requirements, available resources, and project objectives. The important thing is that open data is transformed into accessible knowledge, and there are multiple ways to achieve this goal. D3.js and Observable offer one of these paths, particularly suited to those looking to combine technical flexibility with principles of openness and transparency. If you know of any other tool or would like us to delve into another topic, please send it to us through our social networks or in the contact form.
Blog
Christmas returns every year as an opportunity to stop, breathe and reconnect with what inspires us. From datos.gob.es, we take advantage of these dates to share our traditional letter of recommendations: a selection of books that invite us to better understand the digital world, reflect on the impact of artificial intelligence, improve our professional skills and look at the ethical dilemmas that mark our time.
In this post, we compile works on technological ethics, digital society, AI engineering, quantum computing, machine learning, and data governance. A varied list, with titles in both Spanish and English, which combines academic rigour, dissemination and critical vision. If you are looking for a book that will make you grow, surprise a loved one or simply feed your curiosity, here you will find options for all tastes.
The ethics of artificial intelligence by Sara Degli-Esposti
-
What is it about? This specialist in privacy and data analysis offers a clear and rigorous vision of the risks and opportunities of AI applied to areas such as health, safety, public policy or digital communication. Her proposal stands out for integrating legal, socio-technical and fundamental rights perspectives.
-
Who is it for? Readers looking for a solid introduction to the international debate on AI ethics and regulation.
Available for free here: https://ciec.edu.co/wp-content/uploads/2024/12/LA-ETICA-DE-LA-INTELIGENCIA-ARTIFICIAL.pdf
Understand Nate Gentile's technology
-
What is it about? In this book, the popularizer and specialist in hardware and digital culture Nate Gentile debunks myths, explains technical concepts in an accessible way and offers a critical look at how the technology we use every day really works. From processor performance and system architectures to the business models of large platforms, the book combines technical rigor with a relatable style, accompanied by practical examples and anecdotes from the technology community.
-
Who is it for? Curious readers who want to better understand the inner workings of devices, professionals who are looking for an informative but precise approach, and anyone who wants to lose their fear of technology and understand it more consciously.
Clicks Against Humanity by James Williams
-
What is it about? This journalistic work analyzes how digital platforms shape our attention, our beliefs and our decisions. Through true stories, the book shows the impact of algorithmic design on politics, public opinion, and daily life. An incisive and timely read, especially at a time of growing concern about misinformation and the attention economy.
-
Who is it for? Those who want to understand how platforms work and what effects they can have on society.
The Spring of Artificial Intelligence by Carmen Torrijos and José Carlos Sánchez
- What is it about? Based on everyday examples, the authors explain what language models really are, how technologies such as ChatGPT or computer vision work, what transformations they are generating in sectors such as education, creativity or communication, and what their current limits are. In addition, they provide a critical reflection on the ethical, social and labour challenges associated with this new wave of innovation.
- Who is it for? Readers who want to understand the current phenomenon of AI without the need for technical knowledge, teachers and professionals looking to contextualize its impact on their sector, and anyone interested in understanding what is behind the generative AI boom and how it can influence our immediate future.
Design of Machine Learning Systems by Chip Huyen
-
What is it about? It's a modern, practical primer that explains, from start to finish, how to design, deploy, and maintain robust machine learning systems. Chip Huyen combines technical expertise with informative clarity, covering everything from data engineering to model monitoring and MLOps. A highly valued work in the industry.
-
Who is it for? Technical professionals, teams implementing AI-based products, and students who want to understand how real systems are built in production.
Ethics in Artificial Intelligence and Information Technologies by Gabriela Arriagada-Bruneau, Claudia López and Marcelo Mendoza
-
What is it about? This book addresses one of the great challenges of our time: how to develop AI systems that respect people and society. The authors analyze principles of equity, transparency, accountability, and governance, combining philosophical foundations with practical examples. Its Ibero-American approach is particularly valuable in understanding how these challenges affect this region.
-
Who is it for? Students, public officials, technology professionals and anyone who wants to understand the ethical dilemmas behind the algorithms we use every day.
Generative Deep Learning: Teaching Machines to Paint, Write, Compose, and Play de David Foster
-
What is it about? This work, which is already a classic in its field, introduces the most important generative architectures (GANs, VAEs, diffusion models) with examples and reproducible code. The second edition updates concepts and provides new practical cases related to text, sound and image.
-
Who is it for? Those who want to learn how to create generative models from scratch or understand the technologies behind automatic content creation.
Michio Kaku's quantum supremacy
-
What is it about? Quantum computing has ceased to be science fiction and has become a global strategic field. Michio Kaku, a renowned popularizer, explains clearly what a qubit is, how quantum computers work, what limits they present and what transformations they will promote in cryptography, chemical simulation or artificial intelligence.
-
Who is it for? Ideal for science lovers, technologically curious and readers who want to peek into the future of computing without the need for advanced mathematical knowledge.
Data Governance based on UNE specifications by Ismael Caballero, Fernando Gualo and Mario G. Piattini
-
What is it about? This book is a complete guide to understanding and applying UNE standards relating to data governance in organisations. Clearly explain how to structure roles, processes, policies, and controls to manage data as a strategic asset. It includes case studies, maturity models, implementation examples and guidance to align governance with international standards and with the real needs of the public and private sectors. A particularly useful resource at a time when data quality, traceability and interoperability are critical to driving digital transformation.
-
Who is it for? Data Managers (CDOs), analytics and architecture teams, government professionals, consultants, and any organization that wants to implement a formal data governance model based on recognized standards.
While we'd love to include many more titles, this selection is already a great starting point for exploring the big themes that will shape the digital transformation of the coming years. If you feel like giving knowledge as a gift this holiday season, these works will be a sure hit: they combine current affairs, critical reflection, practical applications and a broad look at the technological future.
Remember that, although here we mention titles that you can find in online bookstores, we always encourage you to check your neighborhood bookstore first. It's a great way to support small businesses and help keep the cultural ecosystem alive and vibrant.
Would you recommend another title?
At datos.gob.es we love to discover new readings. If you know of a book on data, AI, technology or digital society that deserves to be in future editions, you can share it in the comments or write to us through this form. Happy holidays and happy reading!
Blog
Data visualization is a fundamental practice to democratize access to public information. However, creating effective graphics goes far beyond choosing attractive colors or using the latest technological tools. As Alberto Cairo, an expert in data visualization and professor at the academy of the European Open Data Portal (data.europa.eu), points out, "every design decision must be deliberate: inevitably subjective, but never arbitrary." Through a series of three webinars that you can watch again here, the expert offered innovative tips to be at the forefront of data visualization.
When working with data visualization, especially in the context of public information, it is crucial to debunk some myths ingrained in our professional culture. Phrases like "data speaks for itself," "a picture is worth a thousand words," or "show, don't count" sound good, but they hide an uncomfortable truth: charts don't always communicate automatically.
The reality is more complex. A design professional may want to communicate something specific, but readers may interpret something completely different. How can you bridge the gap between intent and perception in data visualization? In this post, we offer some keys to the training series.
A structured framework for designing with purpose
Rather than following rigid "rules" or applying predefined templates, the course proposes a framework of thinking based on five interrelated components:
- Content: the nature, origin, and limitations of the data
- People: The audience we are targeting
- Intention: The Purposes We Define
- Constraints: The Constraints We Face
- Results: how the graph is received
This holistic approach forces us to constantly ask ourselves: what do our readers really need to know? For example, when communicating information about hurricane or health emergency risks, is it more important to show exact trajectories or communicate potential impacts? The correct answer depends on the context and, above all, on the information needs of citizens.
The danger of over-aggregation
Even without losing sight of the purpose, it is important not to fall into adding too much information or presenting only averages. Imagine, for example, a dataset on citizen security at the national level: an average may hide the fact that most localities are very safe, while a few with extremely high rates distort the national indicator.
As Claus O. Wilke explains in his book "Fundamentals of Data Visualization," this practice can hide crucial patterns, outliers, and paradoxes that are precisely the most relevant to decision-making. To avoid this risk, the training proposes to visualize a graph as a system of layers that we must carefully build from the base:
1. Encoding
- It's the foundation of everything: how we translate data into visual attributes. Research in visual perception shows us that not all "visual channels" are equally effective. The hierarchy would be:
- Most effective: position, length and height
- Moderately effective: angle, area and slope
- Less effective: color, saturation, and shape
How do we put this into practice? For example, for accurate comparisons, a bar chart will almost always be a better choice than a pie chart. However, as nuanced in the training materials, "effective" does not always mean "appropriate". A pie chart can be perfect when we want to express the idea of a "whole and its parts", even if accurate comparisons are more difficult.
2. Arrangement
- The positioning, ordering, and grouping of elements profoundly affects perception. Do we want the reader to compare between categories within a group, or between groups? The answer will determine whether we organize our visualization with grouped or stacked bars, with multiple panels, or in a single integrated view.
3. Scaffolding
Titles, introductions, annotations, scales and legends are fundamental. In datos.gob.es we've seen how interactive visualizations can condense complex information, but without proper scaffolding, interactivity can confuse rather than clarify.
The value of a correct scale
One of the most delicate – and often most manipulable – technical aspects of a visualization is the choice of scale. A simple modification in the Y-axis can completely change the reader's interpretation: a mild trend may seem like a sudden crisis, or sustained growth may go unnoticed.
As mentioned in the second webinar in the series, scales are not a minor detail: they are a narrative component. Deciding where an axis begins, what intervals are used, or how time periods are represented involves making choices that directly affect one's perception of reality. For example, if an employment graph starts the Y-axis at 90% instead of 0%, the decline may seem dramatic, even if it's actually minimal.
Therefore, scales must be honest with the data. Being "honest" doesn't mean giving up on design decisions, but rather clearly showing what decisions were made and why. If there is a valid reason for starting the Y-axis at a non-zero value, it should be explicitly explained in the graph or in its footnote. Transparency must prevail over drama.
Visual integrity not only protects the reader from misleading interpretations, but also reinforces the credibility of the communicator. In the field of public data, this honesty is not optional: it is an ethical commitment to the truth and to citizen trust.
Accessibility: Visualize for everyone
On the other hand, one of the aspects often forgotten is accessibility. About 8% of men and 0.5% of women have some form of color blindness. Tools like Color Oracle allow you to simulate what our visualizations look like for people with different types of color perception impairments.
In addition, the webinar mentioned the Chartability project, a methodology to evaluate the accessibility of data visualizations. In the Spanish public sector, where web accessibility is a legal requirement, this is not optional: it is a democratic obligation. Under this premise, the Spanish Federation of Municipalities and Provinces published a Data Visualization Guide for Local Entities.
Visual Storytelling: When Data Tells Stories
Once the technical issues have been resolved, we can address the narrative aspect that is increasingly important to communicate correctly. In this sense, the course proposes a simple but powerful method:
- Write a long sentence that summarizes the points you want to communicate.
- Break that phrase down into components, taking advantage of natural pauses.
- Transform those components into sections of your infographic.
This narrative approach is especially effective for projects like the ones we found in data.europa.eu, where visualizations are combined with contextual explanations to communicate the value of high-value datasets or in datos.gob.es's data science and visualization exercises.
The future of data visualization also includes more creative and user-centric approaches. Projects that incorporate personalized elements, that allow readers to place themselves at the center of information, or that use narrative techniques to generate empathy, are redefining what we understand by "data communication".
Alternative forms of "data sensification" are even emerging: physicalization (creating three-dimensional objects with data) and sonification (translating data into sound) open up new possibilities for making information more tangible and accessible. The Spanish company Tangible Data, which we echo in datos.gob.es because it reuses open datasets, is proof of this.

Figure 1. Examples of data sensification. Source: https://data.europa.eu/sites/default/files/course/webinar-data-visualisation-episode-3-slides.pdf
By way of conclusion, we can emphasize that integrity in design is not a luxury: it is an ethical requirement. Every graph we publish on official platforms influences how citizens perceive reality and make decisions. That is why mastering technical tools such as libraries and visualization APIs, which are discussed in other articles on the portal, is so relevant.
The next time you create a visualization with open data, don't just ask yourself "what tool do I use?" or "Which graphic looks best?". Ask yourself: what does my audience really need to know? Does this visualization respect data integrity? Is it accessible to everyone? The answers to these questions are what transform a beautiful graphic into a truly effective communication tool.
Blog
Education has the power to transform lives. Recognized as a fundamental right by the international community, it is a key pillar for human and social development. However, according to UNESCO data, 272 million children and young people still do not have access to school, 70% of countries spend less than 4% of their GDP on education, and 69 million more teachers are still needed to achieve universal primary and secondary education by 2030. In the face of this global challenge, open educational resources and open access initiatives are presented as decisive tools to strengthen education systems, reduce inequalities and move towards inclusive, equitable and quality education.
Open educational resources (OER) offer three main benefits: they harness the potential of digital technologies to solve common educational challenges; they act as catalysts for pedagogical and social innovation by transforming the relationship between teachers, students and knowledge; and they contribute to improving equitable access to high-quality educational materials.
What are Open Educational Resources (OER)
According to UNESCO, open educational resources are "learning, teaching, and research materials in any format and support that exist in the public domain or are under copyright and were released under an open license." The concept, coined at the forum held in Paris in 2002, has as its fundamental characteristic that these resources allow "their access at no cost, their reuse, reorientation, adaptation and redistribution by third parties".
OER encompasses a wide variety of formats, from full courses, textbooks, and curricula to maps, videos, podcasts, multimedia applications, assessment tools, mobile apps, databases, and even simulations.
Open educational resources are made up of three elements that work inseparably:
- Educational content: includes all kinds of material that can be used in the teaching-learning process, from formal objects to external and social resources. This is where open data would come in, which can be used to generate this type of resource.
- Technological tools: software that allows content to be developed, used, modified and distributed, including applications for content creation and platforms for learning communities.
- Open licenses: differentiating element that respects intellectual property while providing permissions for the use, adaptation and redistribution of materials.
Therefore, OER are mainly characterized by their universal accessibility, eliminating economic and geographical barriers that traditionally limit access to quality education.
Educational innovation and pedagogical transformation
Pedagogical transformation is one of the main impacts of open educational resources in the current educational landscape. OER are not simply free digital content, but catalysts for innovation that are redefining teaching-learning processes globally.
Combined with appropriate pedagogical methodologies and well-designed learning objectives, OER offer innovative new teaching options to enable both teachers and students to take a more active role in the educational process and even in the creation of content. They foster essential competencies such as critical thinking, autonomy and the ability to "learn to learn", overcoming traditional models based on memorization.
Educational innovation driven by OER is materialized through open technological tools that facilitate their creation, adaptation and distribution. Programs such as eXeLearning allow you to develop digital educational content in a simple way, while LibreOffice and Inkscape offer free alternatives for the production of materials.
The interoperability achieved through open standards, such as IMS Global or SCORM, ensures that these resources can be integrated into different platforms and therefore accessibility for all users, including people with disabilities.
Another promising innovation for the future of OER is the combination of decentralized technologies like Nostr with authoring tools like LiaScript. This approach solves the dependency on central servers, allowing an entire course to be created and distributed over an open, censorship-resistant network. The result is a single, permanent link (URI de Nostr) that encapsulates all the material, giving the creator full sovereignty over its content and ensuring its durability. In practice, this is a revolution for universal access to knowledge. Educators share their work with the assurance that the link will always be valid, while students access the material directly, without the need for platforms or intermediaries. This technological synergy is a fundamental step to materialize the promise of a truly open, resilient and global educational ecosystem, where knowledge flows without barriers.
The potential of Open Educational Resources is realized thanks to the communities and projects that develop and disseminate them. Institutional initiatives, collaborative repositories and programmes promoted by public bodies and teachers ensure that OER are accessible, reusable and sustainable.
Collaboration and open learning communities
The collaborative dimension represents one of the fundamental pillars that support the open educational resources movement. This approach transcends borders and connects education professionals globally.
The educational communities around OER have created spaces where teachers share experiences, agree on methodological aspects and resolve doubts about the practical application of these resources. Coordination between professionals usually occurs on social networks or through digital channels such as Telegram, in which both users and content creators participate. This "virtual cloister" facilitates the effective implementation of active methodologies in the classroom.
Beyond the spaces that have arisen at the initiative of the teachers themselves, different organizations and institutions have promoted collaborative projects and platforms that facilitate the creation, access and exchange of Open Educational Resources, thus expanding their reach and impact on the educational community.
OER projects and repositories in Spain
In the case of Spain, Open Educational Resources have a consolidated ecosystem of initiatives that reflect the collaboration between public administrations, educational centres, teaching communities and cultural entities. Platforms such as Procomún, content creation projects such as EDIA (Educational, Digital, Innovative and Open) or CREA (Creation of Open Educational Resources), and digital repositories such as Hispana show the diversity of approaches adopted to make educational and cultural resources available to citizens in open access. Here's a little more about them:
- The EDIA (Educational, Digital, Innovative and Open) Project, developed by the National Center for Curriculum Development in Non-Proprietary Systems (CEDEC), focuses on the creation of open educational resources designed to be integrated into environments that promote digital competences and that are adapted to active methodologies. The resources are created with eXeLearning, which facilitates editing, and include templates, guides, rubrics and all the necessary documents to bring the didactic proposal to the classroom.
- The Procomún network was born as a result of the Digital Culture in School Plan launched in 2012 by the Ministry of Education, Culture and Sport. This repository currently has more than 74,000 resources and 300 learning itineraries, along with a multimedia bank of 100,000 digital assets under the Creative Commons license and which, therefore, can be reused to create new materials. It also has a mobile application. Procomún also uses eXeLearning and the LOM-ES standard, which ensures a homogeneous description of the resources and facilitates their search and classification. In addition, it is a semantic web, which means that it can connect with existing communities through the Linked Open Data Cloud.
The autonomous communities have also promoted the creation of open educational resources. An example is CREA, a programme of the Junta de Extremadura aimed at the collaborative production of open educational resources. Its platform allows teachers to create, adapt and share structured teaching materials, integrating curricular content with active methodologies. The resources are generated in interoperable formats and are accompanied by metadata that facilitates their search, reuse and integration into different platforms.
There are similar initiatives, such as the REA-DUA project in Andalusia, which brings together more than 250 educational resources for primary, secondary and baccalaureate, with attention to diversity. For its part, Galicia launched the 2022-23 academic year cREAgal whose portal currently has more than 100 primary and secondary education resources. This project has an impact on inclusion and promotes the personal autonomy of students. In addition, some ministries of education make open educational resources available, as is the case of the Canary Islands.
Hispana, the portal for access to Spanish cultural heritage
In addition to these initiatives aimed at the creation of educational resources, others have emerged that promote the collection of content that was not created for an educational purpose but that can be used in the classroom. This is the case of Hispana, a portal for aggregating digital collections from Spanish libraries, archives and museums.
To provide access to Spanish cultural and scientific heritage, Hispana collects and makes accessible the metadata of digital objects, allowing these objects to be viewed through links to the pages of the owner institutions. In addition to acting as a collector, Hispana also adds the content of institutions that wish to do so to Europeana, the European digital library, which allows increasing the visibility and reuse of resources.
Hispana is an OAI-PMH repository, which means that it uses the Open Archives Initiative – Protocol for Metadata Harvesting, an international standard for the collection and exchange of metadata between digital repositories. Thus, Hispana collects the metadata of the Spanish archives, museums and libraries that exhibit their collections with this protocol and sends them to Europeana.
International initiatives and global cooperation
At the global level, it is important to highlight the role of UNESCO through the Dynamic Coalition on OER, which seeks to coordinate efforts to increase the availability, quality and sustainability of these assets.
In Europe, ENCORE+ (European Network for Catalysing Open Resources in Education) seeks to strengthen the European OER ecosystem. Among its objectives is to create a network that connects universities, companies and public bodies to promote the adoption, reuse and quality of OER in Europe. ENCORE+ also promotes interoperability between platforms, metadata standardization and cooperation to ensure the quality of resources.
In Europe, other interesting initiatives have been developed, such as EPALE (Electronic Platform for Adult Learning in Europe), an initiative of the European Commission aimed at specialists in adult education. The platform contains studies, reports and training materials, many of them under open licenses, which contributes to the dissemination and use of OER.
In addition, there are numerous projects that generate and make available open educational resources around the world. In the United States, OER Commons functions as a global repository of educational materials of different levels and subjects. This project uses Open Author, an online editor that makes it easy for teachers without advanced technical knowledge to create and customize digital educational resources directly on the platform.
Another outstanding project is Plan Ceibal, a public program in Uruguay that represents a model of technological inclusion for equal opportunities. In addition to providing access to technology, it generates and distributes OER in interoperable formats, compatible with standards such as SCORM and structured metadata that facilitate its search, integration into learning platforms and reuse by teachers.
Along with initiatives such as these, there are others that, although they do not directly produce open educational resources, do encourage their creation and use through collaboration between teachers and students from different countries. This is the case for projects such as eTwinning and Global Classroom.
The strength of OER lies in their contribution to the democratization of knowledge, their collaborative nature, and their ability to promote innovative methodologies. By breaking down geographical, economic, and social barriers, open educational resources bring the right to education one step closer to becoming a universal reality.
Blog
Between ice cream and longer days, summer is here. At this time of year, open information can become our best ally to plan getaways, know schedules of the bathing areas in our community or even know the state of traffic on roads that take us to our next destination.
Whether you're on the move or at home resting, you can find a wide variety of datasets and apps on the datos.gob.es portal that can transform the way you live and enjoy the summer. In addition, if you want to take advantage of the summer season to train, we also have resources for you.
Training, rest or adventure, in this post, we offer you some of the resources that can be useful this summer.
An opportunity to learn: courses and cultural applications
Are you thinking of making a change in your professional career? Or would you like to improve in a discipline? Data science is one of the most in-demand skills for companies and artificial intelligence offers new opportunities every day to apply it in our day-to-day lives.
To understand both disciplines well and be up to date with their development, you can take advantage of the summer to train in programming, data visualization or even generative AI. In this post, which we published at the beginning of summer, you have a list of proposals, you are still in time to sign up for some!
If you already have some knowledge, we advise you to review our step-by-step exercises. In each of them you will find the code reproducible and fully documented, so you can replicate it at your own pace. In this infographic we show you several examples, divided by themes and level of difficulty. A practical way to test your technical skills and learn about innovative tools and technologies.
If instead of data science, you want to take advantage of it to gain more cultural knowledge, we also have options for you. First of all, we recommend this dataset on the cultural agenda of events in the Basque Country to discover festivals, concerts and other cultural activities. Another interesting dataset is that of tourist information offices in Tenerife where they will inform you how to plan cultural itineraries. And this application will accompany you on a tour of Castilla y León through a gamified map to identify tourist places of interest.
Plan your perfect getaway: datasets for tourism and vacations
Some of the open datasets you can find on datos.gob.es are the basis for creating applications that can be very useful for travel. We are talking, for example, about the dataset of campsites in Navarre that provides updated data on active tourism camps, including information on services, location and capacity. In this same autonomous community, this dataset on restaurants and cafeterias may be useful to you.
On the other hand, this dataset on the supply of tourist accommodation in Aragon presents a complete catalogue of hotels, inns and hostels classified by category, allowing travellers to make informed decisions according to their budget and preferences.
Another interesting resource is this dataset published by the National Institute of Statistics, which you can also find federated in datos.gob.es on trips, overnight stays, average duration and expenditure per trip. Thanks to this dataset, you can get an idea of how people travel and take it as a reference to plan your trip.
Enjoy the Water: Open Datasets for Water Activities
Access to information about beaches and bathing areas is essential for a safe and pleasant summer. The Bizkaia beach dataset provides detailed information on the characteristics of each beach, including available services, accessibility and water conditions. Similarly, this dataset of bathing areas in the Community of Madrid provides data on safe and controlled aquatic spaces in the region.
If you want a more general view, this application developed by the Ministry for Ecological Transition and Demographic Challenge (MITECO) with open data offers a national visualization of beaches at the national level. More recently, RTVE's data team has developed this Great Map of Spain's beaches that includes more than 3,500 destinations with specific information.
For lovers of water sports and sailing, tide prediction datasets for both Galicia and the Basque Country offer crucial information for planning activities at sea. This data allows boaters, surfers and fishermen to optimize their activities according to ocean conditions.
Smart mobility: datasets for hassle-free travel
It is not news that mobility during these months is even greater than in the rest of the year. Datasets on traffic conditions in Barcelona and the roads in Navarra provide real-time information that helps travellers avoid congestion and plan efficient routes. This information is especially valuable during periods of increased summer mobility, when roads experience a significant increase in traffic.
The applications that provide information on the price of fuel at the different Spanish petrol stations are among the most consulted on our portal throughout the year, but in summer their popularity skyrockets even more. They are interesting because they allow you to locate the service stations with the most competitive prices, optimizing the travel budget. This information can also be found in regularly updated datasets and is especially useful for long trips and route planning.
The future of open data in tourism
The convergence of open data, mobile technology and artificial intelligence is creating new opportunities to personalize and enhance the tourism experience. The datasets and resources available in datos.gob.es not only provide current information, but also serve as a basis for the development of innovative solutions that can anticipate needs, optimize resources, and create more satisfying experiences for travelers.
From route planning to selecting accommodations or finding cultural activities, these datasets and apps empower citizens and are a useful resource to maximize the enjoyment of this time of year. This summer, before you pack your bags, it's worth exploring the possibilities offered by open data.
Noticia
The open data sector is very active. To keep up to date with everything that happens, from datos.gob.es we publish a compilation of news such as the development of new technological applications, legislative advances or other related news.
Six months ago, we already made the last compilation of the year 2024. On this occasion, we are going to summarize some innovations, improvements and achievements of the first half of 2025.
Regulatory framework: new regulations that transform the landscape
One of the most significant developments is the publication of the Regulation on the European Health Data Space by the European Parliament and the Council. This regulation establishes a common framework for the secure exchange of health data between member states, facilitating both medical research and the provision of cross-border health services. In addition, this milestone represents a paradigmatic shift in the management of sensitive data, demonstrating that it is possible to reconcile privacy and data protection with the need to share information for the common good. The implications for the Spanish healthcare system are considerable, as it will allow greater interoperability with other European countries and facilitate the development of collaborative research projects.
On the other hand, the entry into force of the European AI Act establishes clear rules for the development of this technology, guaranteeing security, transparency and respect for human rights. These types of regulations are especially relevant in the context of open data, where algorithmic transparency and the explainability of AI models become essential requirements.
In Spain, the commitment to transparency is materialised in initiatives such as the new Digital Rights Observatory, which has the participation of more than 150 entities and 360 experts. This platform is configured as a space for dialogue and monitoring of digital policies, helping to ensure that the digital transformation respects fundamental rights.
Technological innovations in Spain and abroad
One of the most prominent milestones in the technological field is the launch of ALIA, the public infrastructure for artificial intelligence resources. This initiative seeks to develop open and transparent language models that promote the use of Spanish and Spanish co-official languages in the field of AI.
ALIA is not only a response to the hegemony of Anglo-Saxon models, but also a strategic commitment to technological sovereignty and linguistic diversity. The first models already available have been trained in Spanish, Catalan, Galician, Valencian and Basque, setting an important precedent in the development of inclusive and culturally sensitive technologies.
In relation to this innovation, the practical applications of artificial intelligence are multiplying in various sectors. For example, in the financial field, the Tax Agency has adopted an ethical commitment in the design and use of artificial intelligence. Within this framework, the community has even developed a virtual chatbot trained with its own data that offers legal guidance on fiscal and tax issues.
In the healthcare sector, a group of Spanish radiologists is working on a project for the early detection of oncological lesions using AI, demonstrating how the combination of open data and advanced algorithms can have a direct impact on public health.
Also combining AI with open data, projects related to environmental sustainability have been developed. This model developed in Spain combines AI and open weather data to predict solar energy production over the next 30 years, providing crucial information for national energy planning.
Another relevant sector in terms of technological innovation is that of smart cities. In recent months, Las Palmas de Gran Canaria has digitized its municipal markets by combining WiFi networks, IoT devices, a digital twin and open data platforms. This comprehensive initiative seeks to improve the user experience and optimize commercial management, demonstrating how technological convergence can transform traditional urban spaces.
Zaragoza, for its part, has developed a vulnerability map using artificial intelligence applied to open data, providing a valuable tool for urban planning and social policies.
Another relevant case is the project of the Open Data Barcelona Initiative, #iCuida, which stands out as an innovative example of reusing open data to improve the lives of caregivers and domestic workers. This application demonstrates how open data can target specific groups and generate direct social impact.
Last but not least, at a global level, this semester DeepSeek has launched DeepSeek-R1, a new family of generative models specialized in reasoning, publishing both the models and their complete training methodology in open source, contributing to the democratic advancement of AI.
New open data portals and improvement tools
In all this maelstrom of innovation and technology, the landscape of open data portals has been enriched with new sectoral initiatives. The Association of Commercial and Property Registrars of Spain has presented its open data platform, allowing immediate access to registry data without waiting for periodic reports. This initiative represents a significant change in the transparency of the registry sector.
In the field of health, the 'I+Health' portal of the Andalusian public health system collects and disseminates resources and data on research activities and results from a single site, facilitating access to relevant scientific information.
In addition to the availability of data, there is a treatment that makes them more accessible to the general public: data visualization. The University of Granada has developed 'UGR in figures', an open-access space with an open data section that facilitates the exploration of official statistics and stands as a fundamental piece in university transparency.
On the other hand, IDENA, the new tool of the Navarre Geoportal, incorporates advanced functionalities to search, navigate, incorporate maps, share data and download geographical information, being operational on any device.
Training for the future: events and conferences
The training ecosystem in this ecosystem is strengthened every year with events such as the Data Management Summit in Tenerife, which addresses interoperability in public administrations and artificial intelligence. Another benchmark event in open data that was also held in the Canary Islands was the National Open Data Meeting.
Beyond these events, collaborative innovation has also been promoted through specialized hackathons, such as the one dedicated to generative AI solutions for biodiversity or the Merkle Datathon in Gijón. These events not only generate innovative solutions, but also create communities of practice and foster emerging talent.
Once again, the open data competitions of Castilla y León and the Basque Country have awarded projects that demonstrate the transformative potential of the reuse of open data, inspiring new initiatives and applications.
International perspective and global trends: the fourth wave of open data
The Open Data Policy Lab spoke at the EU Open Data Days about what is known as the "fourth wave" of open data, closely linked to generative AI. This evolution represents a quantum leap in the way public data is processed, analyzed, and used, where natural language models allow for more intuitive interactions and more sophisticated analysis.
Overall, the open data landscape in 2025 reveals a profound transformation of the ecosystem, where the convergence between artificial intelligence, advanced regulatory frameworks, and specialized applications is redefining the possibilities of transparency and public innovation.
Blog
The Work Trends 2024 Index on the State of Artificial Intelligence in the Workplace and reports from T-Systems and InfoJobs indicate that 78% of workers in Spain use their own AI tools in the workplace. This figure rises to 80% in medium-sized companies. In addition, 1 in 3 workers (32%) use AI tools in their day-to-day work. 75% of knowledge workers use generative AI tools, and almost half have started doing so in the last six months. Interestingly, the generation gap is narrowing in this area. While 85% of Generation Z employees (18-28 years old) use personalised AI, it turns out that more than 70% of baby boomers (58+) also use these tools. In fact, this trend seems to be confirmed by different approaches.
| Títle of the study | Source |
|---|---|
| 2024 Work Trend Index: AI at work is here. Now comes the hard part | Microsoft, LinkedIn |
| 2024 AI Adoption and Risk Report | Cyberhaven Labs |
| Generative AI''s fast and furious entry into Switzerland | Deloitte Switzerland |
| Bring Your Own AI: Balance Rewards and Risks (Webinar) | MITSloan |
| Lin, L. and Parker, K. (2025) U.S. workers are more worried than hopeful about future AI use in the Workplace | Pew Research Center |
Figure 1. References on BYOAI
This phenomenon has been called BYOAI (Bring Your Own AI ), for short. It is characterised by the fact that the person employed usually uses some kind of open source solution such as ChatGPT. The organisation has not contracted the service, the registration has been made privately by the user and the provider obviously assumes no legal responsibility. If, for example, the possibilities offered by Notebook, Perplexity or DeepSeek are used, it is perfectly possible to upload confidential or protected documents.
On the other hand, this coincides, according to data from EuroStat, with the adoption of AI in the corporate sector. By 2024, 13.5% of European companies (with 10 or more employees) were using some form of AI technology, a figure that rises to 41% in large companies and is particularly high in sectors such as information and communication (48.7%), professional, scientific and technical services (30.5%). The trend towards AI adoption in the public sector is also growing due not only to global trends, but probably to the adoption of AI strategies and the positive impact of Next Generation funds.
The legal duty of AI literacy
In this context, questions immediately arise. The first concern the phenomenon of unauthorised use by employed persons: Has the data protection officer or the security officer issued a report to the management of the organisation? Has this type of use been authorised? Was the matter discussed at a meeting of the Security Committee? Has an information circular been issued defining precisely the applicable rules? But alongside these emerge others of a more general nature: What level of education do people have? Are they able to issue reports or make decisions using such tools?
The EU Regulation on Artificial Intelligence (RIA) has rightly established a duty of AI literacy imposed on the providers and deployers of such systems. They are responsible for taking measures to ensure that, to the greatest extent possible, their staff and others who are responsible for the operation and use of AI systems on their behalf have a sufficient level of AI literacy. This requires taking into account their expertise, experience, education and training. Training should be integrated into the intended context of use of the AI systems and be tailored to the profile of the individuals or groups in which the systems will be used.
Unlike in the General Data Protection Regulation, here the obligation is formulated in an express and imperative manner.. There is no direct reference to this matter in the GDPR, except in defining as a function of the data protection officer the training of staff involved in processing operations. This need can also be deduced from the obligation of the processor to ensure that persons authorised to process personal data are aware of their duty of confidentiality. It is obvious that the duty of proactive accountability, data protection by design and by default and risk management lead to the training of users of information systems. However, the fact is that the way in which this training is deployed is not always appropriate. In many organisations it is either non-existent, voluntary or based on the signing of a set of security obligations when taking up a job.
In the field of artificial intelligence-based information systems, the obligation to train is non-negotiable and imperative. The RIA provides for very high fines specified in the Bill for the good use and governance of Artificial Intelligence. When the future law is passed, it will be a serious breach of Article 26.2 of the RIA, concerning the need to entrust the human supervision of the system to persons with adequate competence, training and authority.
Benefits of AI training
Beyond legal coercion, training people is a wise and undoubtedly beneficial decision that should be read positively and conceived as an investment. On the one hand, it helps to adopt measures aimed at managing risk which in the case of the BYOAI includes data leakage, loss of intellectual property, compliance issues and cybersecurity. On the other hand, it is necessary to manage risks associated with regular use of AI. In this regard, it is essential that end-users have a very detailed understanding of the ways in which the technology works, its human oversight role in the decision-making process, and that they acquire the ability to identify and report any operational issues.
However, training must pursue high-level objectives. It should be continuous, combining theory, practice and updating permanent and include technical, ethical, legal and social impact aspects to promote a culture of knowledge and responsible use of AI in the organisation. Its benefits for the dynamics of public or private activity are wide-ranging.
With regard to its benefits, artificial intelligence (AI) literacy has become a strategic factor in transforming decision-making and promoting innovation in organisations:.
- By equipping teams with a solid understanding of how AI works and its applications, it facilitates the interpretation of complex data and the use of advanced tools, enabling identification of patterns and anticipation of business-relevant trends .
- This specialised knowledge contributes to minimising errors and biases, as it promotes decisions based on rigorous analysis rather than intuition, and enables the detection of possible deviations in automated systems. In addition, the automation of routine tasks reduces the likelihood of human failure and frees up resources that can be focused on strategic and creative activities.
- The integration of AI into the organisational culture drives a mentality oriented towards critical analysis and the questioning of technological recommendations, thus promoting an evidence-based culture. This approach not only strengthens the ability to adapt to technological advances, but also facilitates the detection of opportunities to optimise processes, develop new products and improve operational efficiency.
- In the legal and ethical sphere, AI literacy helps to manage compliance and reputational risksby fostering transparent and auditable practices that build trust with both society and regulators.
- Finally, understanding the impact and possibilities of AI diminishes resistance to change and favours the adoption of new technologies, accelerating digital transformation and positioning the organisation as a leader in innovation and adaptation to the challenges of today''s environment.
Good practices for successful AI training
Organisations need to reflect on their training strategy in order to achieve these objectives. In this regard, it seems reasonable to share some lessons learned in the field of data protection. Firstly, it is necessary to point out that all training must start by engaging the organisation''s management team. Reverential fear of the Governing Board, the Local Corporation or the Government of the day should not exist. The political level of any organisation should lead by example if it really wants to permeate all human resources. And this training must be very specific not only from a risk management point of view but also from an opportunity approach based on a culture of responsible innovation.
Similarly, although it may involve additional costs, it is necessary to consider not only the users of AI-based information systems but all staff. This will not only allow us to avoid the risks associated with BYOAI but also to establish a corporate culture that facilitates AI implementation processes.
Finally, it will be essential to adapt training to specific profiles: both users of AI-based systems, technical (IT) staff and ethical and legal mediators and enablers, as well as compliance officers or those responsible for the procurement or tendering of products and services.
Without prejudice to the contents that this type of training should logically include, there are certain values that should inspire training plans. First of all, it is important to remember that this training is compulsory and functionally adapted to the job. Secondly, it must be able to empower people and engage them in the use of AI. The EU''s legal approach is based on the principle of human responsibility and oversight: the human always decides. It must therefore be able to make decisions appropriate to the output provided by the AI, to disagree with the machine''s judgement in an ecosystem that protects it and allows it to report incidents and review them.
Finally, there is one element that cannot be ignored under any circumstances: regardless of whether personal data are processed or not, and regardless of whether AI is intended for humans, its results will always have a direct or indirect impact on individuals or on society. Therefore, the training approach must integrate the ethical, legal and social implications of AI and engage users in guaranteeing fundamental rights and democracy.

Figure 2. Benefits of artificial intelligence literacy. Source: own elaboration
Good practices for successful AI training
Organisations need to reflect on their training strategy in order to achieve these objectives. In this regard, it seems reasonable to share some lessons learned in the field of data protection. Firstly, it is necessary to point out that all training must start by engaging the organisation''s management team. Reverential fear of the Governing Board, the Local Corporation or the Government of the day should not exist. The political level of any organisation should lead by example if it really wants to permeate all human resources. And this training must be very specific not only from a risk management point of view but also from an opportunity approach based on a culture of responsible innovation.
Similarly, although it may involve additional costs, it is necessary to consider not only the users of AI-based information systems but all staff. This will not only allow us to avoid the risks associated with BYOAI but also to establish a corporate culture that facilitates AI implementation processes.
Finally, it will be essential to adapt training to specific profiles: both users of AI-based systems, technical (IT) staff and ethical and legal mediators and enablers, as well as compliance officers or those responsible for the procurement or tendering of products and services.
Without prejudice to the contents that this type of training should logically include, there are certain values that should inspire training plans. First of all, it is important to remember that this training is compulsory and functionally adapted to the job. Secondly, it must be able to empower people and engage them in the use of AI. The EU''s legal approach is based on the principle of human responsibility and oversight: the human always decides. It must therefore be able to make decisions appropriate to the output provided by the AI, to disagree with the machine''s judgement in an ecosystem that protects it and allows it to report incidents and review them.
Finally, there is one element that cannot be ignored under any circumstances: regardless of whether personal data are processed or not, and regardless of whether AI is intended for humans, its results will always have a direct or indirect impact on individuals or on society. Therefore, the training approach must integrate the ethical, legal and social implications of AI and engage users in guaranteeing fundamental rights and democracy.
Ricard Martínez Martínez, Director of the Microsoft-Universitat de Valencia Chair in Privacy and Digital Transformation
Noticia
There is no doubt that artificial intelligence has become a fundamental pillar of technological innovation. Today, artificial intelligence (AI) can create chatbots specialised in open data, applications that facilitate professional work and even a digital Earth model to anticipate natural disasters.
The possibilities are endless, however, the future of AI also has challenges to overcome to make models more inclusive, accessible and transparent. In this respect, the European Union is developing various initiatives to make progress in this field.
European regulatory framework for a more open and transparent AI.
The EU's approach to AI seeks to give citizens the confidence to adopt these technologies and to encourage businesses to develop them. To this end, the European AI Regulation sets out guidelines for the development of artificial intelligence in line with European values of privacy, security and cultural diversity. On the other hand, the Data Governance Regulation (DGA) defines that broad access to data must be guaranteed without compromising intellectual property rights, privacy and fairness.
Together with the Artificial Intelligence Act, the update of the Coordinated Plan on AI ensures the security and fundamental rights of individuals and businesses, while strengthening investment and innovation in all EU countries. The Commission has also launched an Artificial Intelligence Innovation Package to help European start-ups and SMEs develop reliable AI that respects EU values and standards.
Other institutions are also working on boosting intelligence by pushing open source AI models as a very interesting solution. A recent report by Open Future and Open Source Initiative (OSI) defines what data governance should look like in open source AI models. One of the challenges highlighted in the report is precisely to strike a balance between open data and data rights, to achieve more transparency and to avoid cultural bias. In fact, experts in the field Ricard Martínez and Carmen Torrijos debated this issue in the pódcast of datos.gob.es.
The OpenEuroLLM project
With the aim of solving potential challenges and as an innovative and open solution, the European Union, through the Digital Europe programme has presented through this open source artificial intelligence project it is expected to create efficient, transparent language models aligned with European AI regulations.
The OpenEuroLLM project has as its main goal the development of state-of-the-art language models for a wide variety of public and private applications. Among the most important objectives, we can mention the following:
- Extend the multilingual capabilities of existing models: this includes not only the official languages of the European Union, but also other languages that are of social and economic interest. Europe is a continent rich in linguistic diversity, and the project seeks to reflect this diversity in AI models.
- Sustainable access to fundamental models: lthe models developed within the project will be easy to access and ready to be adjusted to various applications. This will not only benefit large enterprises, but also small and medium-sized enterprises (SMEs) that wish to integrate AI into their processes without facing technological barriers.
- Evaluation of results and alignment with European regulations: models will be evaluated according to rigorous safety standards and alignment with the European AI Regulation and other European regulatory frameworks. This will ensure that AI solutions are safe and respect fundamental rights.
- Transparency and accessibility: One of the premises of the project is to openly share the tools, processes and intermediate results of the training processes. This will allow other researchers and developers to reproduce, improve and adapt the models for their own purposes.
- Community building: OpenEuroLLM is not limited to modelling but also aims to build an active and engaged community, both in the public and private sector, that can collaborate, share knowledge and work together to advance AI research.
The OpenEuroLLM Consortium: a collaborative and multinational project
The OpenEuroLLM project is being developed by a consortium of 20 European research institutions , technology companies and supercomputing centres, under the coordination of Charles University (Czech Republic) and the collaboration of Silo GenAI (Finland). The consortium brings together some of the leading institutions and companies in the field of artificial intelligence in Europe, creating a multinational collaboration to develop open source language models.
The main institutions participating in the project include renowned universities such as University of Helsinki (Finland) and University of Oslo (Norway), as well as technology companies such as Aleph Alpha Research (Germany) or the company from Elche prompsit (Spain), among others. In addition, supercomputing centres such as the Barcelona Supercomputing Center (Spain) or SURF (The Netherlands) provide the infrastructure needed to train large-scale models.
Linguistic diversity, transparency and compliance with EU standards
One of the biggest challenges of globalised artificial intelligence is the inclusion of multiple languages and the preservation of cultural differences. Europe, with its vast linguistic diversity, presents a unique environment in which to address these issues. OpenEuroLLM is committed to preserving this diversity and ensuring that the AI models developed are sensitive to the linguistic and cultural variations of the region.
As we saw at the beginning of this post, technological development must go hand in hand with ethical and responsible values. In this respect, one of the key features of the OpenEuroLLM project is its focus on transparency. Models, data, documentation, training code and evaluation metrics will be fully available to the public. This will allow researchers and developers to audit, modify and improve the models, ensuring an open and collaborative approach.
In addition, the project is aligned with strict European AI regulations. OpenEuroLLM is designed to comply with the EU's AI Law , which sets stringent criteria to ensure safety, fairness and privacy in artificial intelligence systems.
Democratising access to AI
One of the most important achievements of OpenEuroLLLM is the democratisation of access to high-performance AI. Open source models will enable businesses, academic institutions and public sector organisations across Europe to have access to cutting-edge technology, regardless of their size or budget.
This is especially relevant for small and medium-sized enterprises (SMEs), which often face difficulties in accessing AI solutions due to high licensing costs or technological barriers. OpenEuroLLM will remove these barriers and enable companies to develop innovative products and services using AI, which will contribute to Europe's economic growth.
The OpenEuroLLM project is also an EU commitment to digital sovereignty that is strategically investing in the development of technological infrastructure that reduces dependence on global players and strengthens European competitiveness in the field of artificial intelligence. This is an important step towards artificial intelligence that is not only more advanced, but also fairer, safer and more responsible.