Documentación
The following presents a new guide to Exploratory Data Analysis (EDA) implemented in Python, which evolves and complements the version published in R in 2021. This update responds to the needs of an increasingly diverse community in the field of data science.
Exploratory Data Analysis (EDA) represents a critical step prior to any statistical analysis, as it allows:
- Comprehensive understanding of the data before analyzing it.
- Verification of statistical requirements that will ensure the validity of subsequent analyses.
To exemplify its importance, let's take the case of detecting and treating outliers, one of the tasks to be performed in an EDA. This phase has a significant impact on fundamental statistics such as the mean, standard deviation, or coefficient of variation.
This guide maintains as a practical case the analysis of air quality data from Castilla y León, demonstrating how to transform public data into valuable information through the use of fundamental Python libraries such as pandas, matplotlib, and seaborn, along with modern automated analysis tools like ydata-profiling.
In addition to explaining the different phases of an EDA, the guide illustrates them with a practical case. In this sense, the analysis of air quality data from Castilla y León is maintained as a practical case. Through explanations that users can replicate, public data is transformed into valuable information using fundamental Python libraries such as pandas, matplotlib, and seaborn, along with modern automated analysis tools like ydata-profiling.
Why a new guide in Python?
The choice of Python as the language for this new guide reflects its growing relevance in the data science ecosystem. Its intuitive syntax and extensive catalog of specialized libraries have made it a fundamental tool for data analysis. By maintaining the same dataset and analytical structure as the R version, understanding the differences between both languages is facilitated. This is especially valuable in environments where multiple technologies coexist. This approach is particularly relevant in the current context, where numerous organizations are migrating their analyses from traditional languages/tools like R, SAS, or SPSS to Python. The guide seeks to facilitate these transitions and ensure continuity in the quality of analyses during the migration process.
New features and improvements
The content has been enriched with the introduction to automated EDA and data profiling tools, thus responding to one of the latest trends in the field. The document delves into essential aspects such as environmental data interpretation, offers a more rigorous treatment of outliers, and presents a more detailed analysis of correlations between variables. Additionally, it incorporates good practices in code writing.
The practical application of these concepts is illustrated through the analysis of air quality data, where each technique makes sense in a real context. For example, when analyzing correlations between pollutants, it not only shows how to calculate them but also explains how these patterns reflect real atmospheric processes and what implications they have for air quality management.
Structure and contents
The guide follows a practical and systematic approach, covering the five fundamental stages of EDA:
- Descriptive analysis to obtain a representative view of the data.
- Variable type adjustment to ensure consistency.
- Detection and treatment of missing data.
- Identification and management of outliers.
- Correlation analysis between variables.

Figure 1. Phases of exploratory data analysis. Source: own elaboration.
As a novelty in the structure, a section on automated exploratory analysis is included, presenting modern tools that facilitate the systematic exploration of large datasets.
Who is it for?
This guide is designed for open data users who wish to conduct exploratory analyses and reuse the valuable sources of public information found in this and other data portals worldwide. While basic knowledge of the language is recommended, the guide includes resources and references to improve Python skills, as well as detailed practical examples that facilitate self-directed learning.
The complete material, including both documentation and source code, is available in the portal's GitHub repository. The implementation has been done using open-source tools such as Jupyter Notebook in Google Colab, which allows reproducing the examples and adapting the code according to the specific needs of each project.
The community is invited to explore this new guide, experiment with the provided examples, and take advantage of these resources to develop their own open data analyses.
Click to see the full infographic, in accessible version
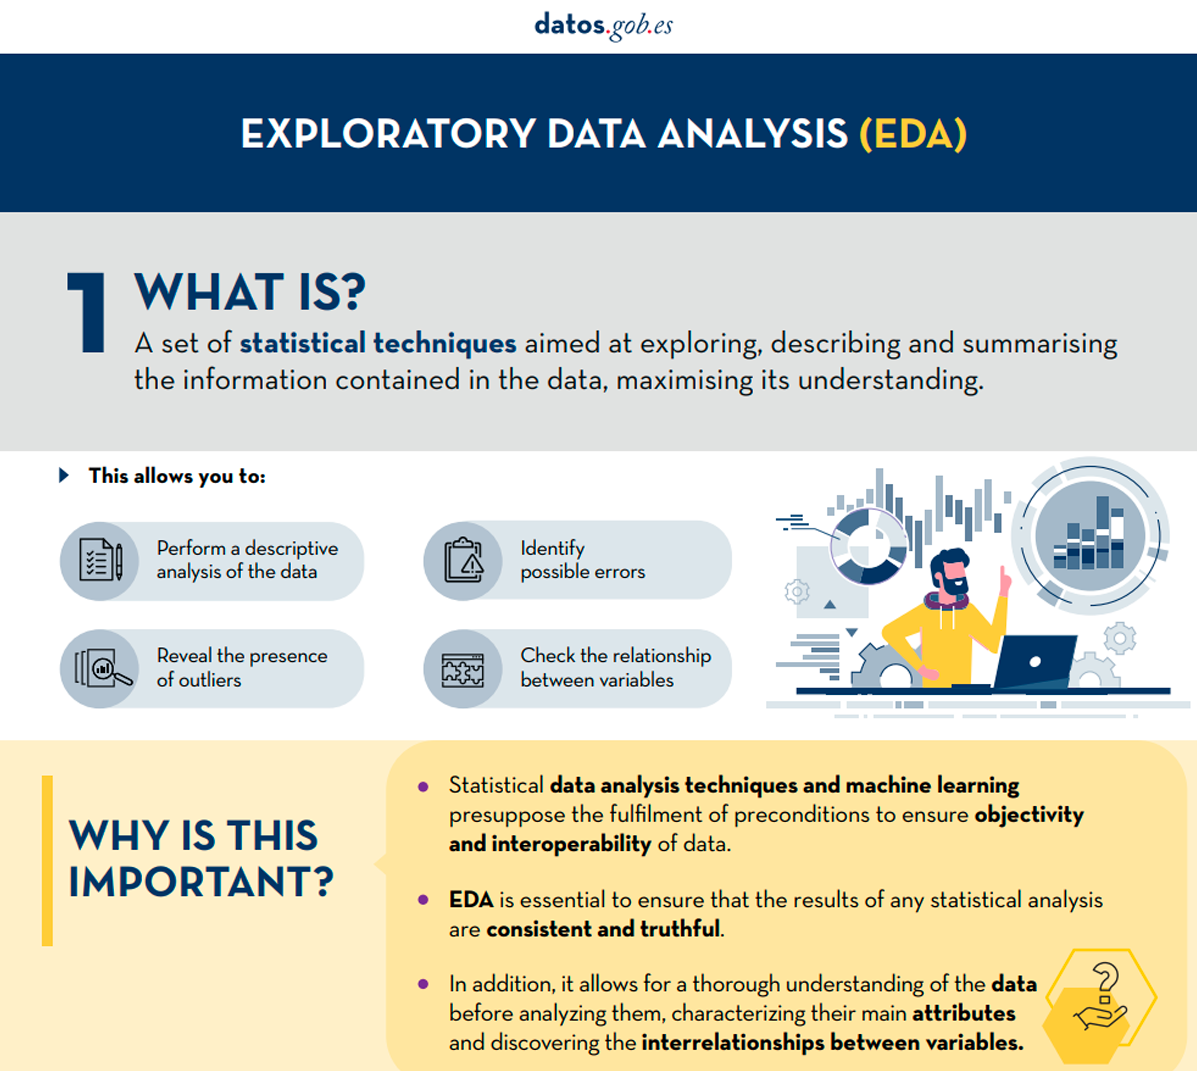
Figure 2. Capture of the infographic. Source: own elaboration.
Documentación
Public sector bodies must make their data available for re-use, making it accessible in the form of open data, as referred to in Spain's legislative framework. The first step for this is that each entity, at local, regional and state level, as well as bodies, entities and trading companies belonging to the institutional public sector, establishes a unit responsible for ensuring that their information is made available. This unit will be in charge of promoting that the information is updated and provided in the appropriate open formats. It should also coordinate information re-use activities, as well as promotion, awareness raising and training on open data, among other functions.
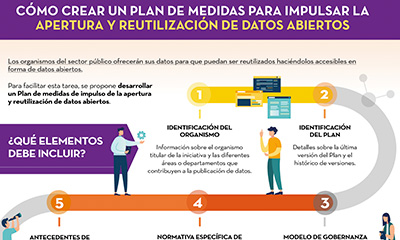
Once it has been determined who is responsible for ensuring open data, it is time to put in place a plan of measures to promote openness and reuse of open data, so that all the actions to be developed are carried out in an orderly, coordinated manner and subject to a viable agenda for openness.
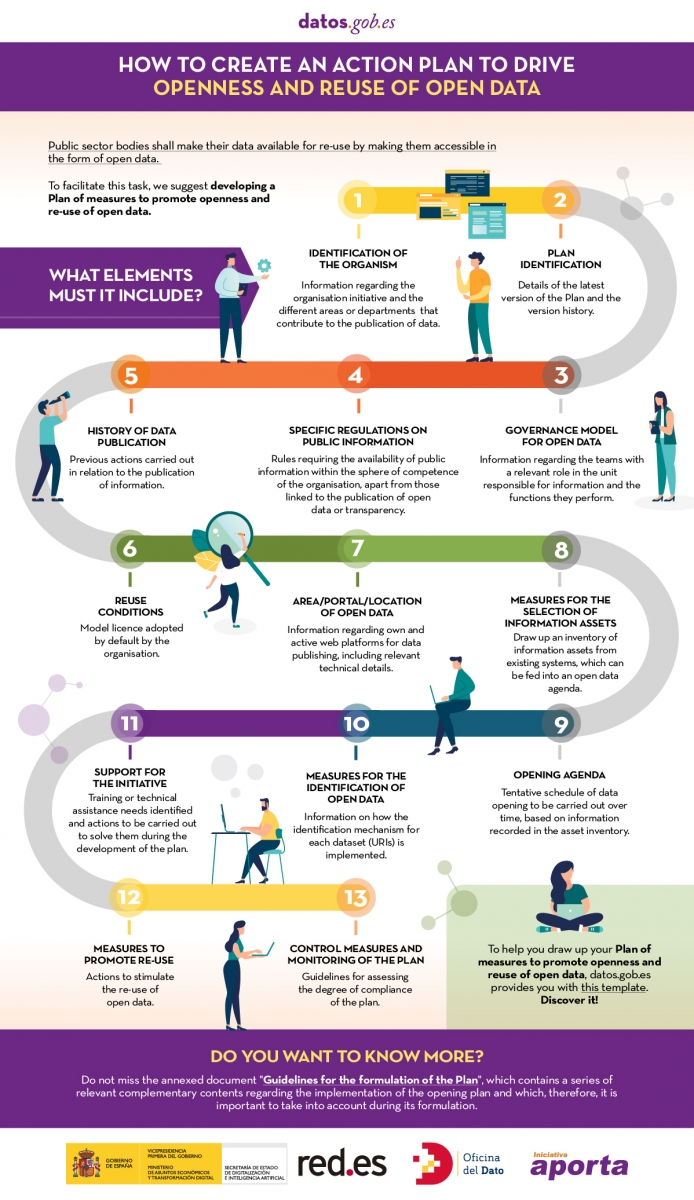
In order to help the responsible units in this task, datos.gob.es has prepared a template for the formulation of the Plan. The aim is to provide guidance on the different elements that such a plan should contain in order to draw up a feasible roadmap for data openness, as well as to enable its monitoring and evaluation.
The following infographic lists the categories included in the template, together with a brief definition (Click on the image to access the infographic).
When drawing up the plan, it is important that each of these categories is completed in as much detail as possible. You can download the template document below, which details all of these elements.
A document has also been prepared with guidelines on important issues for the development of the open data initiative that should be taken into account when defining the plan of measures to promote openness and reuse of open data. This includes guidance on:
- Data governance
- The regulatory framework for open data
- The most common conditions for re-use
- High value data
- Metadata to consider
- Measurement indicators for the evaluation and monitoring of an open data initiative.
Click on the button below each document to download it.
Documentación
Before performing data analysis, for statistical or predictive purposes, for example through machine learning techniques, it is necessary to understand the raw material with which we are going to work. It is necessary to understand and evaluate the quality of the data in order to, among other aspects, detect and treat atypical or incorrect data, avoiding possible errors that could have an impact on the results of the analysis.
One way to carry out this pre-processing is through exploratory data analysis (EDA).
What is exploratory data analysis?
EDA consists of applying a set of statistical techniques aimed at exploring, describing and summarising the nature of the data, in such a way that we can guarantee its objectivity and interoperability.
This allows us to identify possible errors, reveal the presence of outliers, check the relationship between variables (correlations) and their possible redundancy, and perform a descriptive analysis of the data by means of graphical representations and summaries of the most significant aspects.
On many occasions, this exploration of the data is neglected and is not carried out correctly. For this reason, at datos.gob.es we have prepared an introductory guide that includes a series of minimum tasks to carry out a correct exploratory data analysis, a prior and necessary step before carrying out any type of statistical or predictive analysis linked to machine learning techniques.
What does the guide include?
The guide explains in a simple way the steps to be taken to ensure consistent and accurate data. It is based on the exploratory data analysis described in the freely available book R for Data Science by Wickman and Grolemund (2017). These steps are:
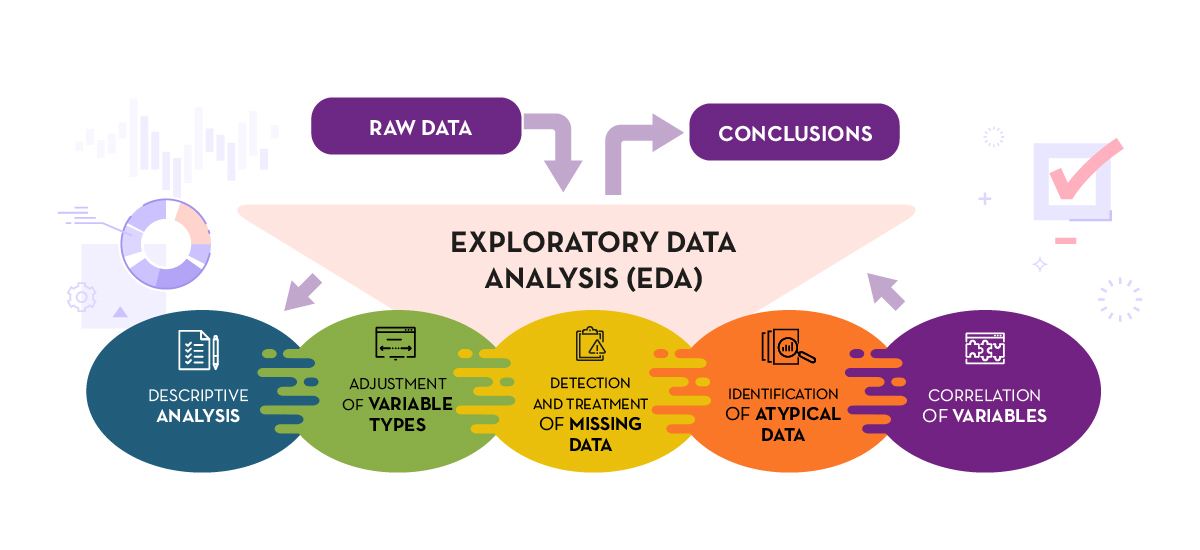
Figure 1. Phases of exploratory data analysis. Source: own elaboration.
The guide explains each of these steps and why they are necessary. They are also illustrated in a practical way through an example. For this case study, we have used the dataset relating to the air quality register in the Autonomous Community of Castilla y León included in our open data catalogue. The processing has been carried out with Open Source and free technological tools. The guide includes the code so that users can replicate it in a self-taught way following the indicated steps.
The guide ends with a section of additional resources for those who want to further explore the subject.
Who is the target audience?
The target audience of the guide is users who reuse open data. In other words, developers, entrepreneurs or even data journalists who want to extract as much value as possible from the information they work with in order to obtain reliable results.
It is advisable that the user has a basic knowledge of the R programming language, chosen to illustrate the examples. However, the bibliography section includes resources for acquiring greater skills in this field.
Below, in the documentation section, you can download the guide, as well as an infographic-summary that illustrates the main steps of exploratory data analysis. The source code of the practical example is also available in our Github.
Click to see the full infographic, in accessible version
Figure 2. Capture of the infographic. Source: own elaboration.
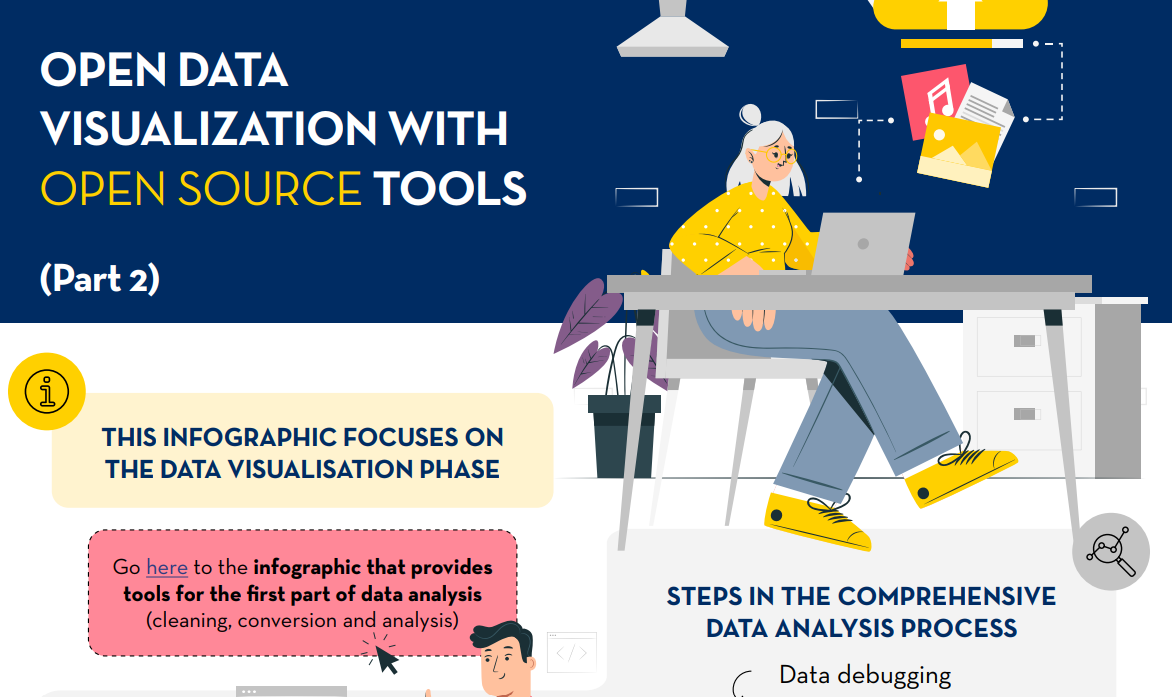
Open data visualization with open source tools (infographic part 2)
Blog
We live in a constantly evolving environment in which data is growing exponentially and is also a fundamental component of the digital economy. In this context, it is necessary to unlock its potential to maximize its value by creating opportunities for its reuse. However, it is important to bear in mind that this increase in speed, scale and variety of data means that ensuring its quality is more complicated.
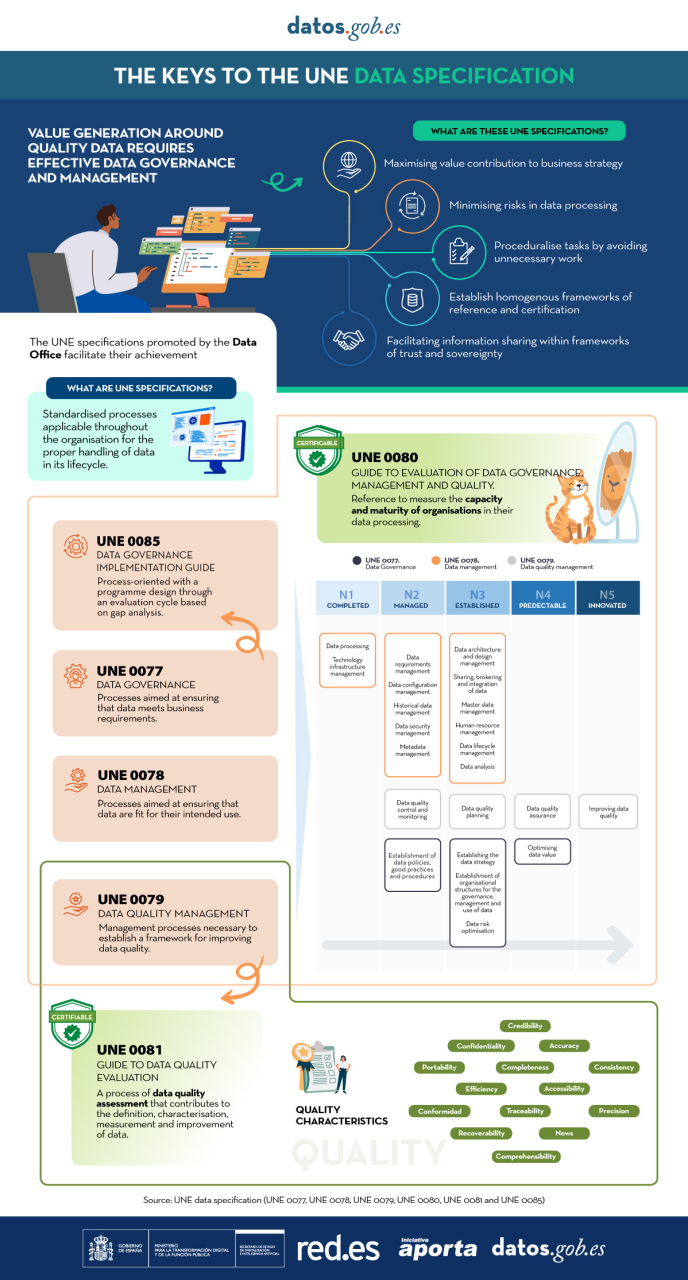
In this scenario, the need arises to establish common processes applicable to the data assets of all organizations throughout their lifecycle. All types of institutions must have well-governed, well-managed data with adequate levels of quality, and a common evaluation methodology is needed that can help to continuously improve these processes and allow the maturity of an organization to be evaluated in a standardized way.
The Data Office has sponsored, promoted and participated in the generation of the UNE specifications, normative resources that allow the implementation of common processes in data management and that also provide a reference framework to establish an organizational data culture.
On the one hand, we find the specifications UNE 0077:2023 Data Governance, UNE 0078:2023 Data Management and UNE 0079:2023 Data Quality Management, which are designed to be applied jointly, enabling a solid reference framework that encourages the adoption of sustainable and effective practices around data.
In addition, a common assessment methodology is needed to enable continuous improvement of data governance, management and data quality management processes, as well as the measurement of the maturity of organizations in a standardized way. The UNE 0080 specification has been developed for the development of a homogeneous framework for the evaluation of an organization's treatment of data.
With the aim of offering a process based on international standards that helps organizations to use a quality model and to define appropriate quality characteristics and metrics, the UNE 0081 Data Quality Assessment specification has been generated, which complements the UNE 0079 Data Quality Management.
The following infographic summarizes the key points of the UNE Specifications on data and the main advantages of their application (click on the image to access the infographic).
Blog
Open data is a valuable tool for making informed decisions that encourage the success of a process and enhance its effectiveness. From a sectorial perspective, open data provides relevant information about the legal, educational, or health sectors. All of these, along with many other areas, utilize open sources to measure improvement compliance or develop tools that streamline work for professionals.
The benefits of using open data are extensive, and their variety goes hand in hand with technological innovation: every day, more opportunities arise to employ open data in the development of innovative solutions. An example of this can be seen in urban development aligned with the sustainability values advocated by the United Nations (UN).
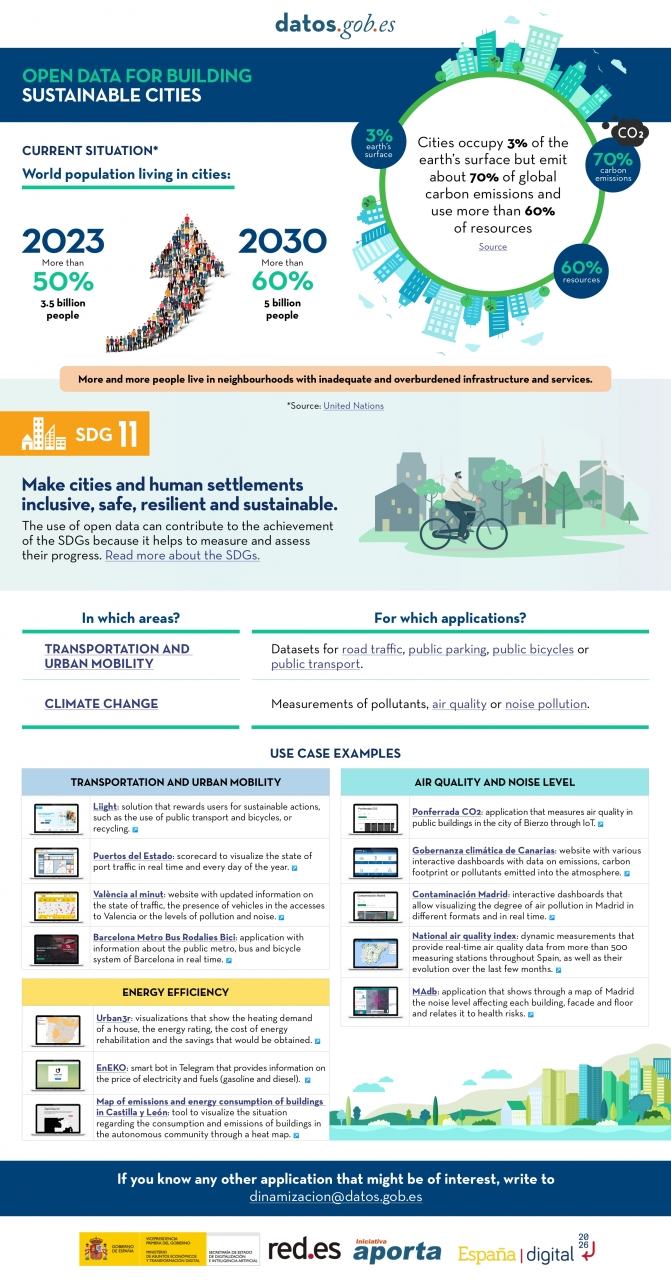
Cities cover only 3% of the Earth's surface; however, they emit 70% of carbon emissions and consume over 60% of the world's resources, according to the UN. In 2023, more than half of the global population lives in cities, and this figure is projected to keep growing. By 2030, it is estimated that over 5 billion people would live in cities, meaning more than 60% of the world's population.
Despite this trend, infrastructures and neighborhoods do not meet the appropriate conditions for sustainable development, and the goal is to "Make cities and human settlements inclusive, safe, resilient, and sustainable," as recognized in Sustainable Development Goal (SDG) number 11. Proper planning and management of urban resources are significant factors in creating and maintaining sustainability-based communities. In this context, open data plays a crucial role in measuring compliance with this SDG and thus achieving the goal of sustainable cities.
In conclusion, open data stands as a fundamental tool for the strengthening and progress of sustainable city development.
In this infographic, we have gathered use cases that utilize sets of open data to monitor and/or enhance energy efficiency, transportation and urban mobility, air quality, and noise levels. Issues that contribute to the proper functioning of urban centers.
Click on the infographic to view it in full size.
Blog
Open solutions, including Open Educational Resources (OER), Open Access to Scientific Information (OA), Free and Open-Source Software (FOSS), and open data, encourage the free flow of information and knowledge, serving as a foundation for addressing global challenges, as reminded by UNESCO.
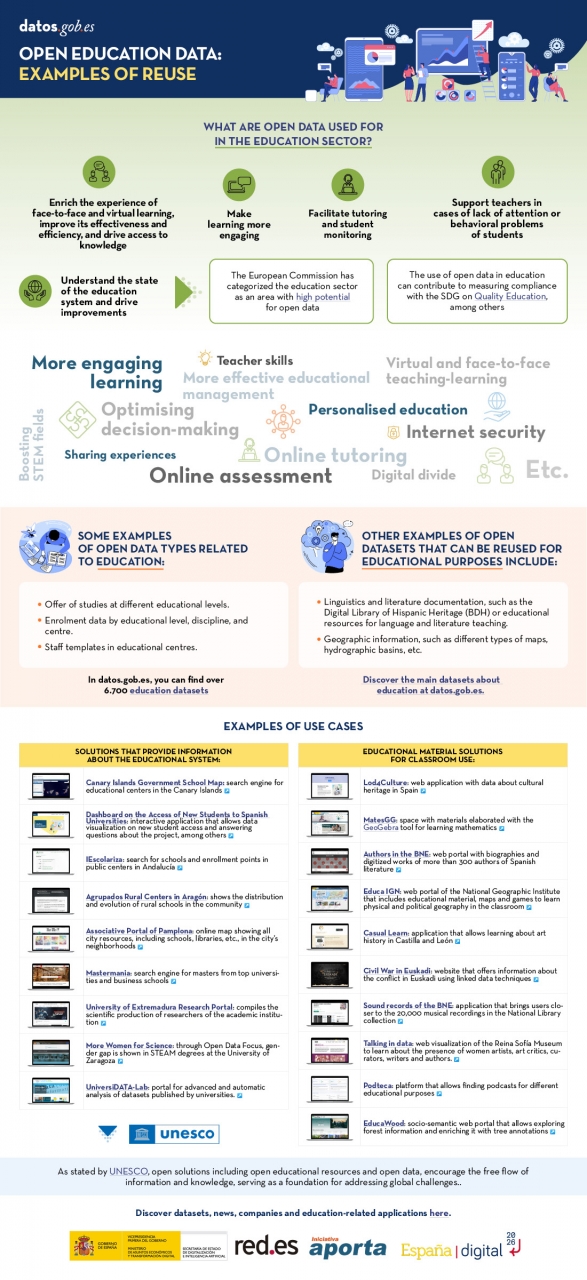
The United Nations Educational, Scientific and Cultural Organization (UNESCO) recognizes the value of open data in the educational field and believes that its use can contribute to measuring the compliance of the Sustainable Development Goals, especially Goal 4 of Quality Education. Other international organizations also recognize the potential of open data in education. For example, the European Commission has classified the education sector as an area with high potential for open data.
Open data can be used as a tool for education and training in different ways. They can be used to develop new educational materials and to collect and analyze information about the state of the educational system, which can be used to drive improvement.
The global pandemic marked a milestone in the education field, as the use of new technologies became essential in the teaching and learning process, which became entirely virtual for months. Although the benefits of incorporating ICT and open solutions into education, a trend known as Edtech, had been talked about for years, COVID-19 accelerated this process.
Benefits of Using Open Data in the Classroom
In the following infographic, we summarize the benefits of utilizing open data in education and training, from the perspective of both students and educators, as well as administrators of the education system.
There are many datasets that can be used for developing educational solutions. At datos.gob.es, there are more than 6,700 datasets available, which can be supplemented by others used for educational purposes in different fields, such as literature, geography, history, etc.
Many solutions have been developed using open data for these purposes. We gather some of them based on their purpose: firstly, solutions that provide information on the education system to understand its situation and plan new measures, and secondly, those that offer educational material to use in the classroom.
In essence, open data is a key tool for the strengthening and progress of education, and we must not forget that education is a universal right and one of the main tools for the progress of humanity.
Blog
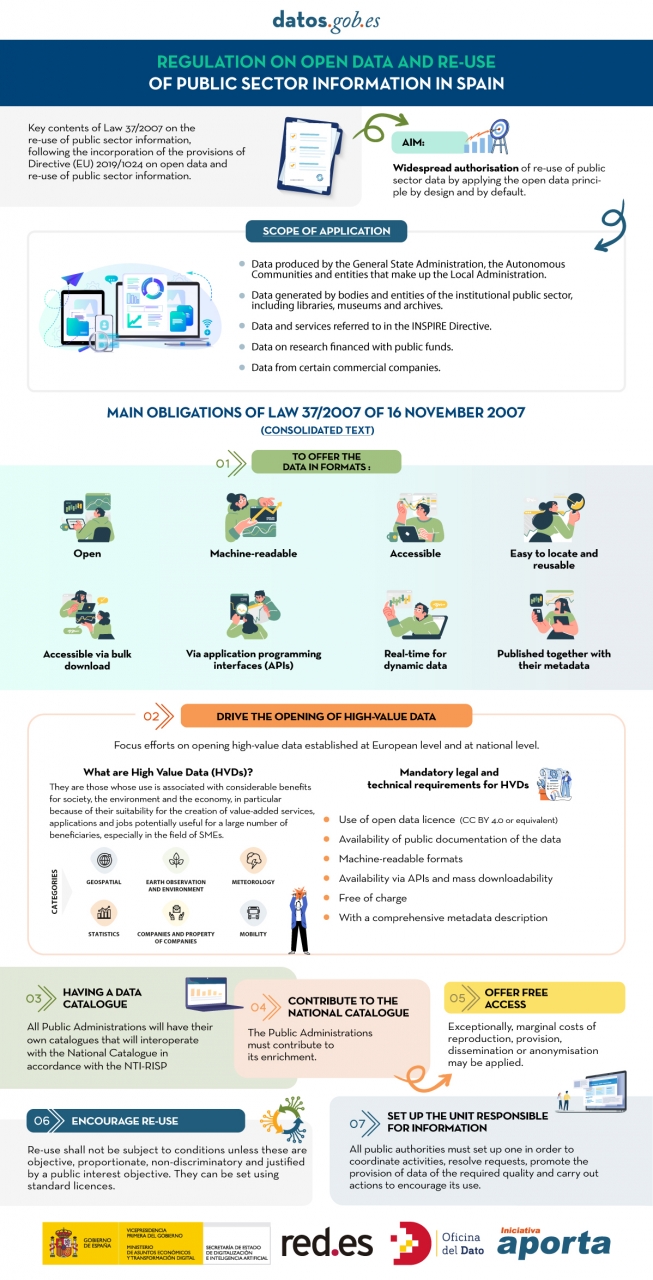
The public sector in Spain will have the duty to guarantee the openness of its data by design and by default, as well as its reuse. This is the result of the amendment of Law 37/2007 on the reuse of public sector information in application of European Directive 2019/1024.
This new wording of the regulation seeks to broaden the scope of application of the Law in order to bring the legal guarantees and obligations closer to the current technological, social and economic context. In this scenario, the current regulation takes into account that greater availability of public sector data can contribute to the development of cutting-edge technologies such as artificial intelligence and all its applications.
Moreover, this initiative is aligned with the European Union's Data Strategy aimed at creating a single data market in which information flows freely between states and the private sector in a mutually beneficial exchange.
From high-value data to the responsible unit of information: obligations under Law 37/2007
In the following infographic, we highlight the main obligations contained in the consolidated text of the law. Emphasis is placed on duties such as promoting the opening of High Value Datasets (HVDS), i.e. datasets with a high potential to generate social, environmental and economic benefits. As required by law, HVDS must be published under an open data attribution licence (CC BY 4.0 or equivalent), in machine-readable format and accompanied by metadata describing the characteristics of the datasets. All of this will be publicly accessible and free of charge with the aim of encouraging technological, economic and social development, especially for SMEs.
In addition to the publication of high-value data, all public administrations will be obliged to have their own data catalogues that will interoperate with the National Catalogue following the NTI-RISP, with the aim of contributing to its enrichment. As in the case of HVDS, access to the datasets of the Public Administrations must be free of charge, with exceptions in the case of HVDS. As with HVDS, access to public authorities' datasets should be free of charge, except for exceptions where marginal costs resulting from data processing may apply.
To guarantee data governance, the law establishes the need to designate a unit responsible for information for each entity to coordinate the opening and re-use of data, and to be in charge of responding to citizens' requests and demands.
In short, Law 37/2007 has been modified with the aim of offering legal guarantees to the demands of competitiveness and innovation raised by technologies such as artificial intelligence or the internet of things, as well as to realities such as data spaces where open data is presented as a key element.
Click on the infographic to see it full size:
Documentación
In this article we compile a series of infographics aimed at both publishers and reusers working with open data. They show standards and good practices to facilitate both the publication and the processing of data.
Technical guide: Data version control
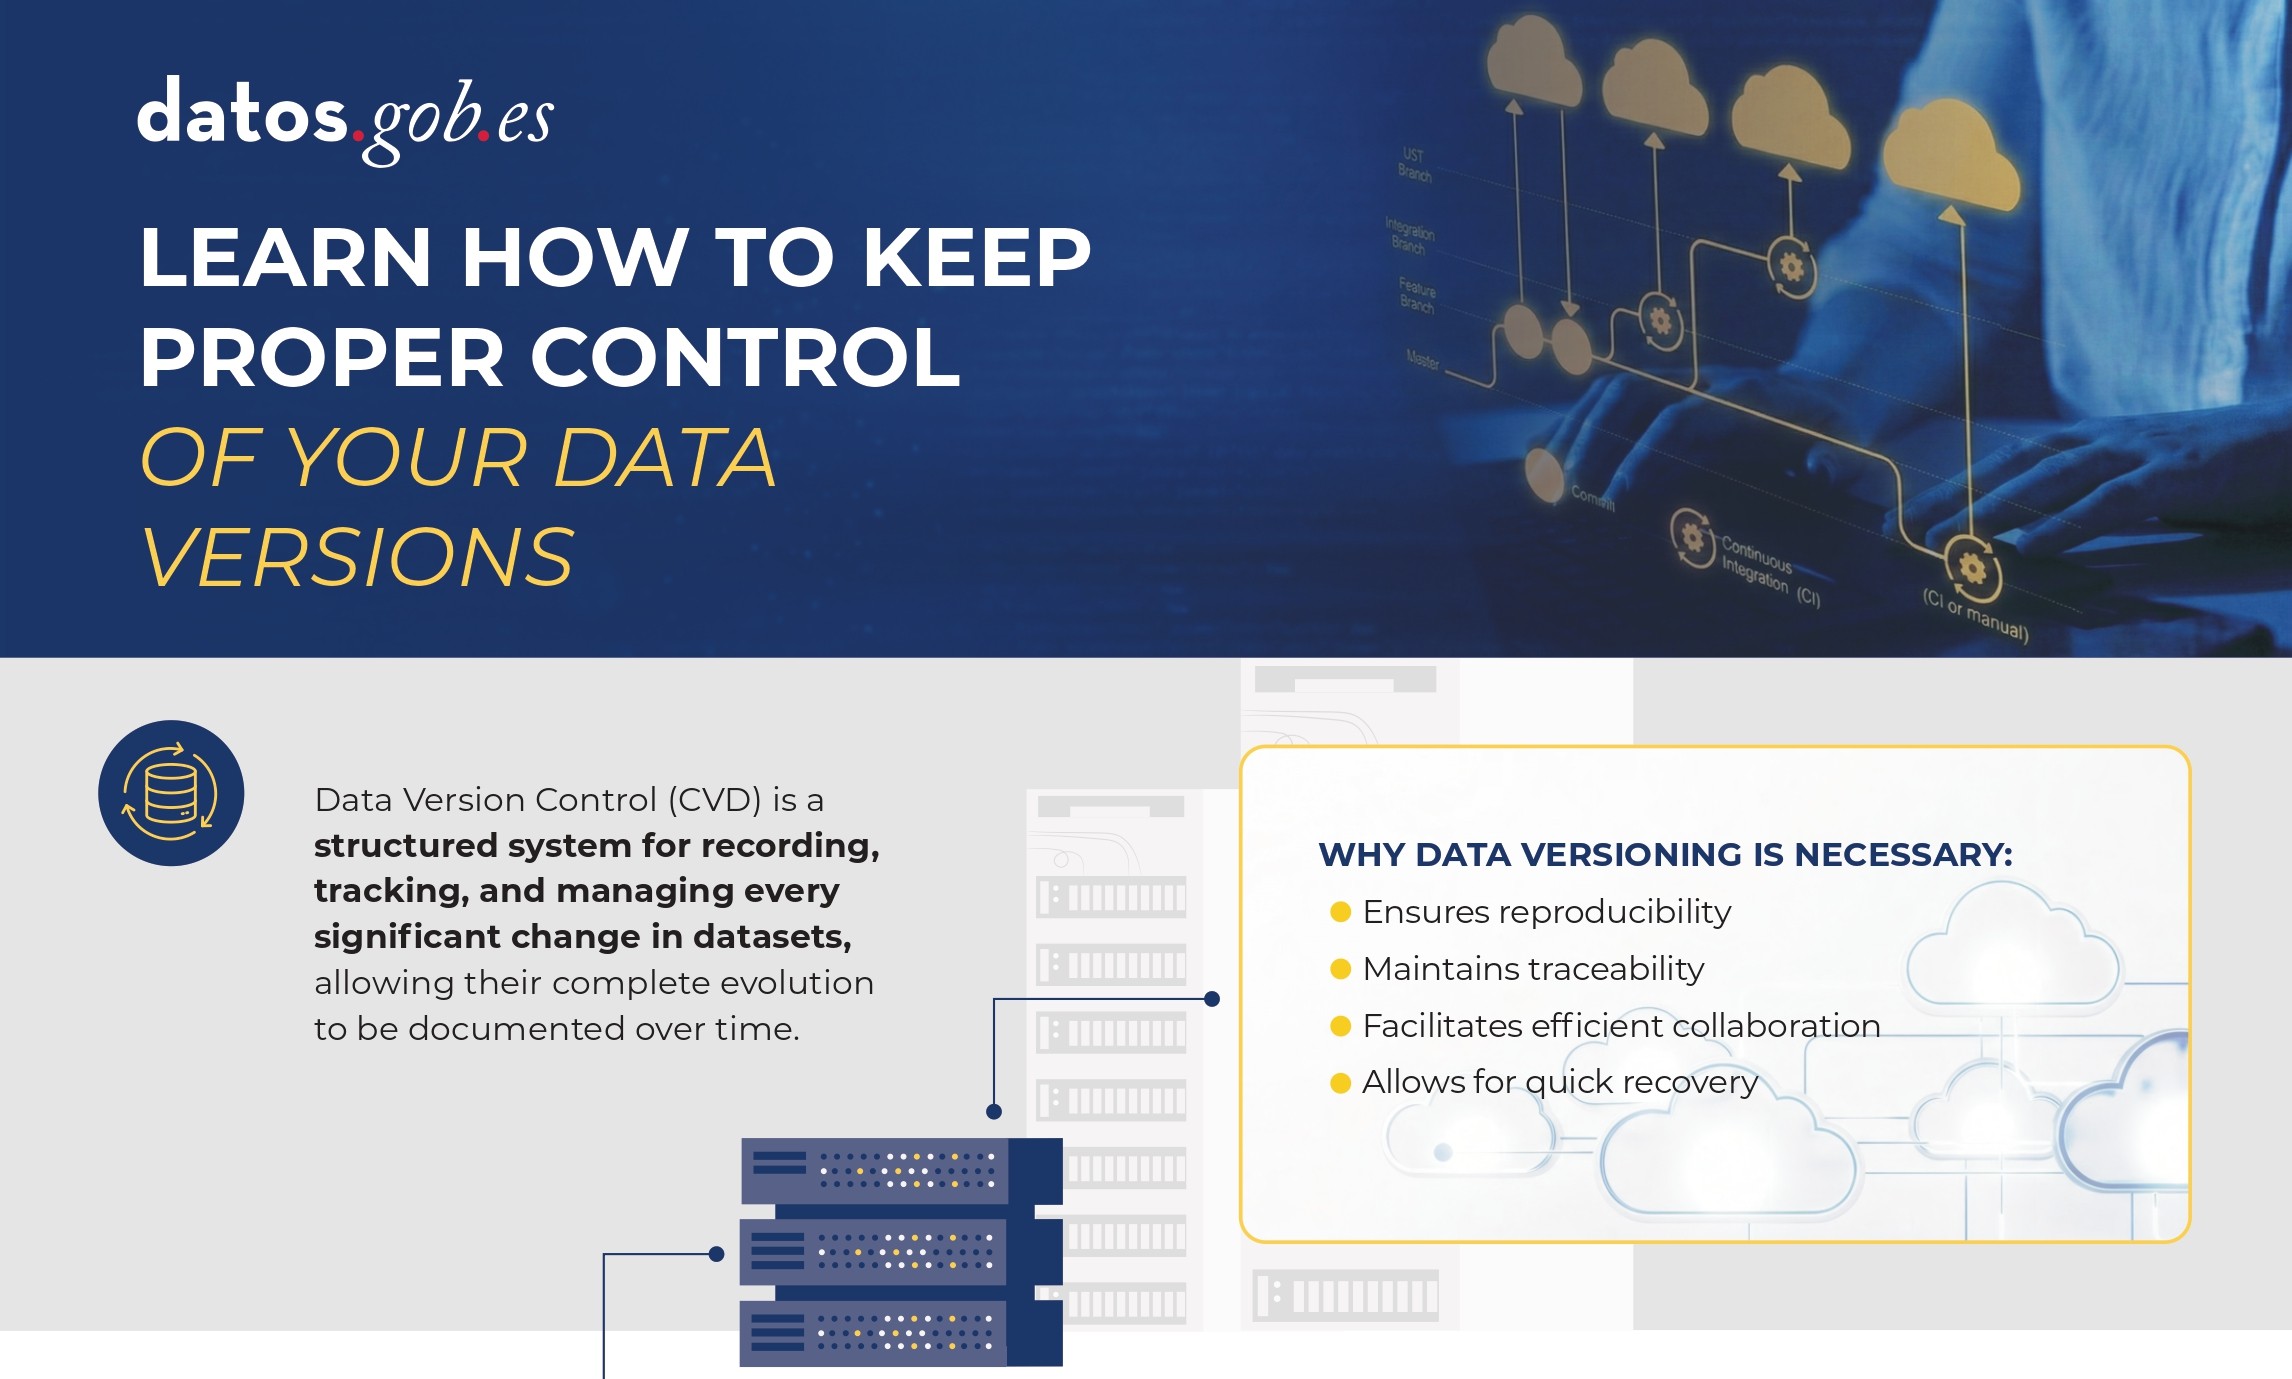 |
Published: January 2026 Data Version Control (DVC) allows you to record and document the complete evolution of a data set, facilitating collaboration, auditing, and recovery of previous versions. Without a clear system for managing these changes, it is easy to lose traceability. In this infographic, we explain how to implement DVC. |
DCAT-AP-ES: A step forward in open data interoperability
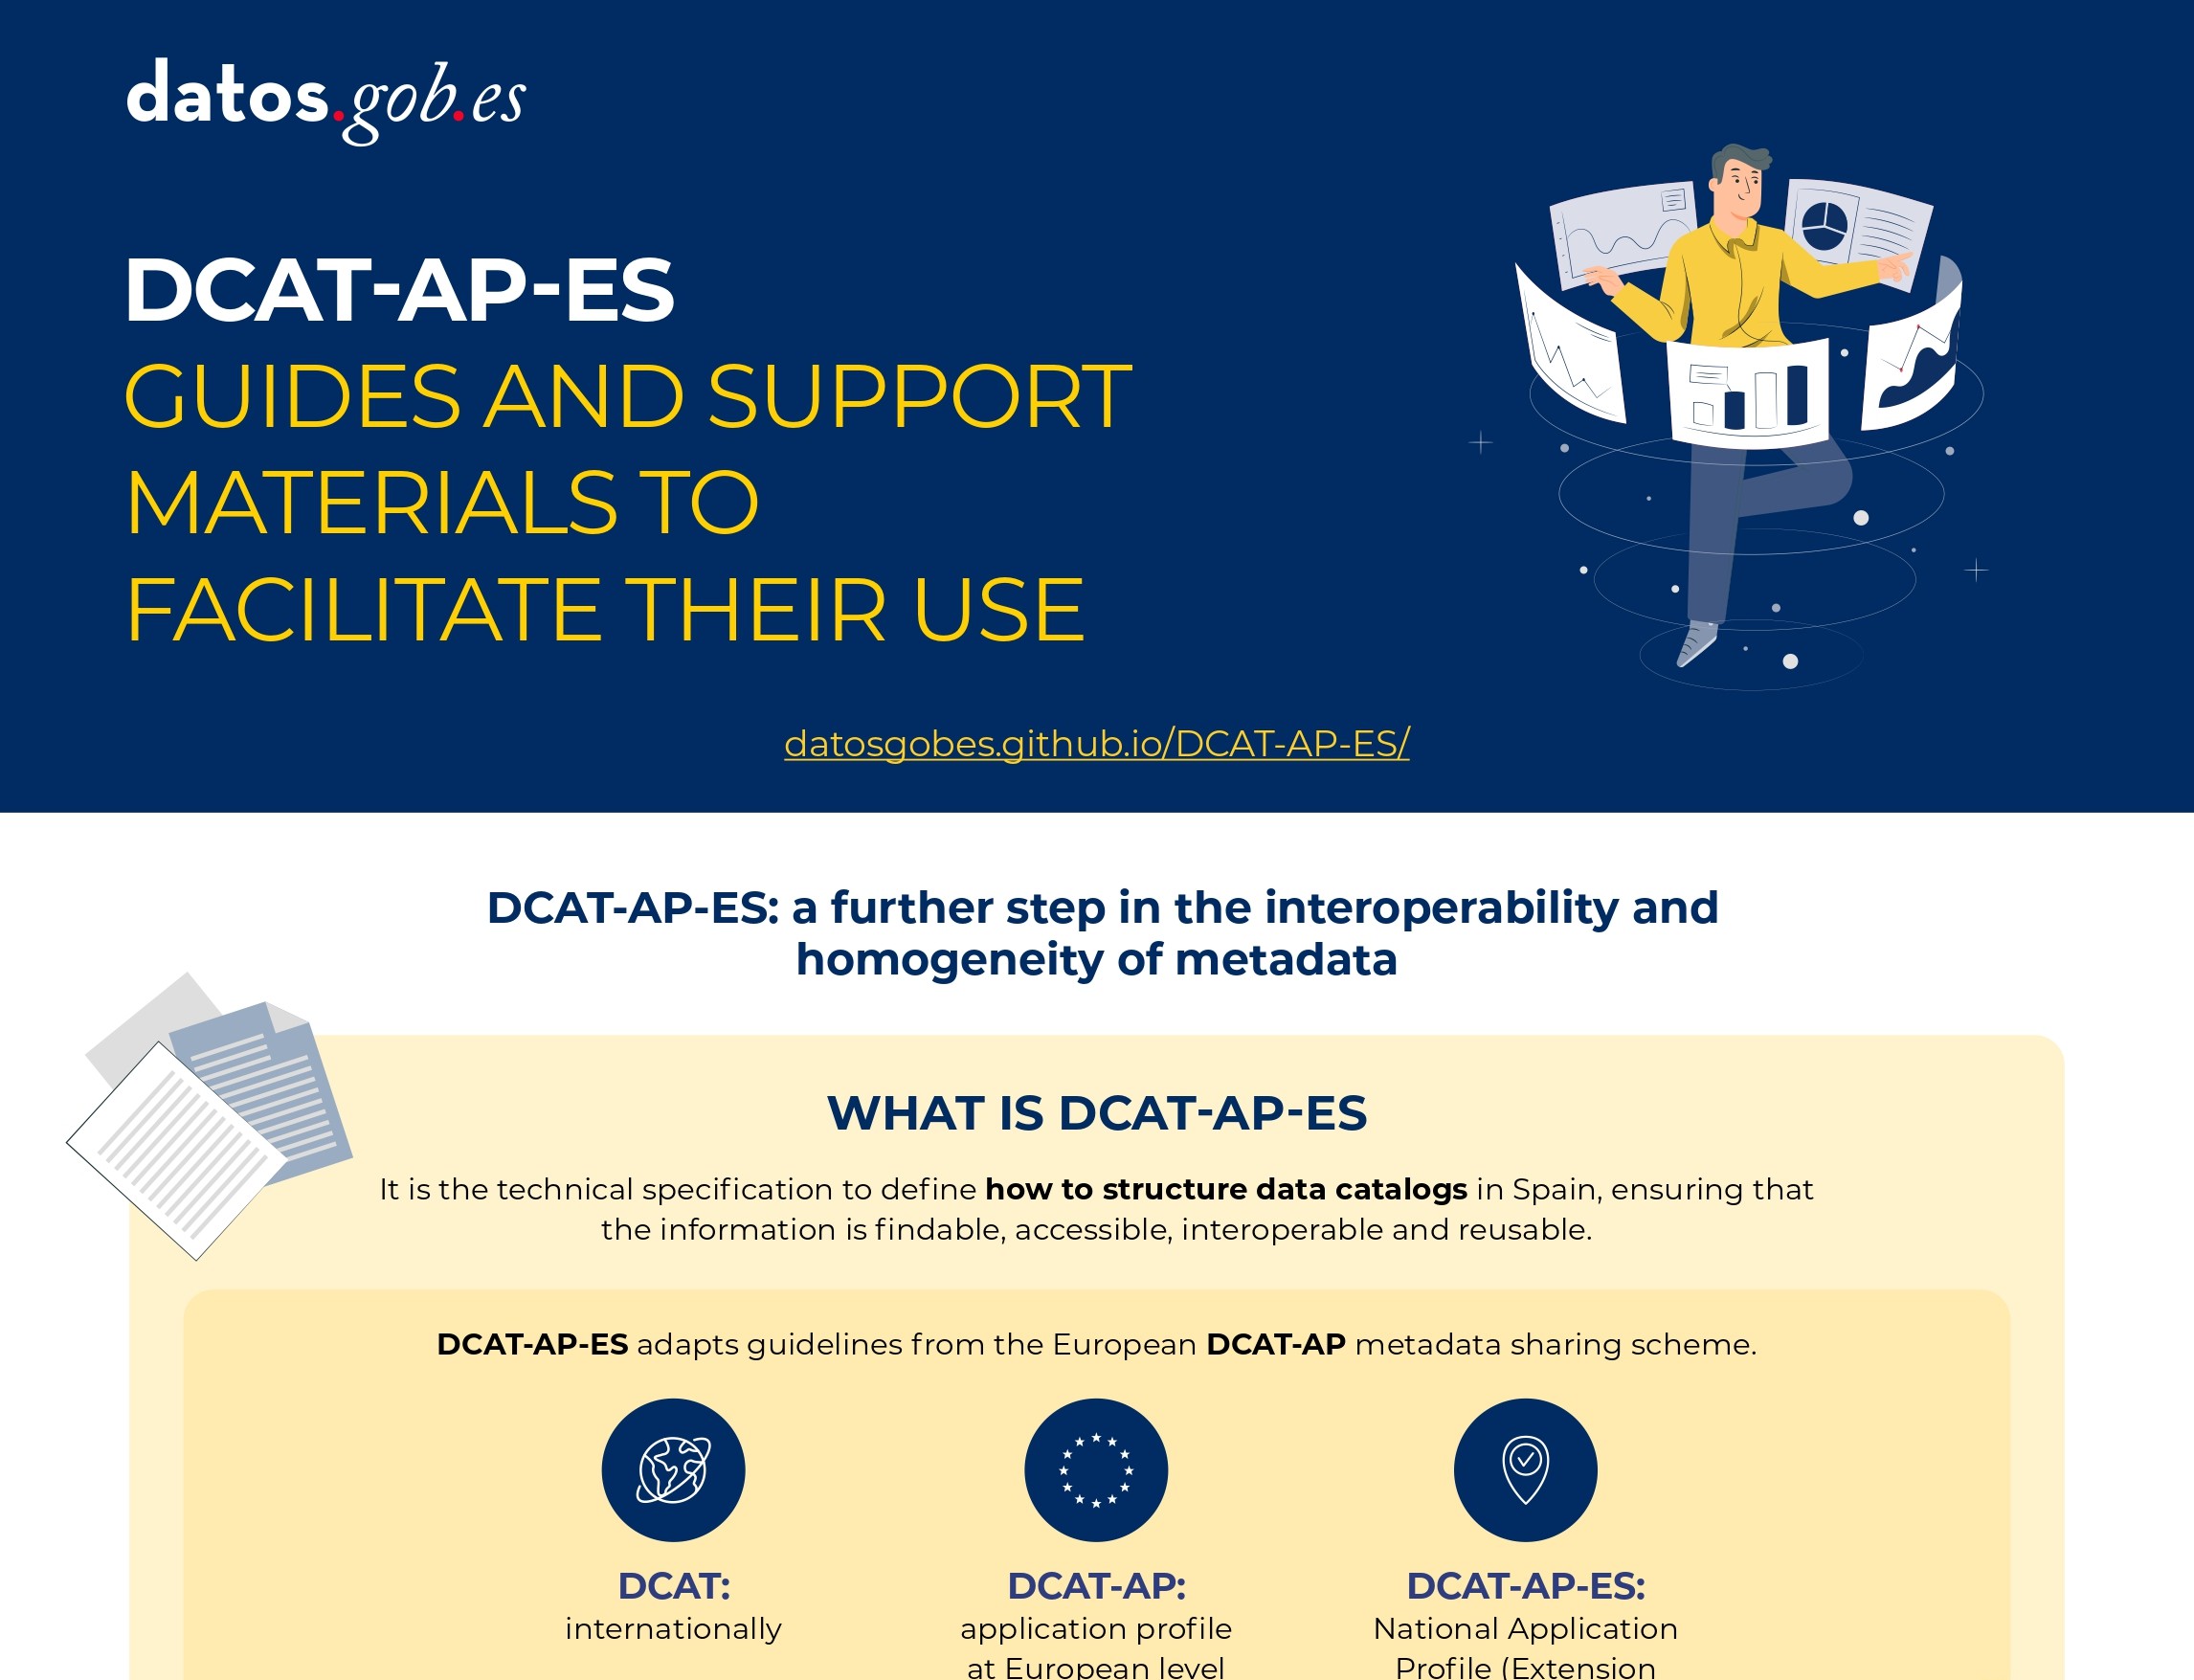 |
Published: august 2025 This new metadata model adopts the guidelines of the European metadata exchange schema DCAT-AP (Data Catalog Vocabulary-Application Profile) with some additional restrictions and adjustments.
|
Guide for the deployment of data portals. Good practices and recommendations
 |
Published: april 2025 This infographic summarizes best practices and recommendations for designing, developing and deploying open data portals at the municipal level. Specifically, it includes: strategic framework, general requirements and technical and functional guidelines. |
Data Act (DA)
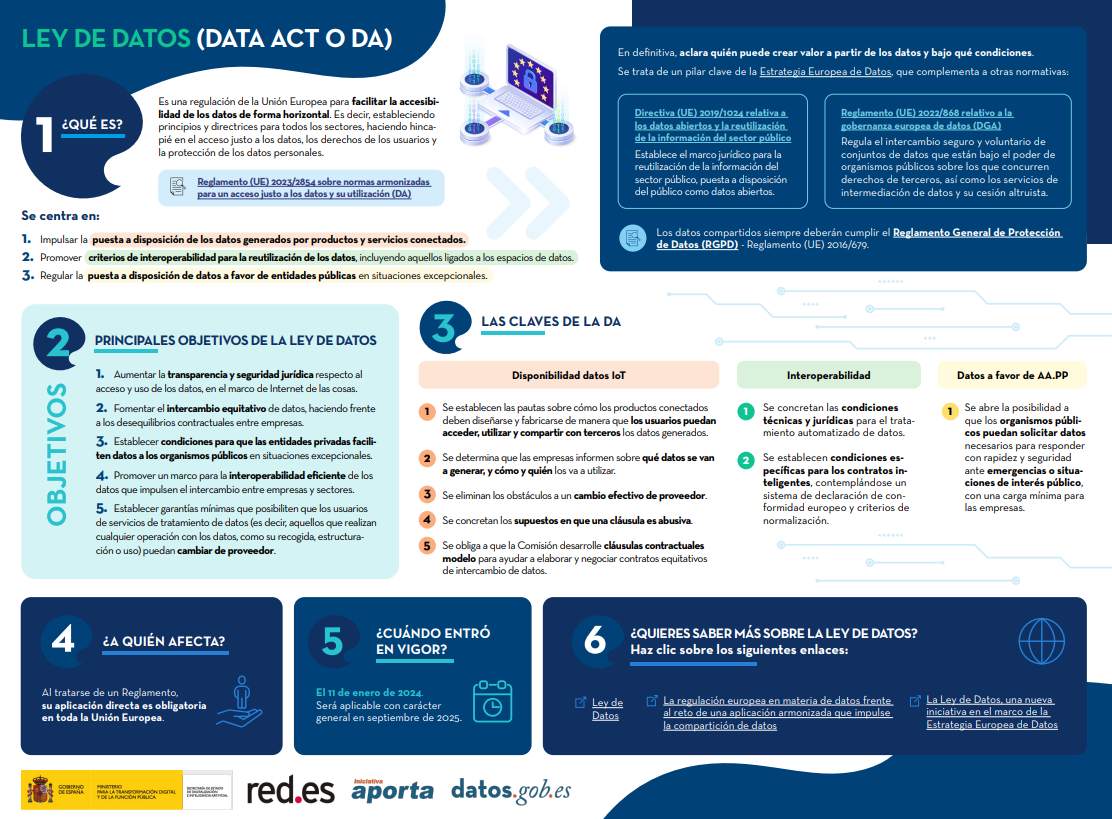 |
Published: February 2024 The Data Act is a European Union regulation to facilitate data accessibility in a horizontal way. In other words, it establishes principles and guidelines for all sectors, emphasizing fair access to data, user rights and the protection of personal data. Find out what its keys are in this infographic. A one-page version has also been created for easy printing: click here. |
Data Governance Act (DGA)
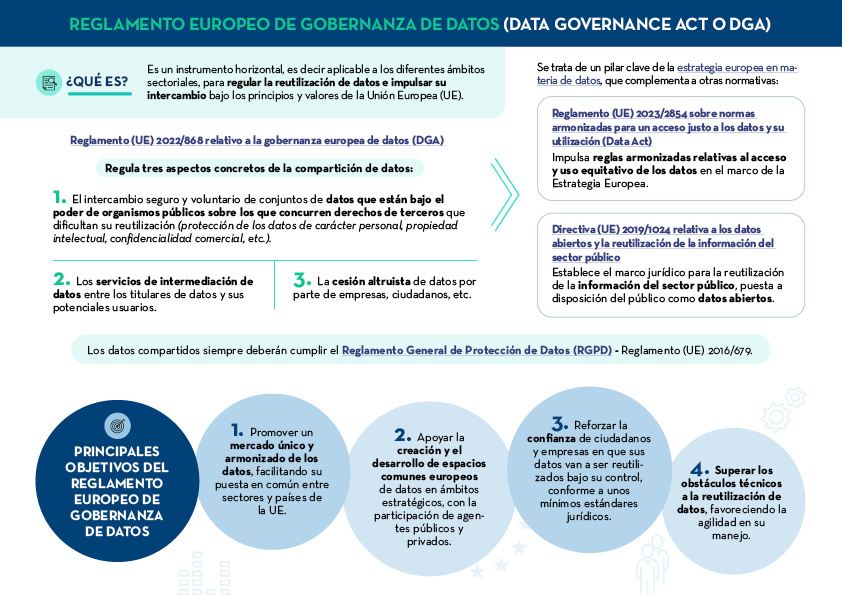 |
Published: January 2024 The European Data Governance Act (DGA) is a horizontal instrument to regulate the reuse of data and promote its exchange under the principles and values of the European Union (EU). Find out what are its keys in this infographic. A one-page version has also been created to make printing easier: click here. |
How to create an action plan to drive openness and reuse of open data
 |
Published: November 2022 This infographic shows the different elements that should be included in a Plan of measures to promote openness and reuse of open data. The aim is that the units responsible for openness can draw up a feasible roadmap for open data, which also allows for its monitoring and evaluation. |
8 guides to improve data publication and processing
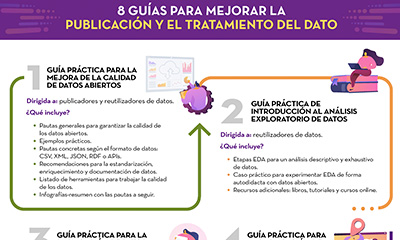 |
Published: October 2022 At datos.gob.es we have prepared different guides to help publishers and reusers when preparing data for publication and/or analysis. In this infographic we summarise the content of eight of them. |
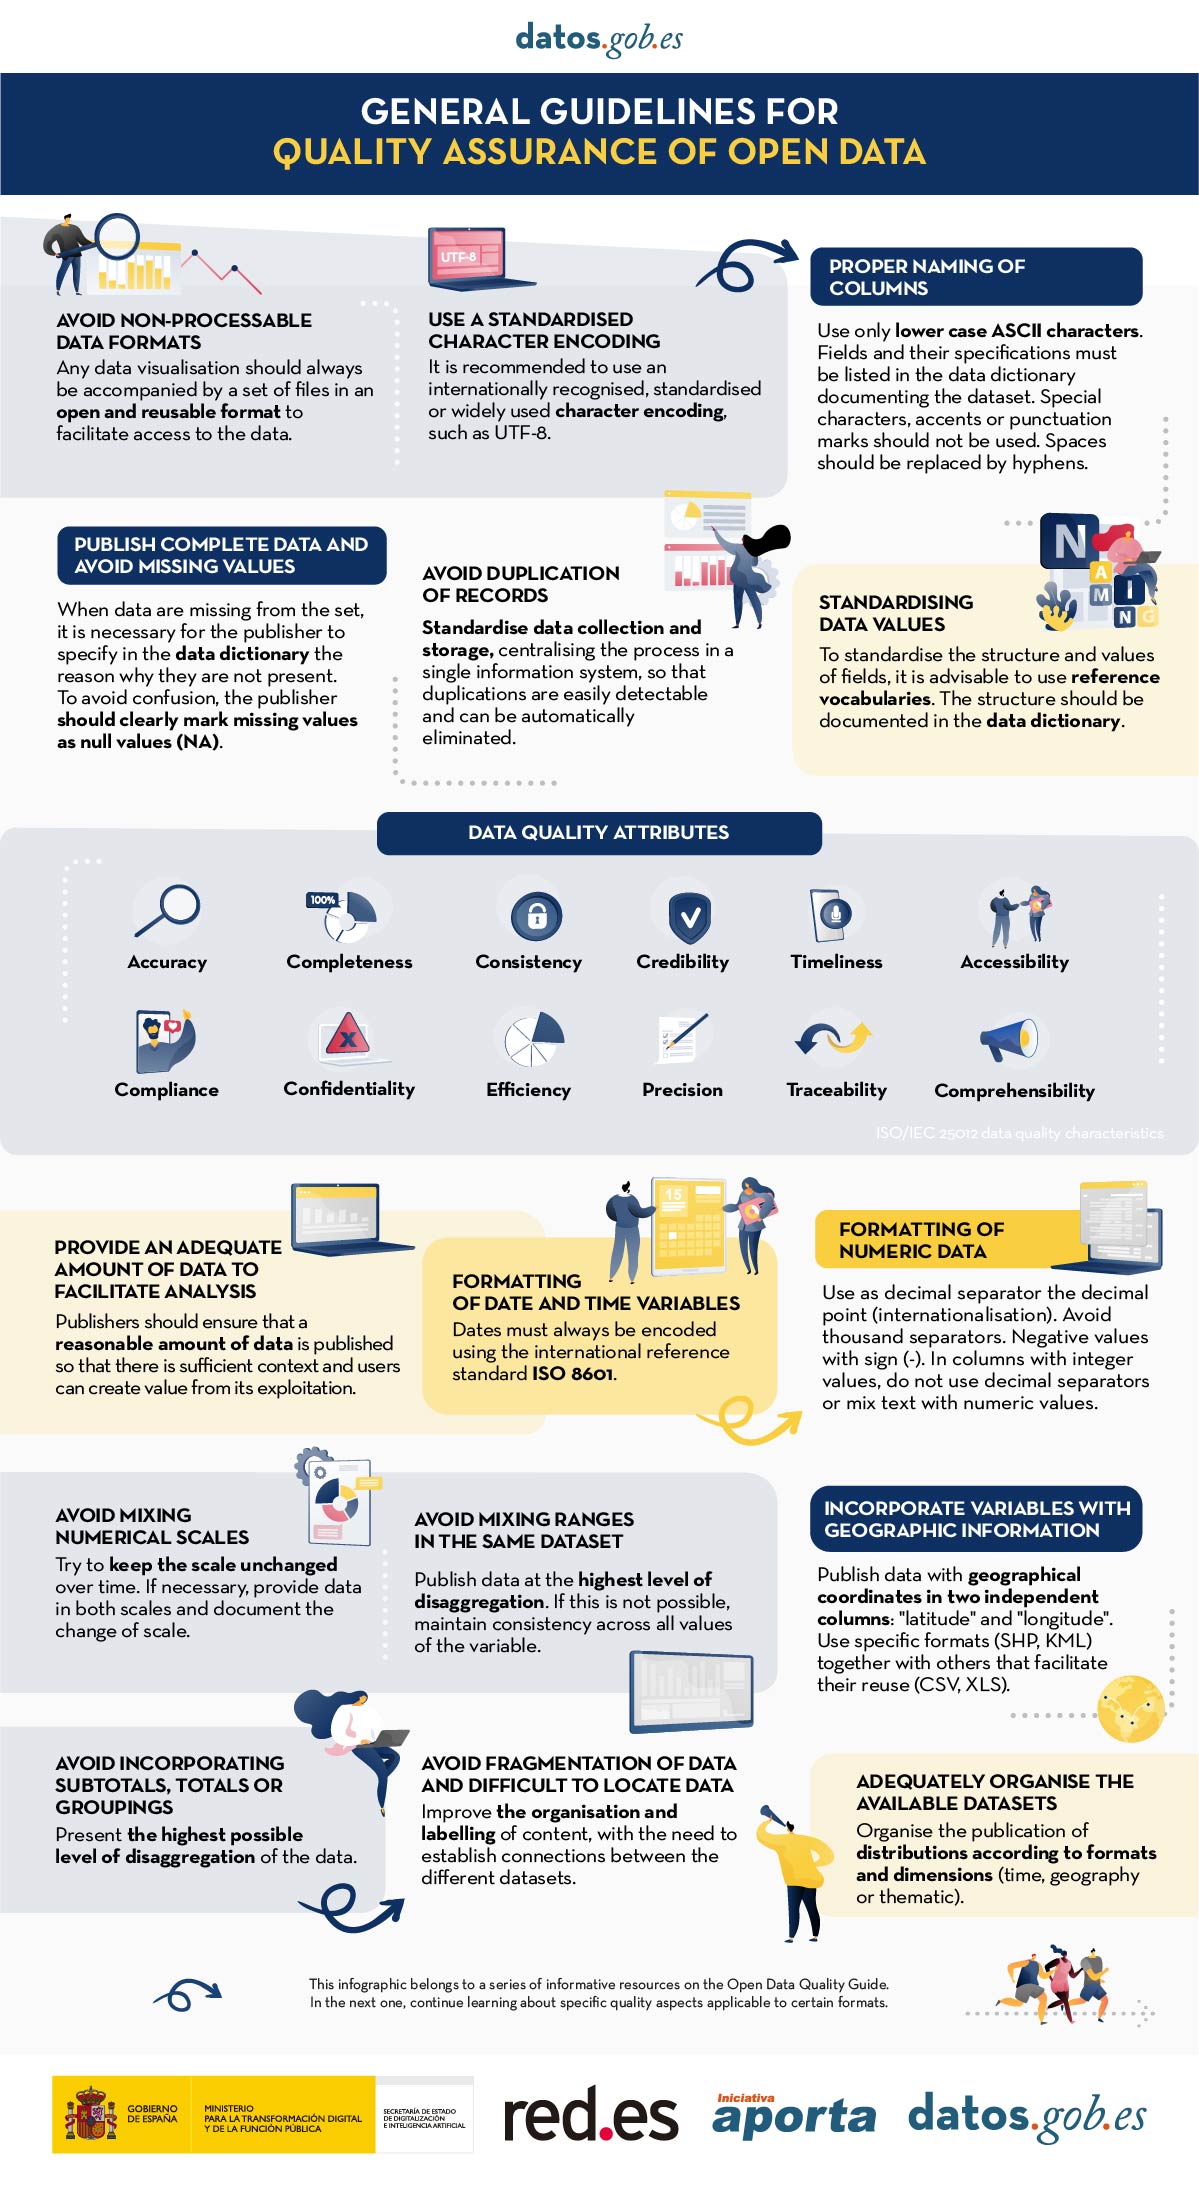
General guidelines for quality assurance of open data
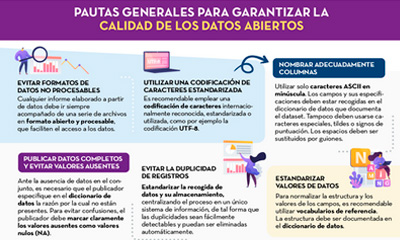 |
Published: September 2022 This infographic details general guidelines for ensuring the quality of open data, such as using standardised character encoding, avoiding duplicate records or incorporating variables with geographic information. |
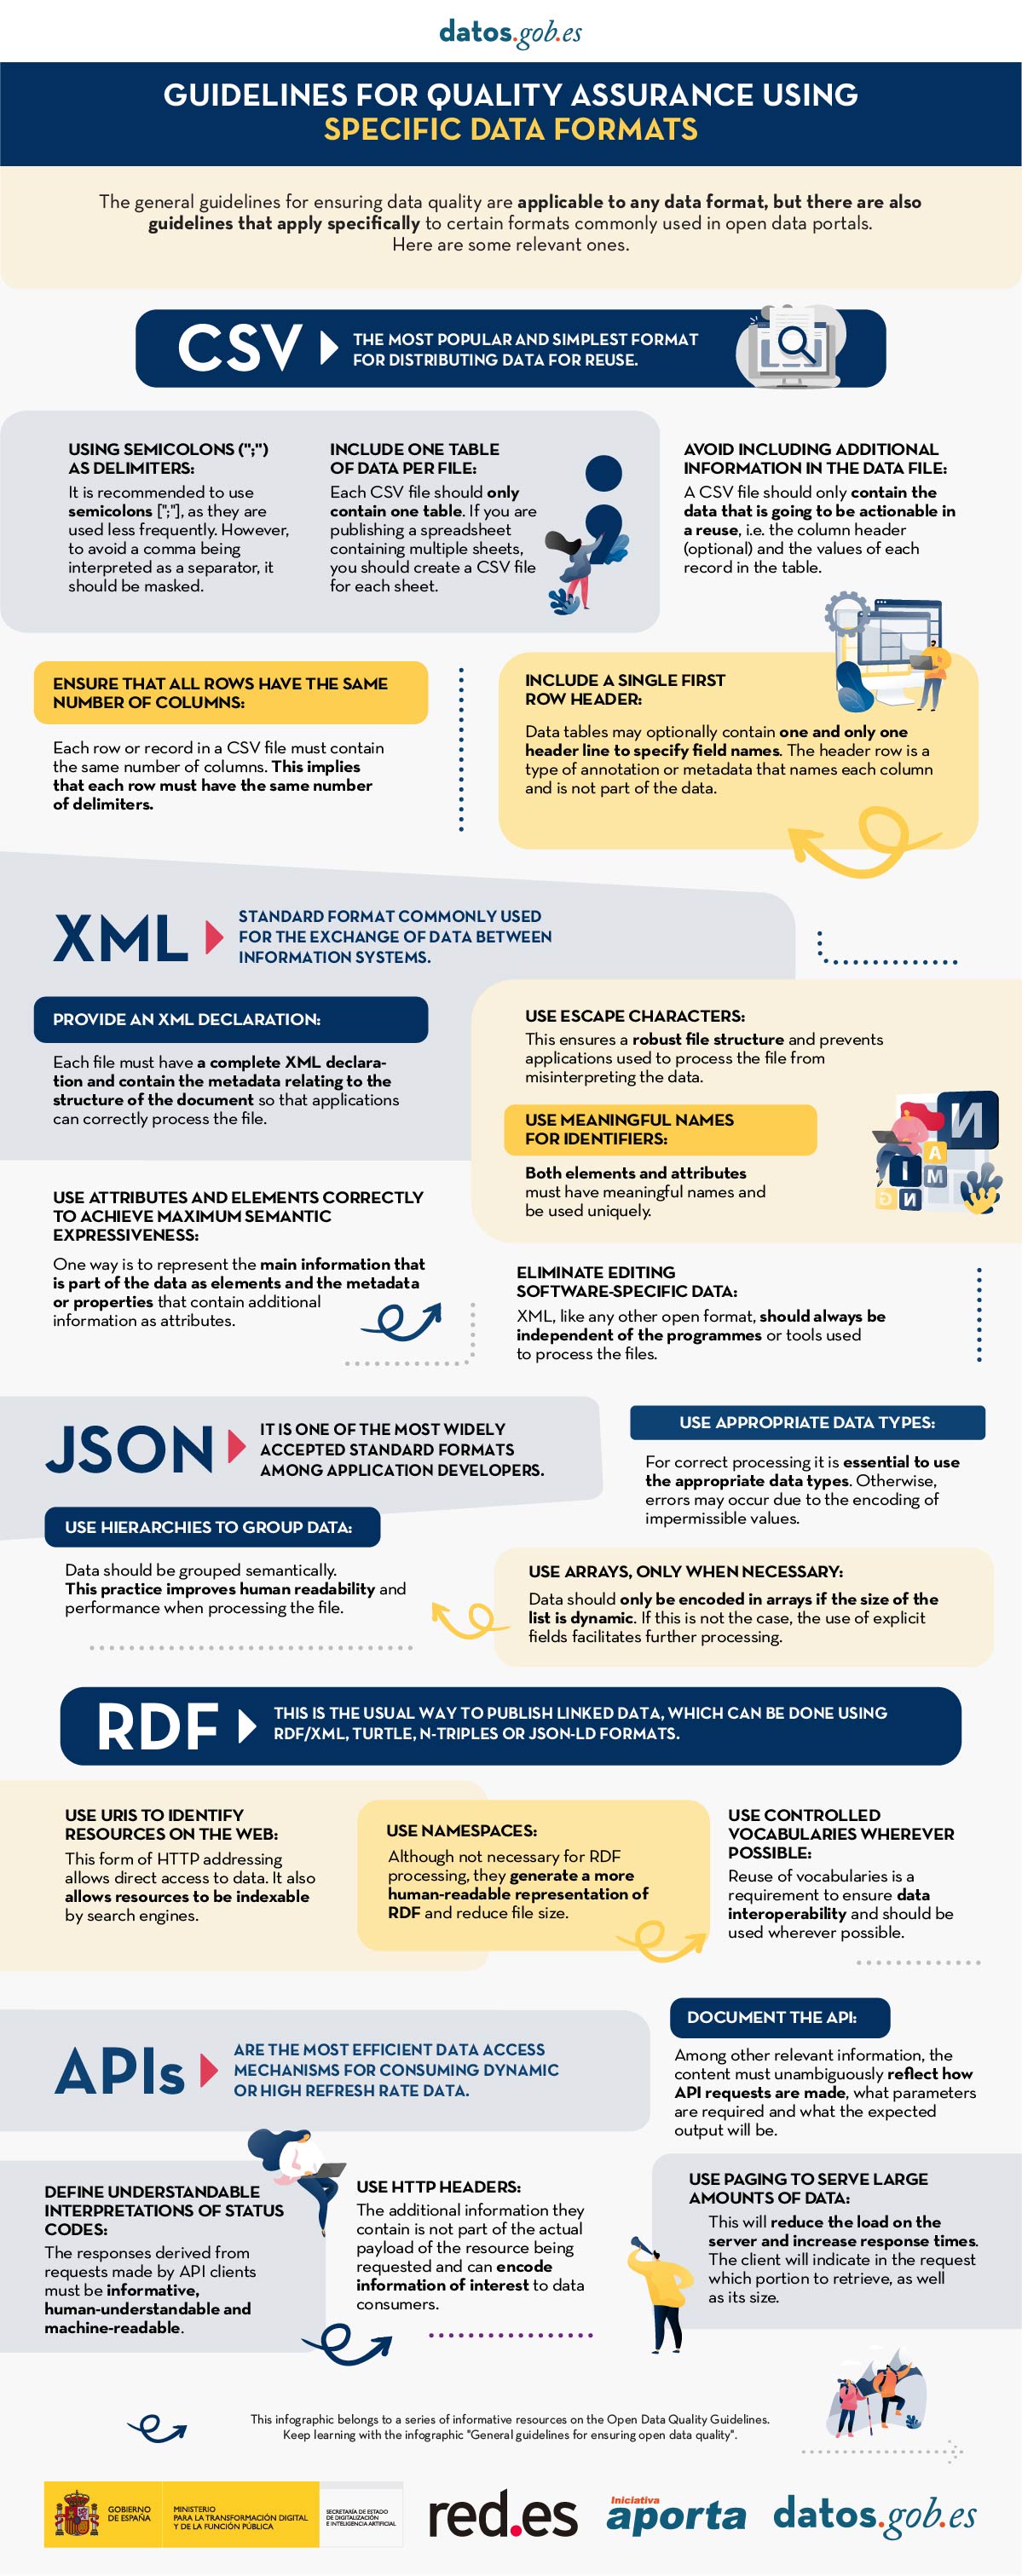
Guidelines for quality assurance using specific data formats
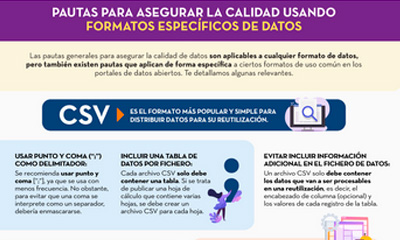 |
Published: September 2022 This infographic provides specific guidelines for ensuring the quality of open data according to the data format used. Specific guidelines have been included for CSV, XML, JSON, RDF and APIs. |
Technical standards for good data governance
 |
Published: May 2022 This infographic shows the standards to be taken into account for proper data governance, according to the Spanish Association for Standardisation (UNE). These standards are based on 4 principles: Governance, Management, Quality and Security and data privacy. |
APIs for open data access
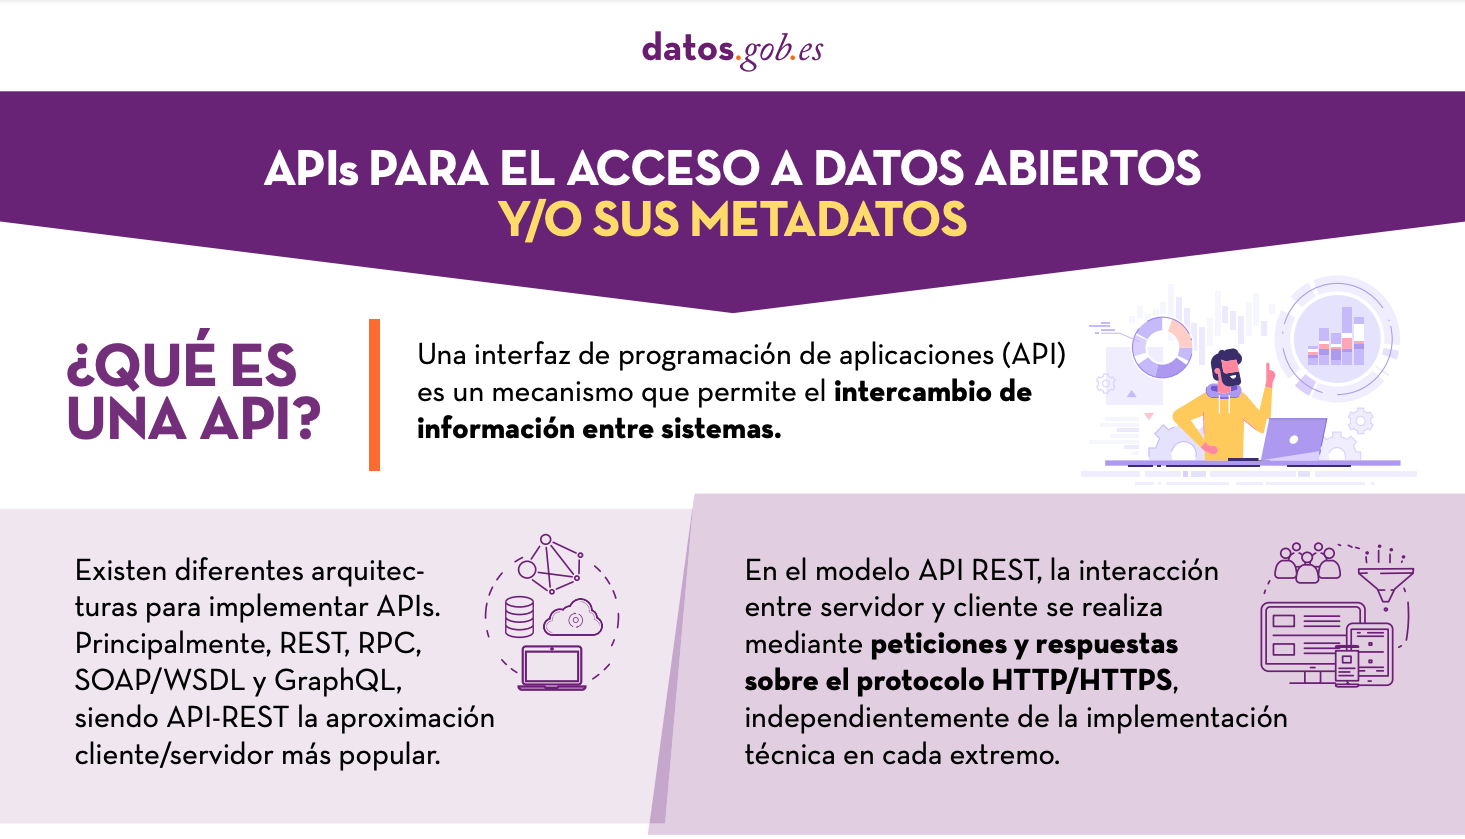 |
Published: January 2022 Many open data portals in Spain already have their own APIs to facilitate access to data and metadata. This infographic shows some examples at national, regional and local level, including information about the datos.gob.es API.. |
Documentación
When publishing open data, it is essential to ensure its quality. If data is well documented and of the required quality, it will be easier to reuse, as there will be less additional work for cleaning and processing. In addition, poor data quality can be costly for publishers, who may spend more money on fixing errors than on avoiding potential problems in advance.
To help in this task, the Aporta Initiative has developed the "Practical guide for improving the quality of open data", which provides a compendium of guidelines for acting on each of the characteristics that define quality, driving its improvement. The document takes as a reference the data.europe.eu data quality guide, published in 2021 by the Publications Office of the European Union.
Who is the guide aimed at?
The guide is aimed at open data publishers, providing them with clear guidelines on how to improve the quality of their data.
However, this collection can also provide guidance to data re-users on how to address the quality weaknesses that may be present in the datasets they work with.
What does the guide include?
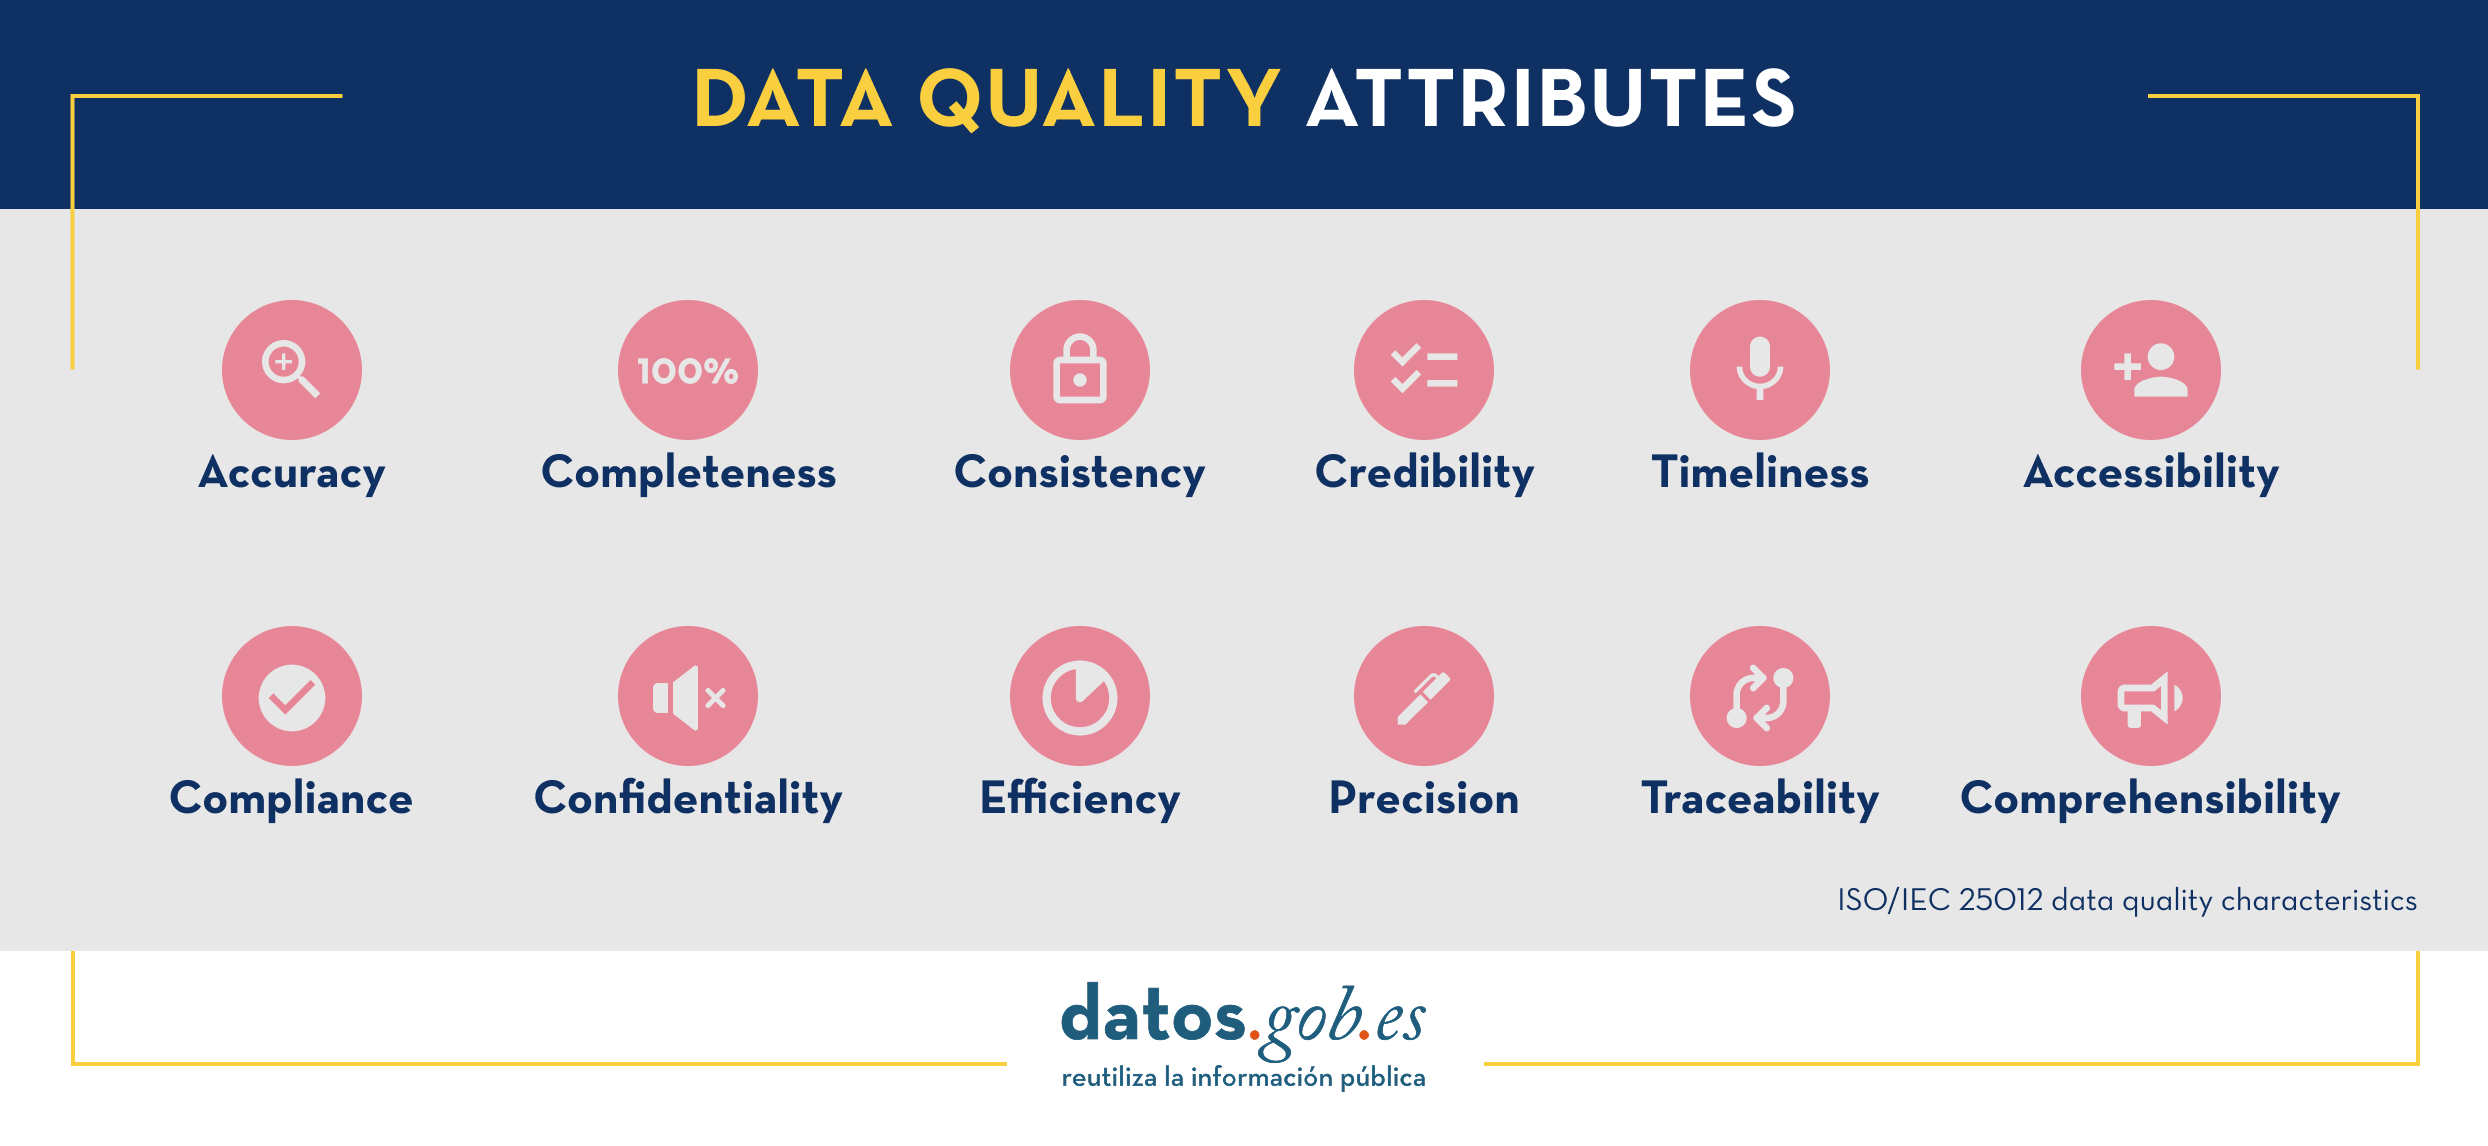
The document begins by defining the characteristics, according to ISO/IEC 25012, that data must meet in order to be considered quality data, which are shown in the following image
Next, the bulk of the guide focuses on the description of recommendations and good practices to avoid the most common problems that usually arise when publishing open data, structured as follows:
- A first part where a series of general guidelines are detailed to guarantee the quality of open data, such as, for example, using a standardised character encoding, avoiding duplicity of records or incorporating variables with geographic information. For each guideline, a detailed description of the problem, the quality characteristics affected and recommendations for their resolution are provided, together with practical examples to facilitate understanding.
- A second part with specific guidelines for ensuring the quality of open data according to the data format used. Specific guidelines are included for CSV, XML, JSON, RDF and APIs.
- Finally, the guide also includes recommendations for data standardisation and enrichment, as well as for data documentation, and a list of useful tools for working on data quality.
You can download the guide here or at the bottom of the page (only available in Spanish).
Additional materials
The guide is accompanied by a series of infographics that compile the above guidelines:
- Infographic "General guidelines for quality assurance of open data".
- Infographic "Guidelines for quality assurance using specific data formats”.
Documentación
Data is a key pillar of digital transformation. Reliable and quality data are the basis of everything, from the main strategic decisions to the routine operational process, they are fundamental in the development of data spaces, as well as the basis of disruptive solutions linked to fields such as artificial intelligence or Big Data.
In this sense, the correct management and governance of data has become a strategic activity for all types of organizations, public and private.
Data governance standardization is based on 4 principles:
- Governance
- Management
- Quality
- Security and data privacy
Those organizations that want to implement a solid governance framework based on these pillars have at their disposal a series of technical standards that provide guiding principles to ensure that an organization's data is properly managed and governed, both internally and by external contracts.
With the aim of trying to clarify doubts in this matter, the Spanish Association for Standardization (UNE), has published various support materials.
The first is an article on the different technical standards to consider when developing effective data governance . The rules contained in said article, together with some additional ones, are summarized in the following infographic:
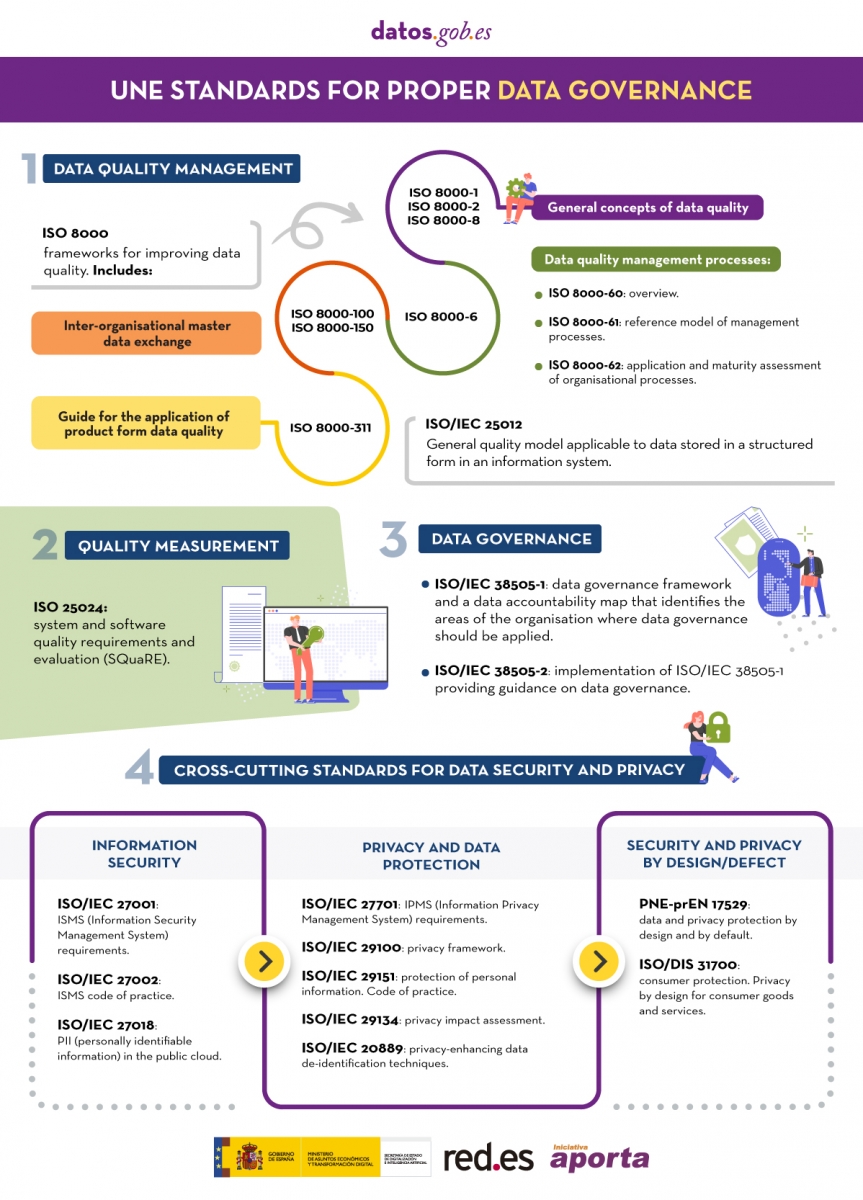
(You can download the accessible version in word here)
In addition, the UNE has also published the report "Standards for the data economy" , which can be downloaded at the end of this article. The report begins with an introduction where the European legislative context that is promoting the Data Economy is deepened and the recognition that it makes of technical standardization as a key tool when it comes to achieving the objectives set. The technical standards included in the previous infographic are analyzed in more detail below.