Documentación
Discover which are the strategic frameworks that mark the publication and use of open data, as well as the most outstanding datasets at local, regional, national and international level through the various infographics that we will publish periodically.
European Health Data Space: objectives and approach
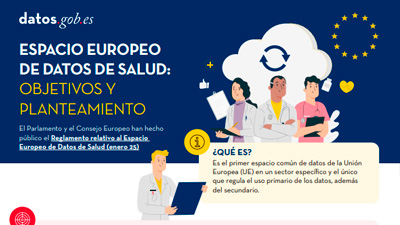 |
Published: February 2024 In this infographic we tell you the keys to the EU''s first common European data space in a specific sector and the only one that regulates primary, as well as secondary data use. Discover the areas of action, related projects and next steps. |
Data and its governance in the European Artificial Intelligence Regulation
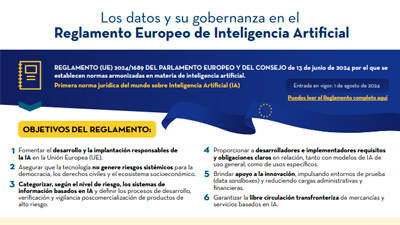 |
Published: October 2024 The European Regulation on Artificial Intelligence seeks to constitute a reference framework for the development of any system and to inspire codes of good practice, technical standards and certification schemes. In this infographic we tell you about its keys. |
Examples of open datasets published by local entities
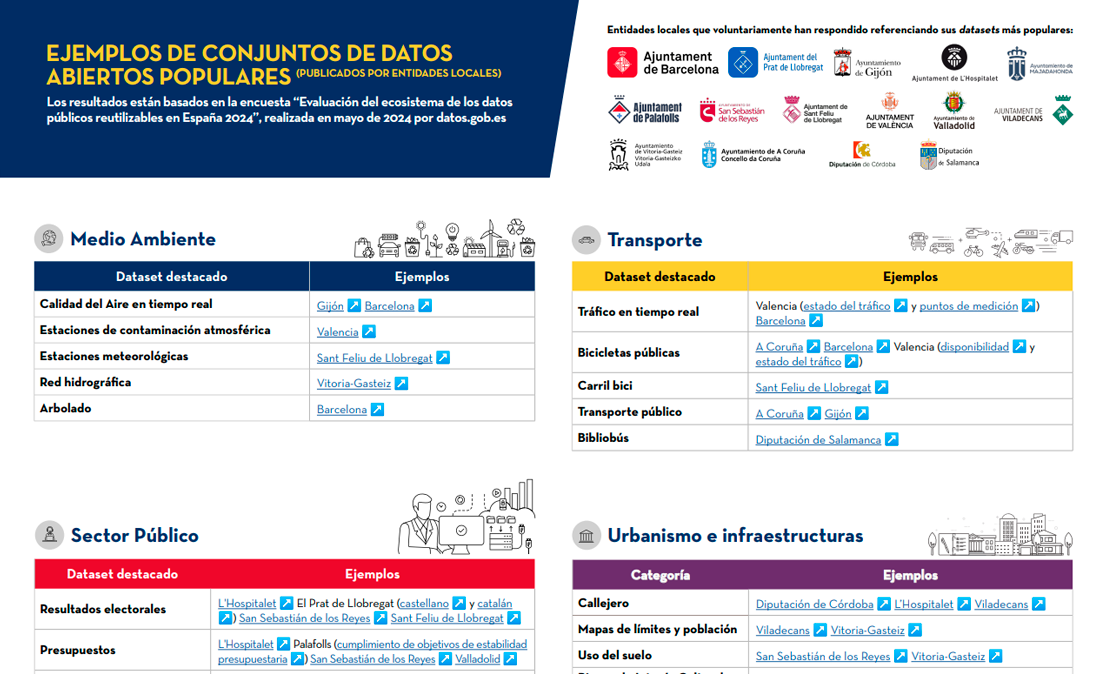 |
Published: September 2024 In order to learn about their open data activities, a survey was conducted last May in which representatives of local entities participated. This infographic collects examples of the most popular datasets from their portals. |
European Declaration on Digital Rights and Principles
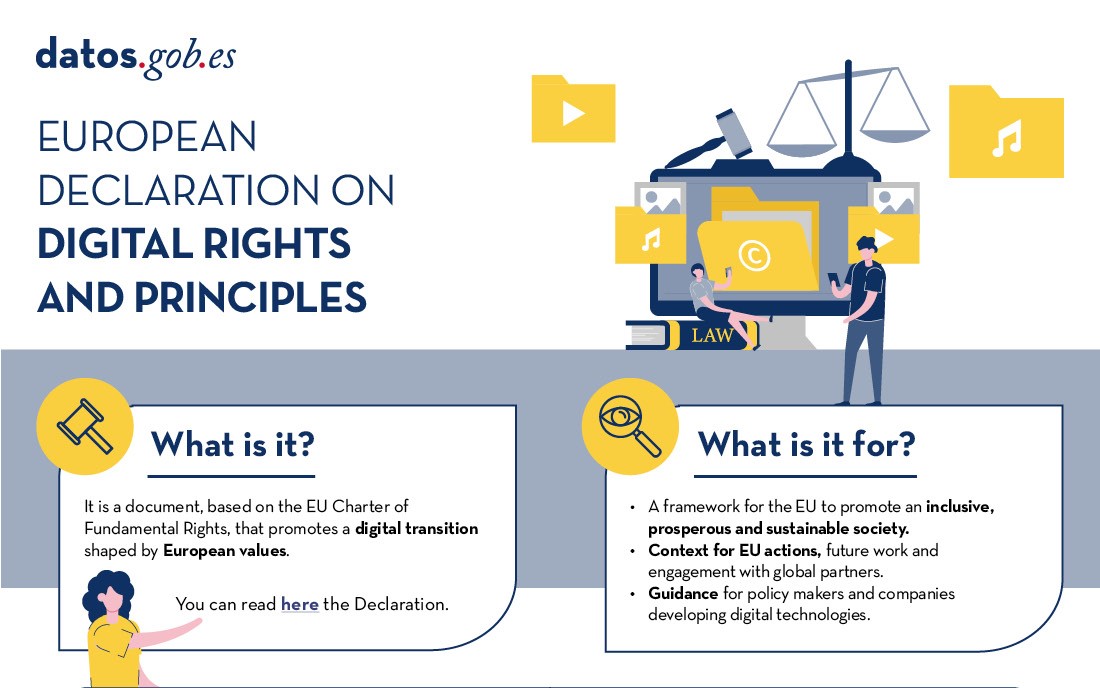 |
Published: August 2024 The Declaration is based on the EU Charter of Fundamental Rights, which promotes a digital transition shaped by European values. In this infographic, the principles that shape it and the opinion of European citizenship for each of them are presented. |
Artificial intelligence strategy 2024
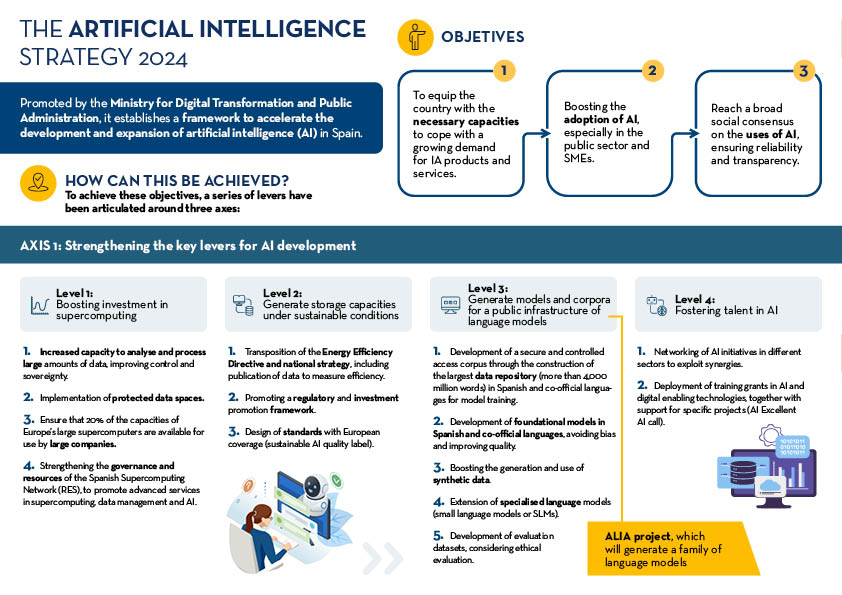 |
Published: July 2024 The new artificial intelligence strategy 2024 establishes a framework to accelerate the development and expansion of AI in Spain. It is articulated around three main axes developed through eight lines of action, which are detailed in this infographic. |
High value datasets
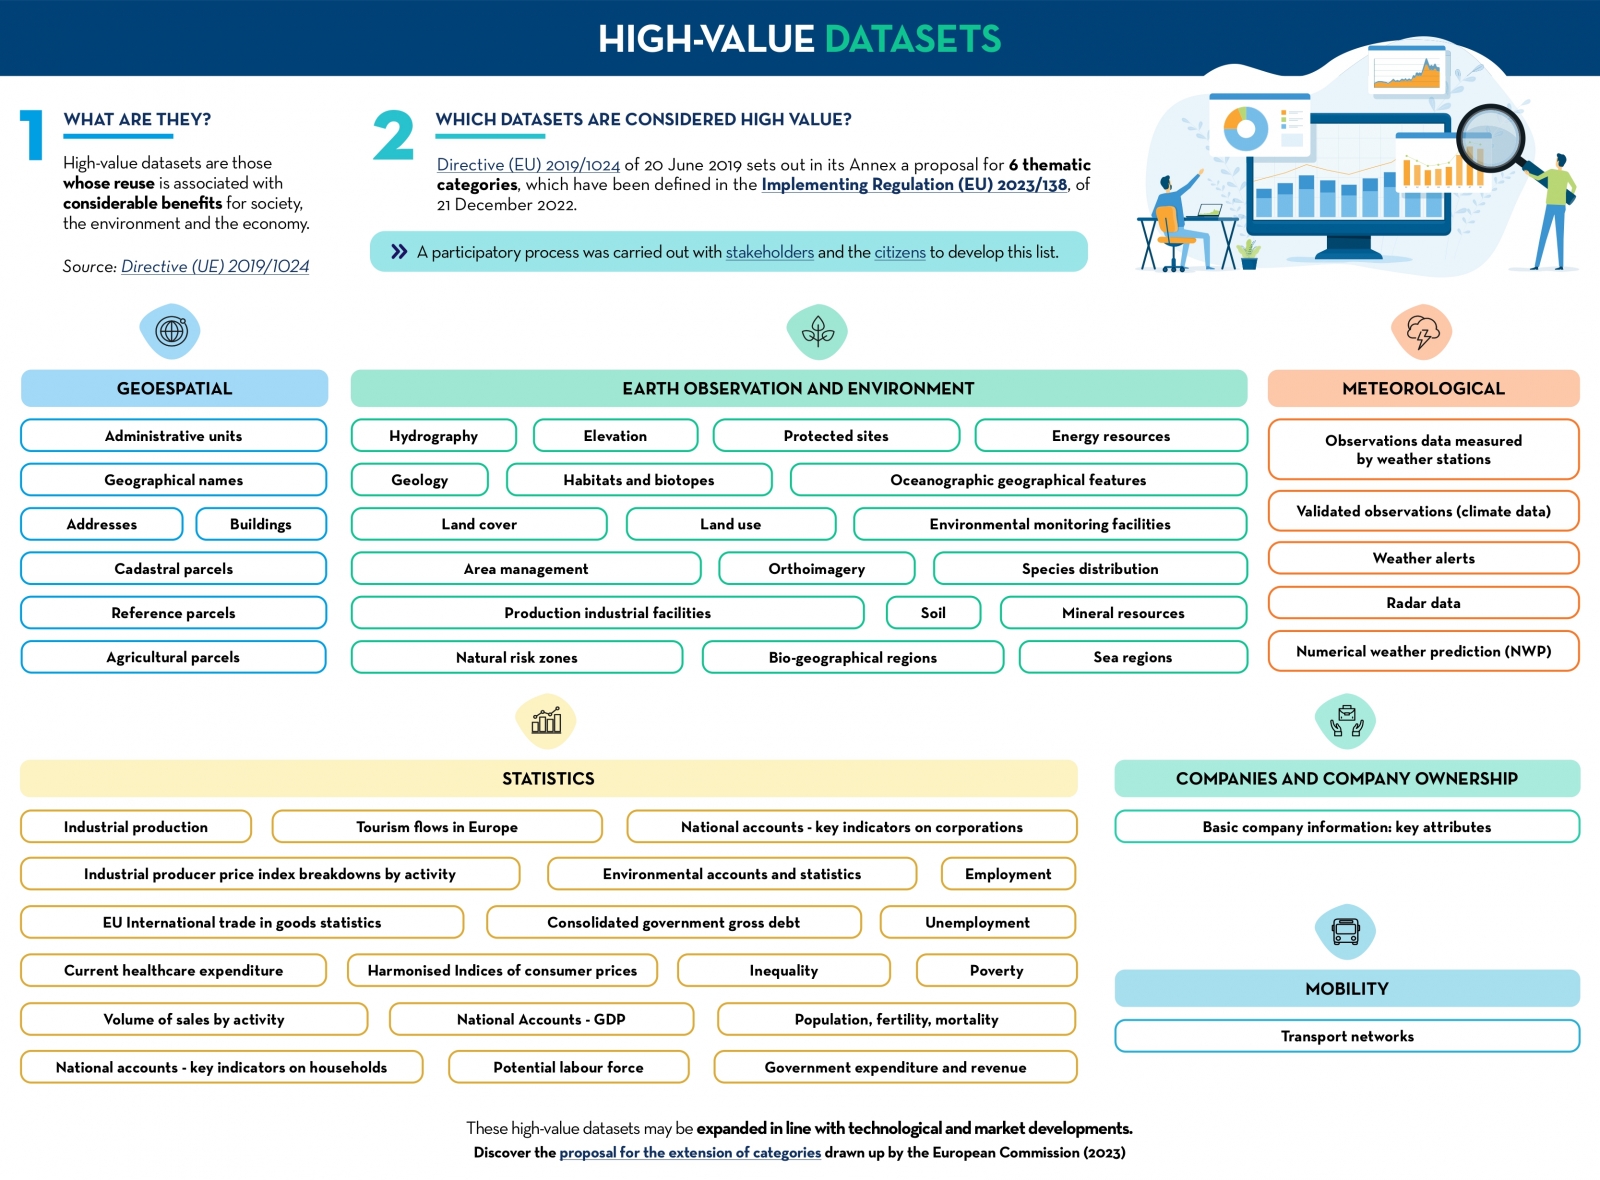 |
Published: March 2024 This infographic shows the high-value data categories defined in Implementing Regulation (EU) 2023/138 of 21 December 2022. Find out what these categories are and how the datasets linked to them should be published. A one-page version has also been created to facilitate printing: click here. |
Gaia-X and European data spaces
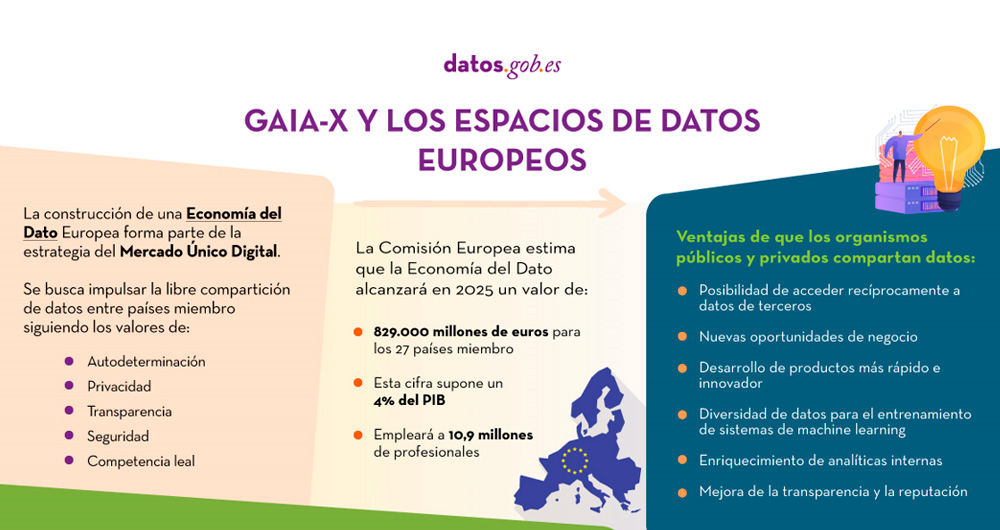 |
Published: April 2022 This infographic shows the context driving the development of data spaces, focusing on some related European initiatives such as Gaia-X and ISDA. |
Trends in open data around the world
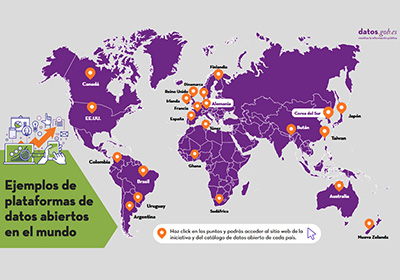 |
Published: Novembre 2021 Through this interactive infographic you can easily access the open data platforms and datasets of several leading countries. The infographic is accompanied by a post which briefly analyzes the strategies and next steps to be taken by these initiatives, showing what are the main trends worldwide. |
The most demanded datasets published by local entities
 |
Published: July 2021 17 local entities, including city councils, provincial councils and an island council, share with the users of datos.gob.es which are their most demanded datasets, among all those published under standards that favour their reuse. The datasets are segmented by thematic categories, highlighting transport, environment and public sector data. |
The Open Government and Public Data Strategies of the Autonomous Communities
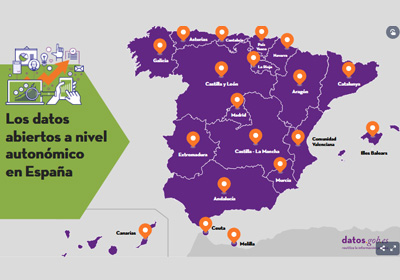 |
Published: June 2021 An interactive map shows the open data initiatives at regional level in Spain, including in each case the url to its portal and the main documents detailing its strategic framework. The infographic is accompanied by an article which addresses the commitments made by each Autonomous Region in the IV Open Government Plan of Spain. |
What are the most demanded datasets?
 |
Published: May 2021 This infographic compiles some 100 datasets published by regional organizations, which are offered in open format according to standards that facilitate their reuse. The datasets are shown divided by thematic categories, highlighting those related to the public sector, the economy, employment and tourism, and the environment. |
The data-related strategies that will mark 2021
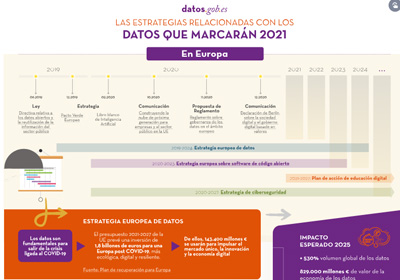 |
Published: January 2021 This interactive infographic shows the strategic, regulatory and political situation affecting the world of open data in Spain and Europe. It includes the main points of the European Data Strategy, the Regulation on Data Governance in Europe or the Spain Digital 2025 plan, among others. |
Documentación
These infographics show examples of the use of open data in certain sectors, as well as data from studies on its impact. New content will be published periodically.
1. Learning with open data: training resources for secondary school students
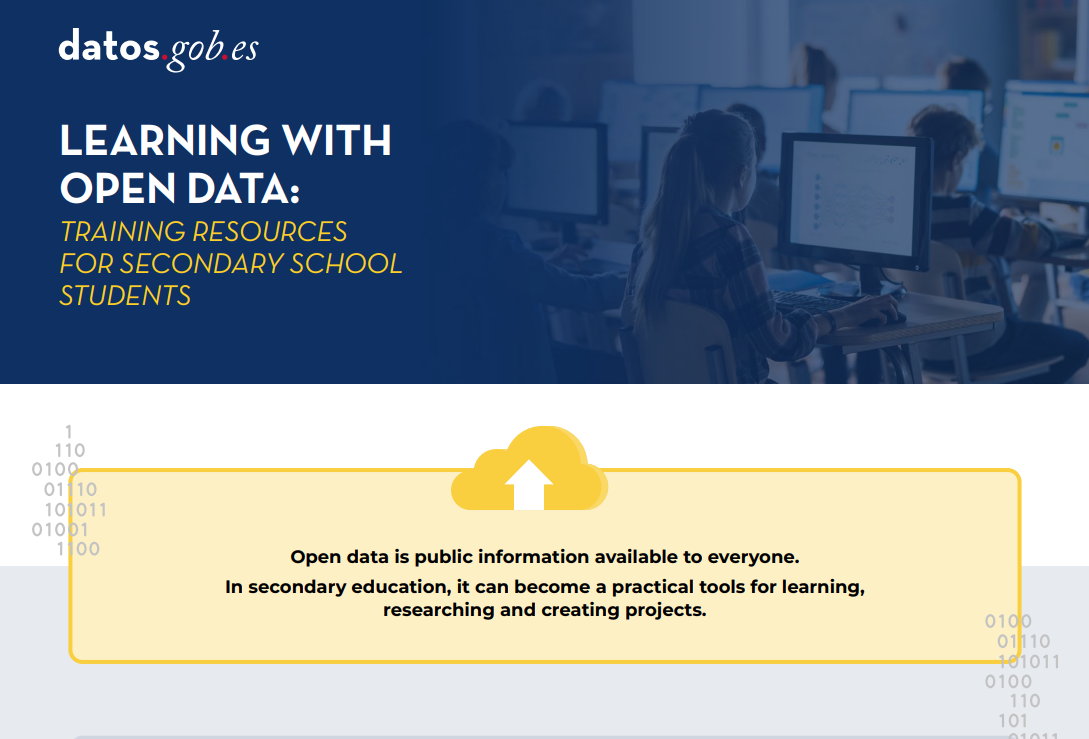 |
Published: November 2025 This compilation of educational resources serves as a guide to learning more about open data and related technologies. Specially designed for students, it compiles tips for harnessing the potential of data sets, videos, and much more. |
2. Open science and citizen science: the combination that transforms research
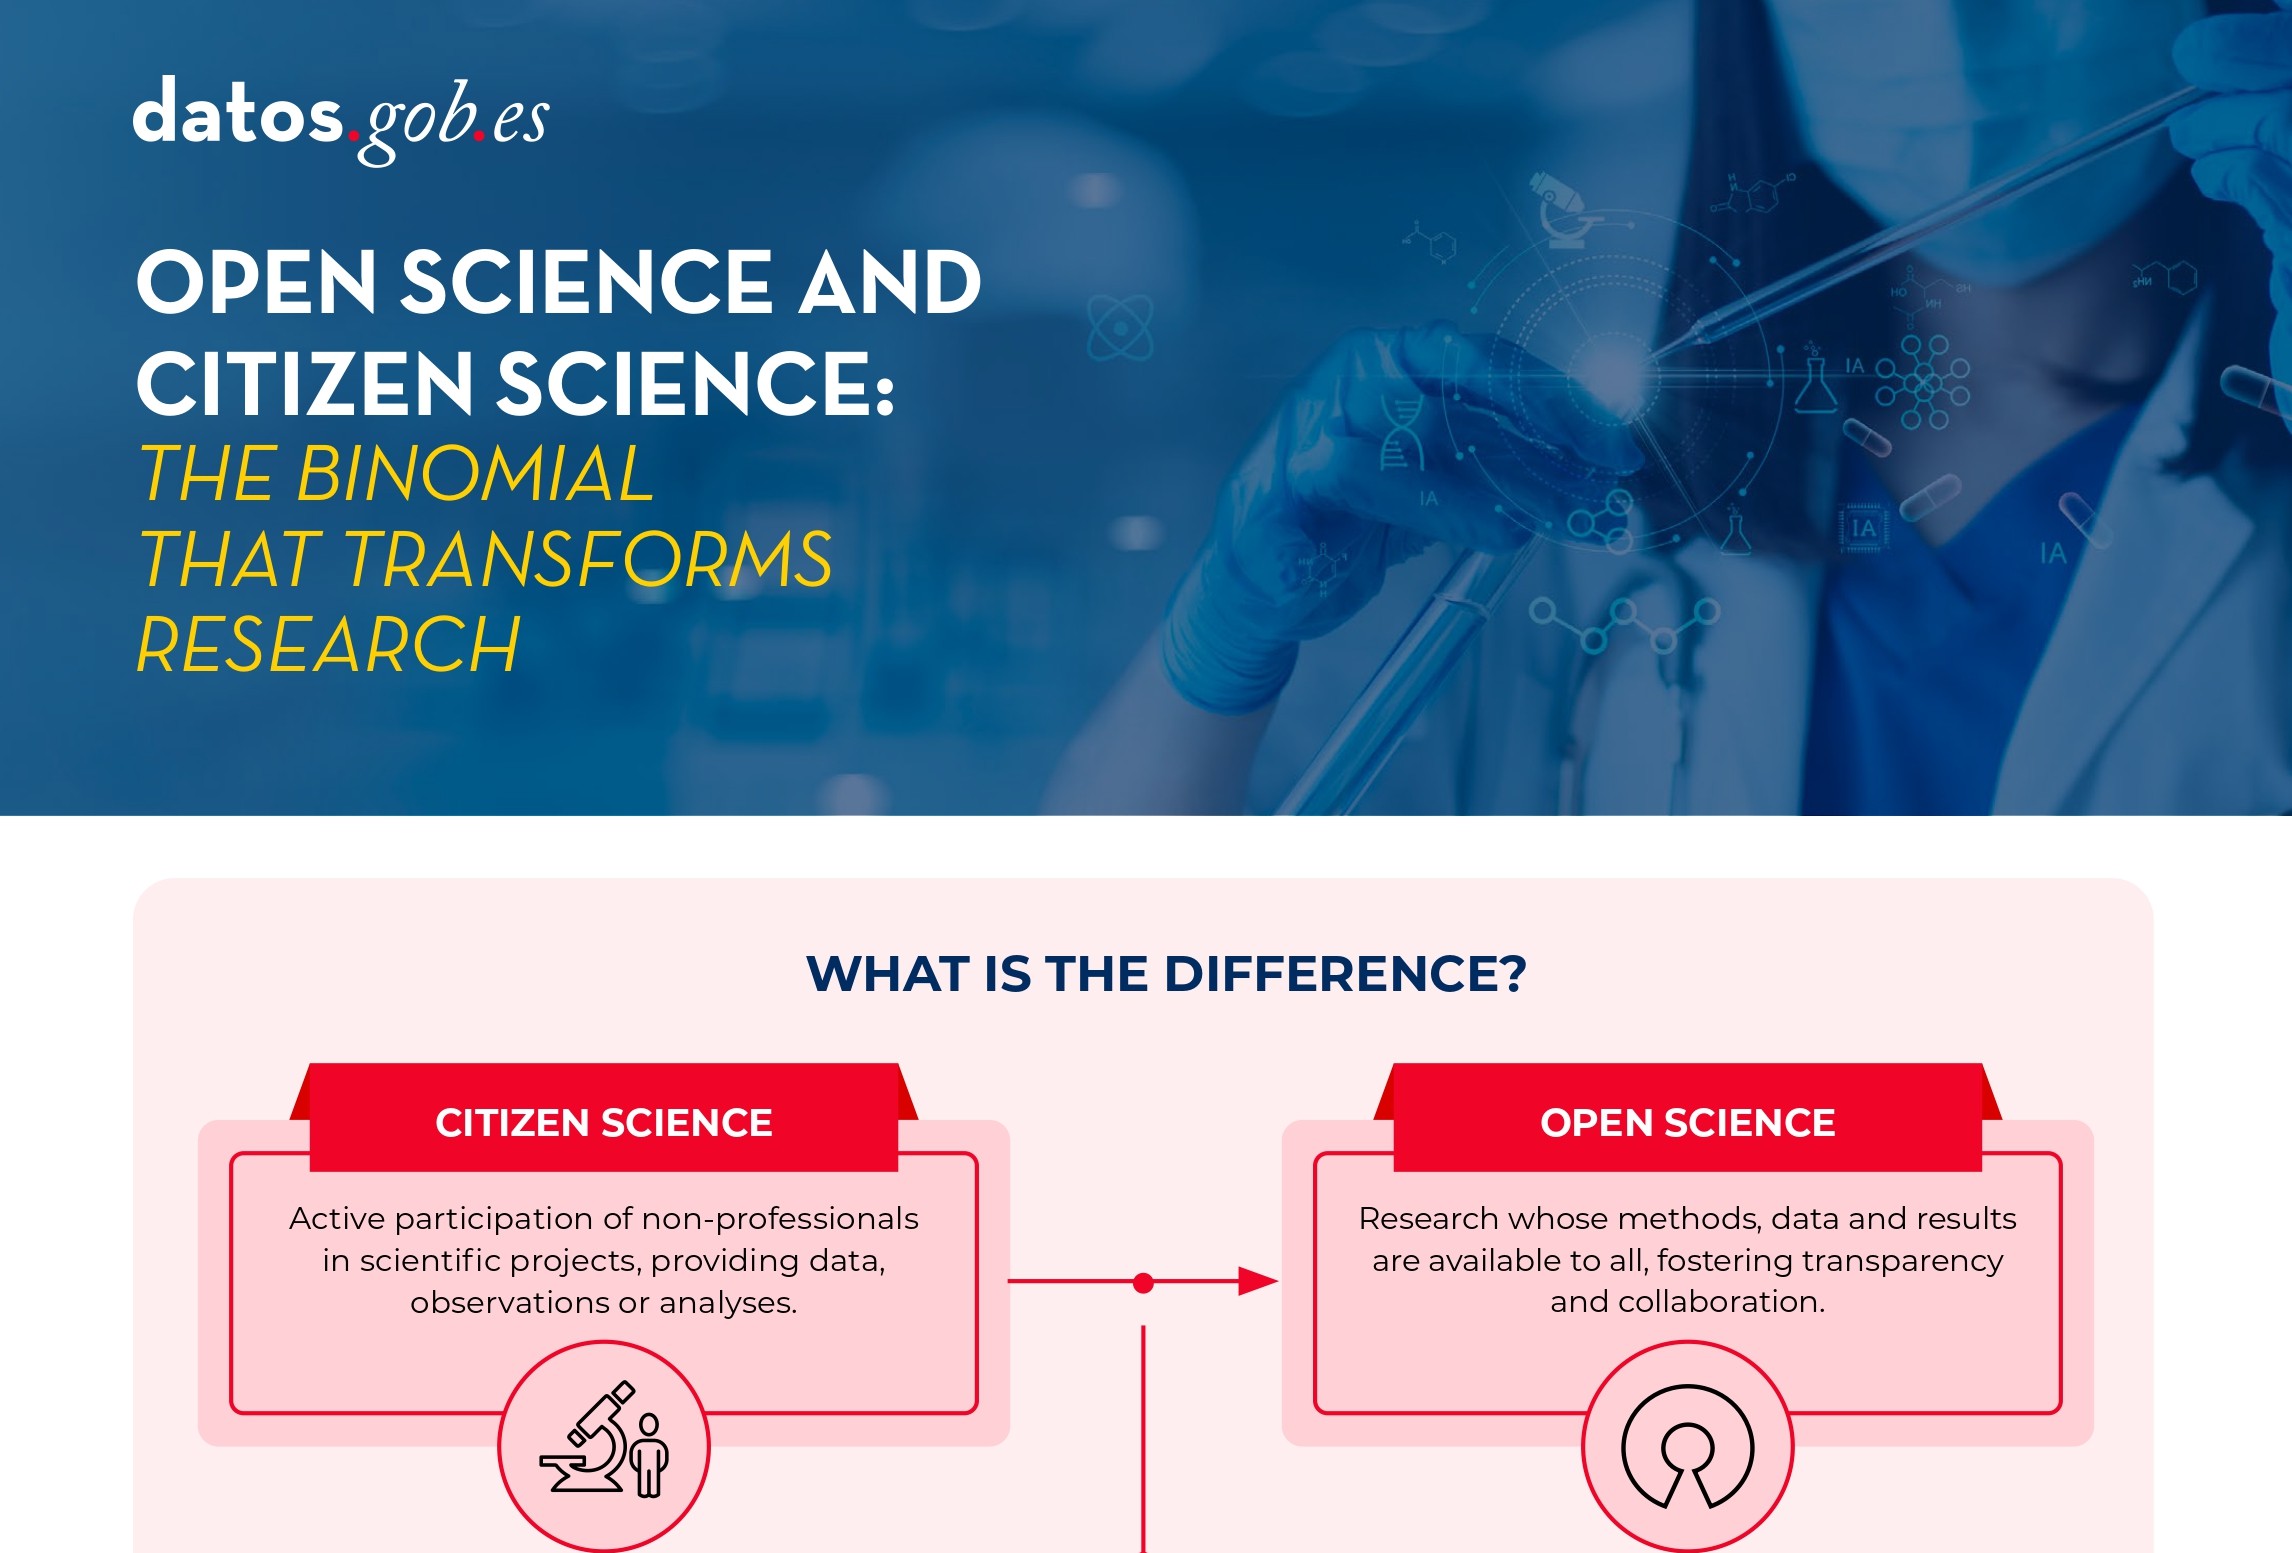 |
Published: July 2025 Planning the publication of open data from the outset of a citizen science project is key to ensuring the quality and interoperability of the data generated, facilitating its reuse, and maximizing the scientific and social impact of the project. |
3. Open Data and Urban Management: Innovative Use Cases
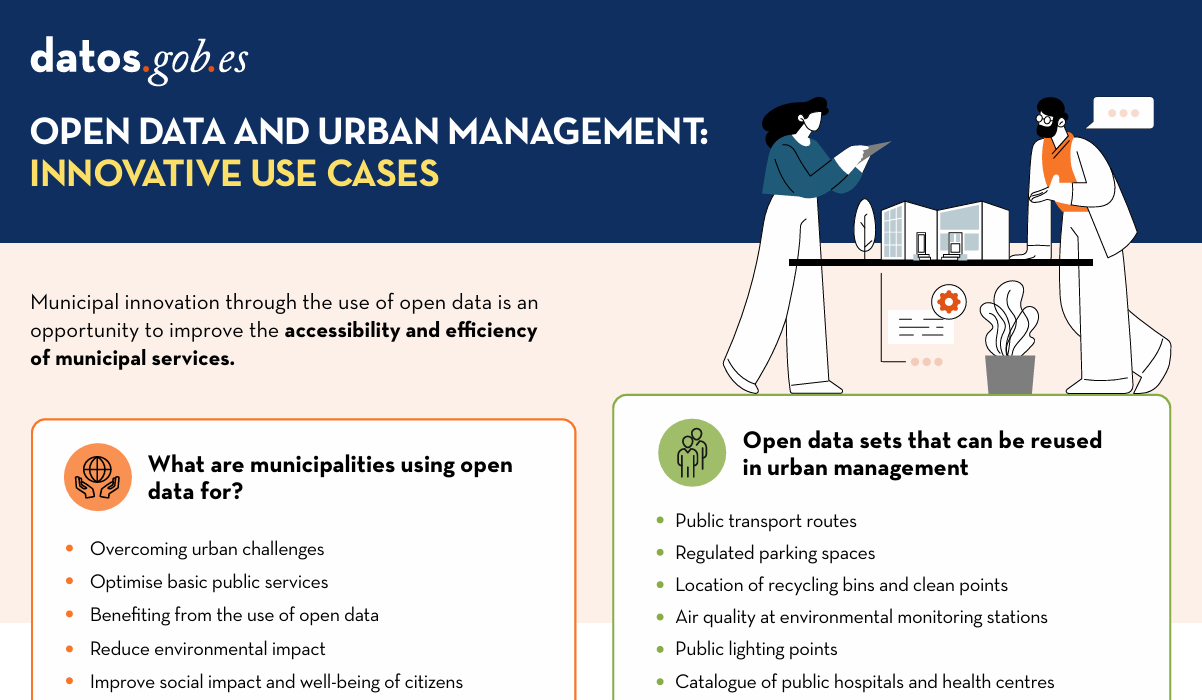 |
Published: July 2024 Municipal innovation through the use of open data presents a significant opportunity to improve the accessibility and efficiency of municipal services. In this infographic, we collect examples of applications that contribute to the improvement of urban sectors such as transport and mobility, organisation of basic public services, environment and sustainability, and citizen services. |
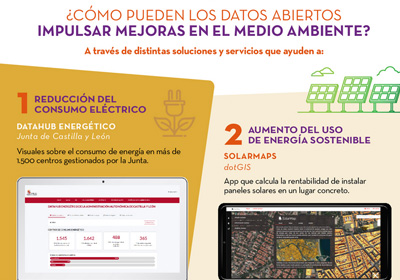
4. Open data for Sustainable City Development
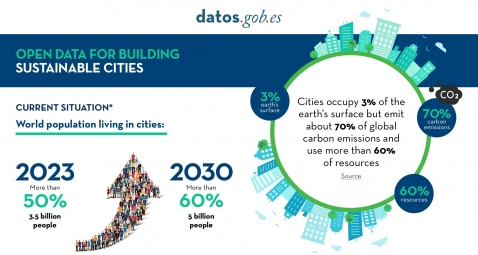 |
Published: August 2023 In this infographic, we have gathered use cases that utilize sets of open data to monitor and/or enhance energy efficiency, transportation and urban mobility, air quality, and noise levels. Issues that contribute to the proper functioning of urban centers. |
5. LegalTech: Transformative potencial of legal services
 |
Published: May 2023 Open data is a key for the strengthening and progress of education and we must no forget thatbsp;education is a universal right and one of the main tools for the progress of humanity. In this infographic we summarize the benefits of utilizing open data in education |
6. LegalTech: Transformative potencial of legal services
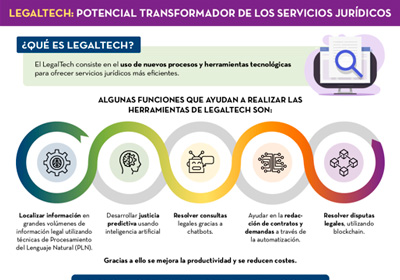 |
Published: August 2022 The LegalTech concept refers to the use of new technological processes and tools to offer more efficient legal services. For all these tools to work properly, it is necessary to have valuable data. In this sense, open data is a great opportunity. Find out more information in this inforgraphic. |
7. How is open data used in the health and welfare sector?
 |
Published: September 2021 Open health data is essential for management and decision making by our governments, but it is also fundamental as a basis for solutions that help both patients and doctors. This infographic shows several examples, both of applications that collect health services and of tools for forecasting and diagnosing diseases, among others. |
8. Open data use cases to care for the environment and fight climate change
 |
Published: November 2020 This interactive infographic shows the strategic, regulatory and political situation affecting the world of open data in Spain and Europe. It includes the main points of the European Data Strategy, the Regulation on Data Governance in Europe or the Spain Digital 2025 plan, among others. |
9. Public administrations faced with the reuse of public information
 |
Published: August 2020 Public administrations play an important role in the open data ecosystem, both as information providers and consumers. This infographic contains a series of examples of success stories and best practices, compiled in the report "Las Administraciones Públicas ante la reutilización de la información pública" by the National Observatory of Telecommunications and the Information Society (ONTSI). |
10. The importance of opening cultural data
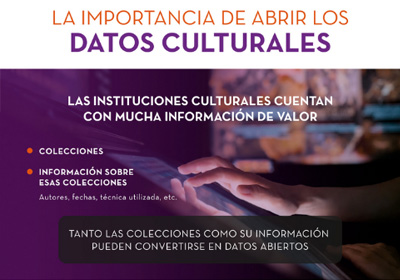 |
Published: June 2020 Did you know that 90% of the world''s cultural heritage has not yet been digitized? Discover in this infographic the benefits of open cultural data, as well as examples of the products that can be created through its reuse, and success stories of museums that share open collections. |
11. Open data, especially valuable for small and medium-sized companies
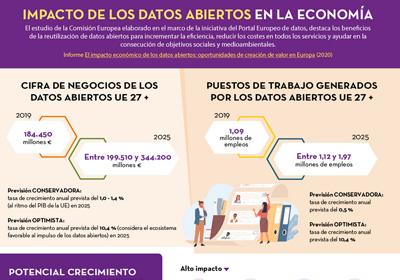 |
Published: March 2020 This infographic shows the results of the study "The Impact of open data: opportunities for value creation in Europe", conducted by the European Data Portal. Find out what the expected annual growth rate is, both in terms of turnover and jobs.(only available in Spanish). |
Documentación
Open data can be the basis for various disruptive technologies, such as Artificial Intelligence, which can lead to improvements in society and the economy. These infographics address both tools for working with data and examples of the use of open data in these new technologies. New content will be published periodically.
Data Scientist's decalogue
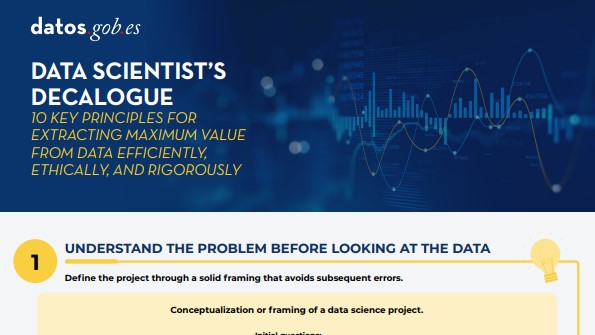 |
Published: octubre 2025 From understanding the problem before looking at the data, to visualizing to communicate and staying up to date, this decalogue offers a comprehensive overview of the life cycle of a responsible and well-structured data project. |
Open data visualization with open source tools
 |
Published: june 2025 This infographic compiles data visualisation tools, the last step of exploratory data analysis. It is the second part of the infographic on open data analysis with open source tools. |
Open data analysis with open source tools
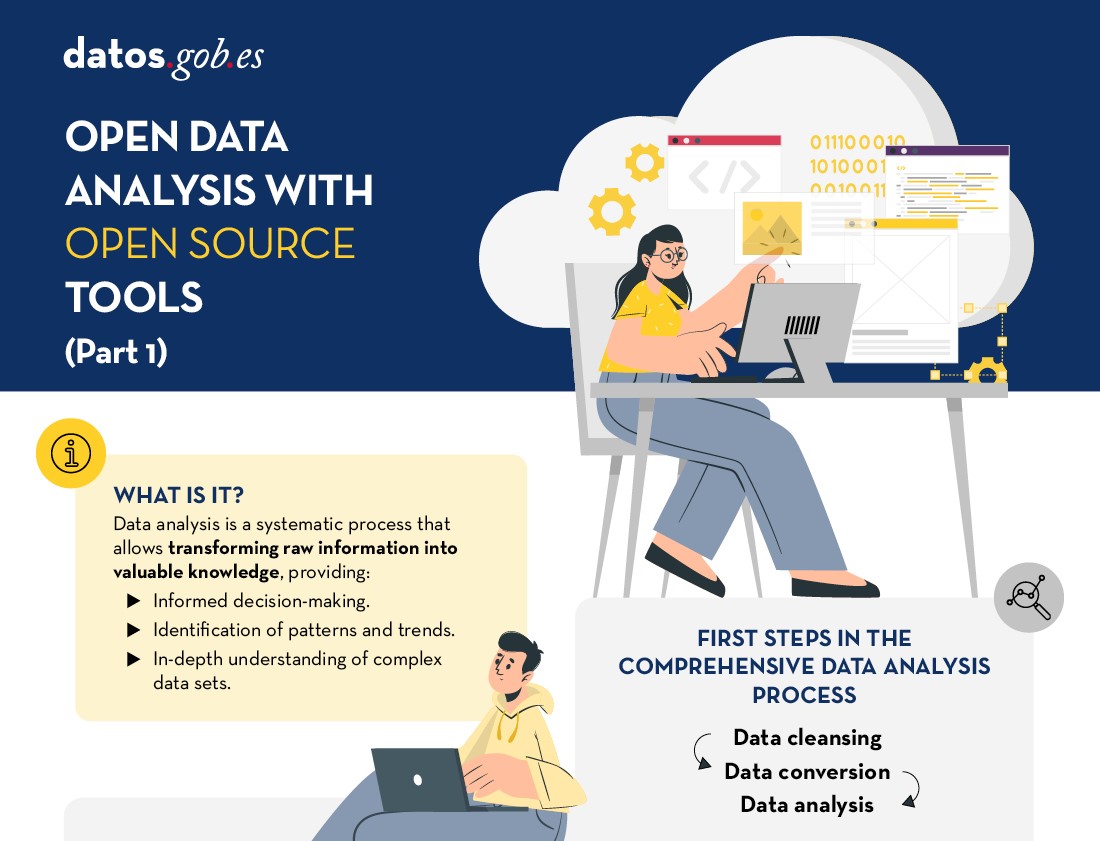 |
Published: March 2025 EDA is the application of a set of statistical techniques aimed at exploring, describing and summarising the nature of data in a way that ensures its objectivity and interoperability. In this infographic, we compile free tools to perform the first three steps of data analysis. |
New geospatial data capture techniques
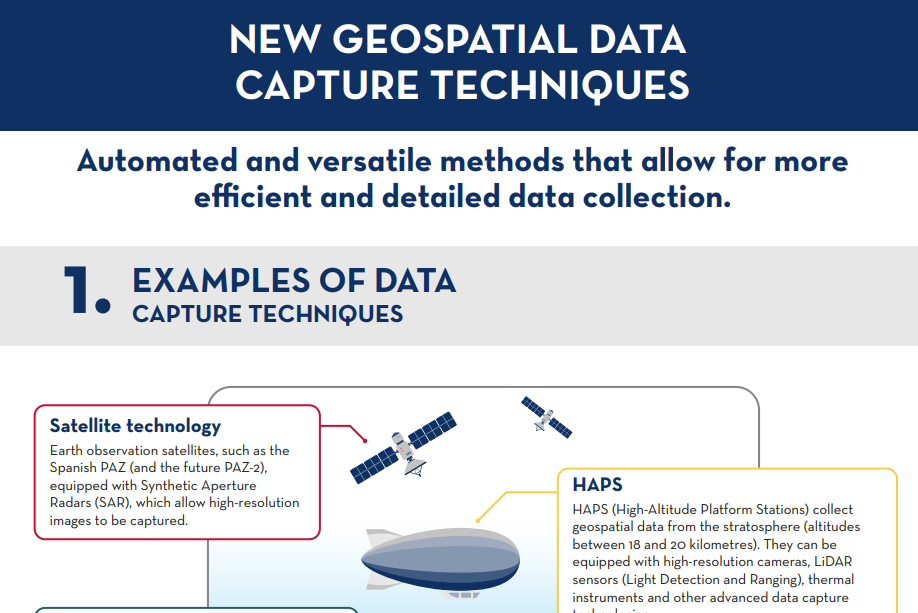 |
Published: January 2025 Geospatial data capture is essential for understanding the environment, making decisions and designing effective policies. In this infographic, we will explore new methods of data capture. |
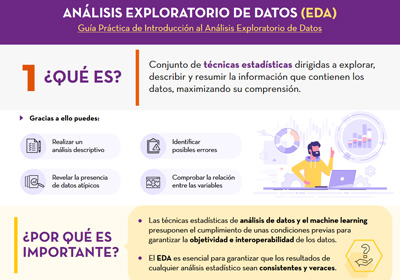
Exploratory Data Analysis (EDA)
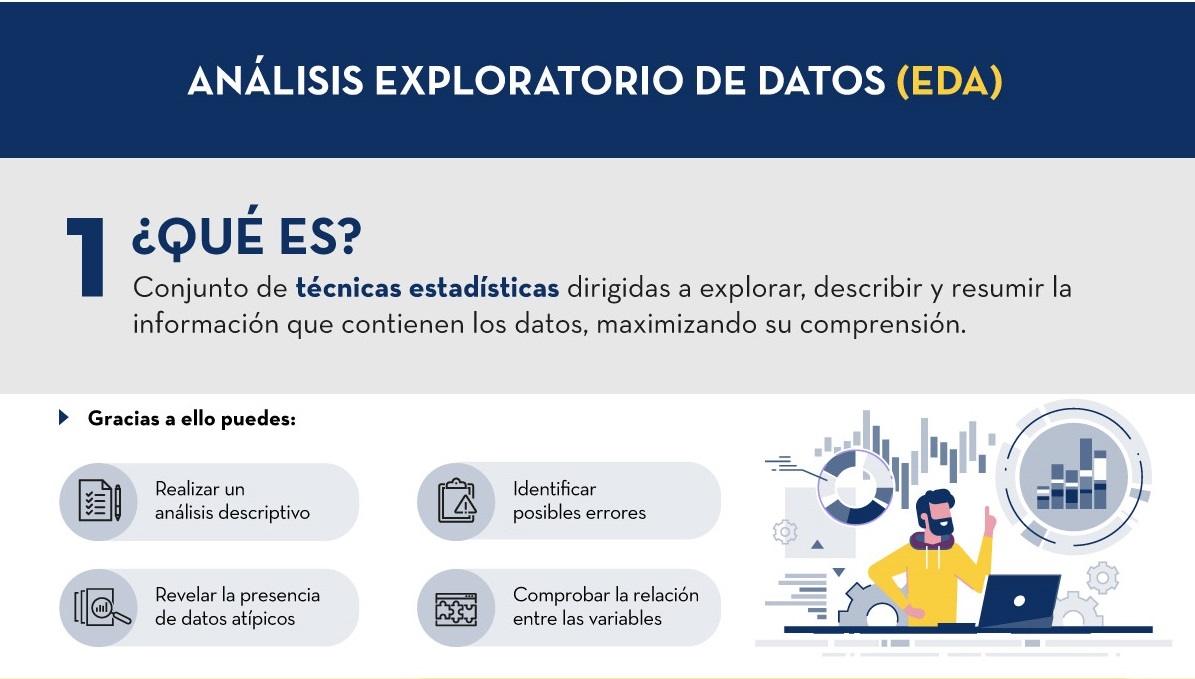 |
Published: November 2024 Based on the report “Guía Práctica de Introducción al Análisis Exploratorio de Datos”, an infographic has been prepared that summarises in a simple way what this technique consists of, its benefits and the steps to follow in order to carry it out correctly. |
Glossary of open data and related new technologies
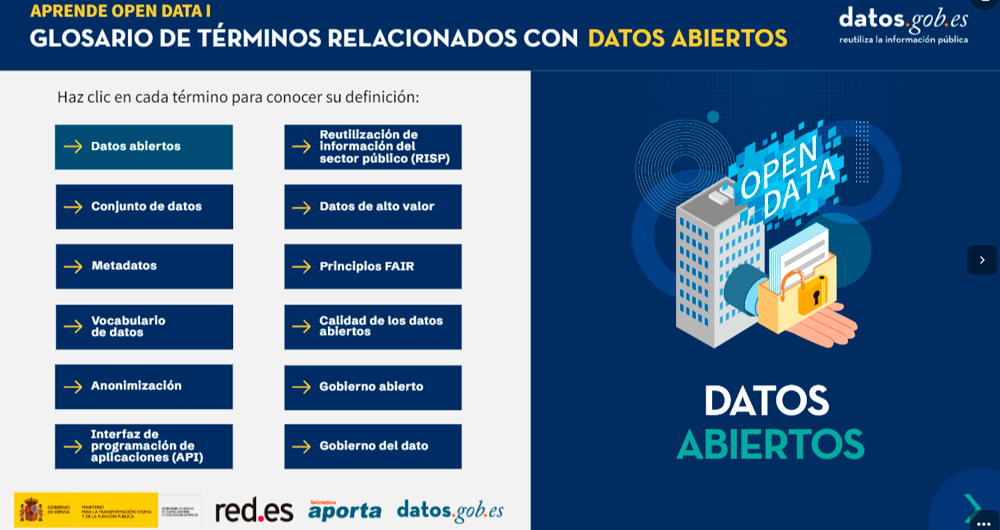 |
Published: April 2024 and May 2024 This page contains two infographics. The first infographic contains the definition of various terms related to open data, while the second focuses on new technologies related to data. |
Synthetic Data (EDA)
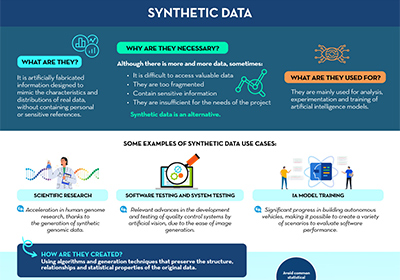 |
Published: October 2023 Based on the report ''Synthetic Data: What are they and what are they used for?'', an infographic has been prepared that summarizes in a simple way the main keys of synthetic data and how they overcome the limitations of real data. |
Exploratory Data Analysis (EDA)
 |
Published: September 2021 Based on the report "A Practical Introductory Guide to Exploratory Data Analysis", an infographic has been prepared that summarizes in a simple way what this technique consists of, its benefits and which are the steps to follow to perform it correctly. |
Emerging Technologies and Open Data: Predictive Analytics
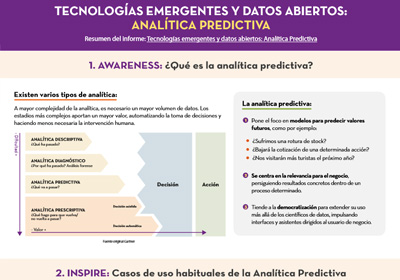 |
Published: April 2021 This infographic is a summary of the report "Emerging Technologies and Open Data: Predictive Analytics", from the "Awareness, Inspire, Action" series. It explains what predictive analytics is and its most common use cases. It also shows a practical example, using the dataset related to traffic accident in the city of Madrid. |
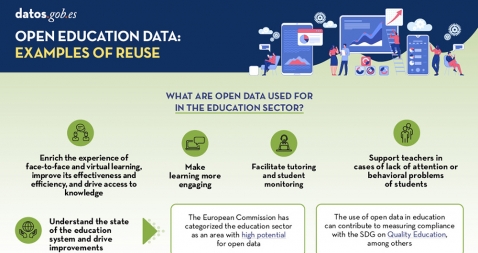
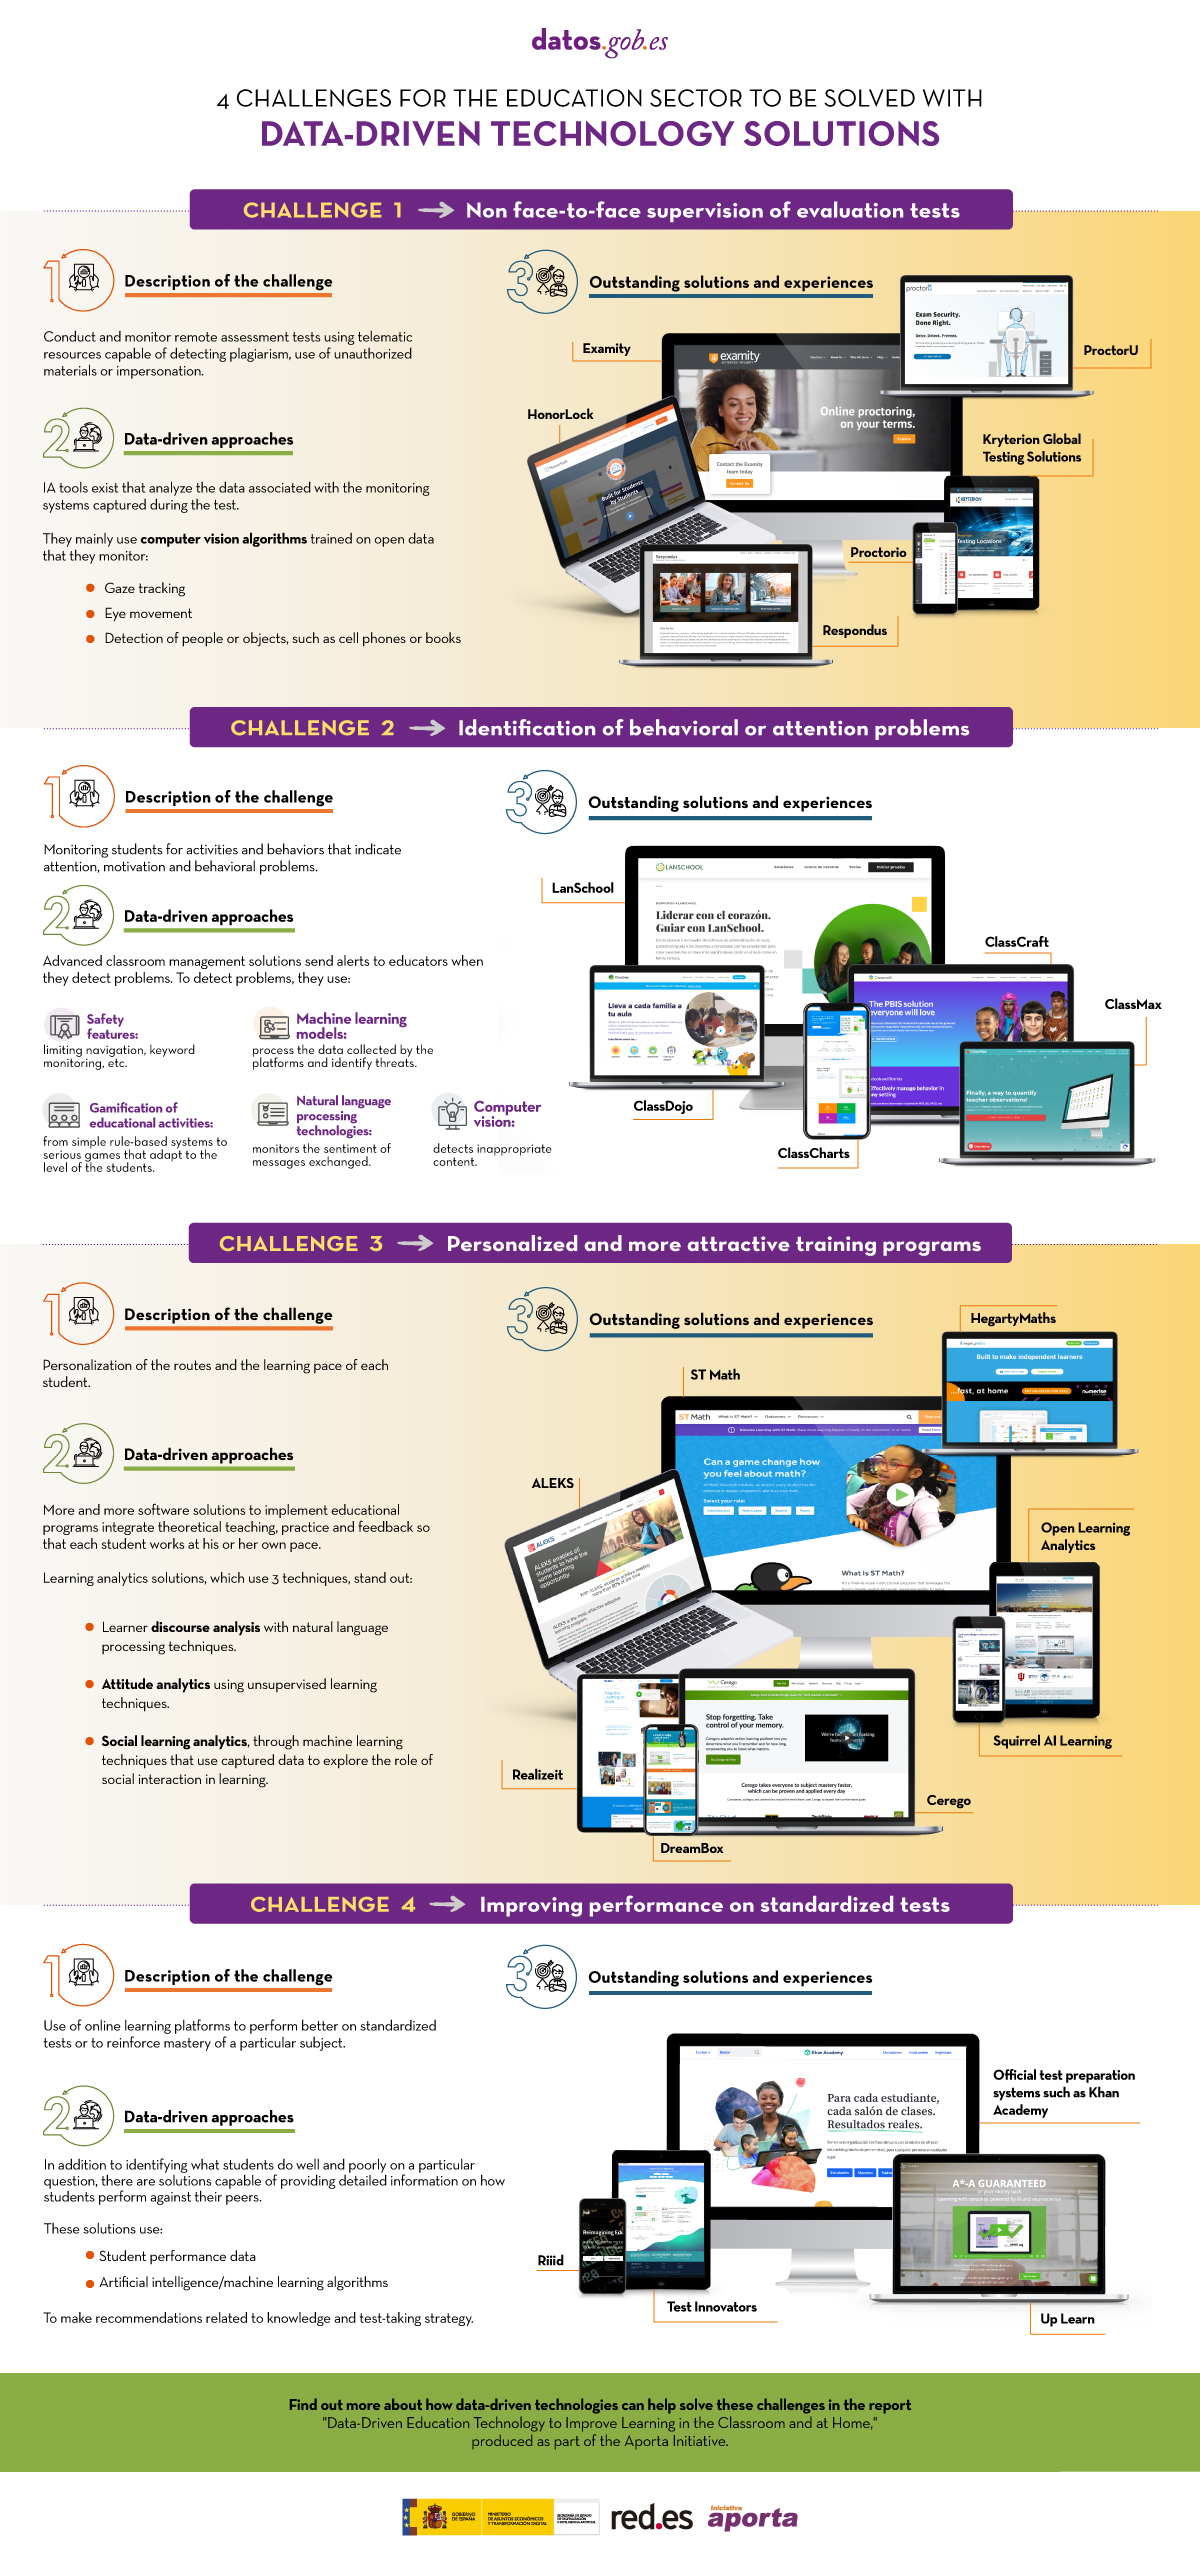
Data-driven education technology to improve learning in the classroom and at home
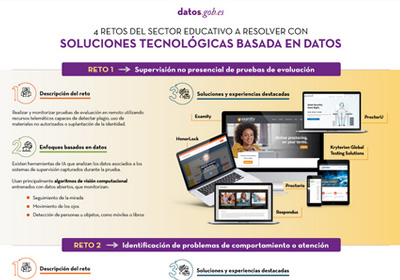 |
Published: August 2020 Innovative educational technology based on data and artificial intelligence can address some of the challenges facing the education system, such as monitoring online assessment tests, identifying behavioral problems, personalized training or improving performance on standardized tests. This infographic, a summary of the report "Data-driven educational technology to improve learning in the classroom and at home", shows some examples. |
Documentación
Thanks to these infographics you can learn a little more about the activity of datos.gob.es and the functionalities of the platform. New contents will be published periodically.
1. What is datos.gob.es?
 |
Published: September 2023 In this infographic, we have summarized the main resources you can find on our platform. Datos.gob.es not only hosts the National Open Data Catalog (with nearly 100,000 data sets and services), but also offers a wealth of content to keep you up to date with the latest news and trends and learn about data. A brochure with further information about datos.gob.es is also available. |
2. Dissemination of the data culture
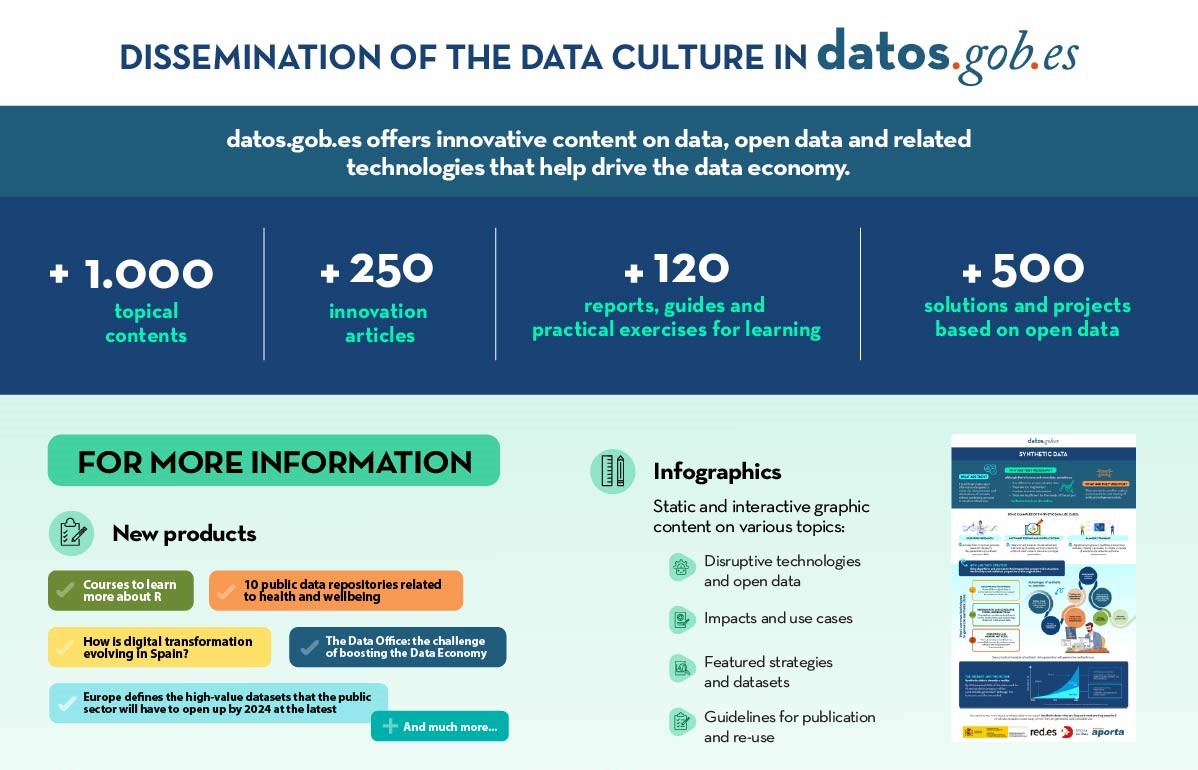 |
Published: January 2023 datos.gob.es offers innovative content on data, open data and related technologies that help drive the data economy. In this infographic you can find out what they are and some impact figures. |
3. About the Aporta initiative
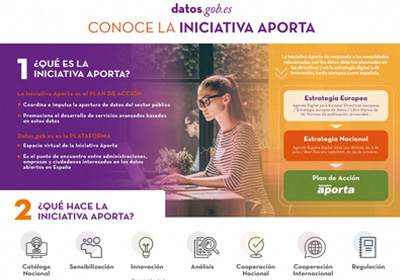 |
Published: October 2020 Do you know the difference between the Aporta Initiative and datos.gob.es? In this infographic we explain it to you. Discover also the seven lines of action of the project and the actors that collaborate with us. |
4. How to publish data in datos.gob.es catalogue?
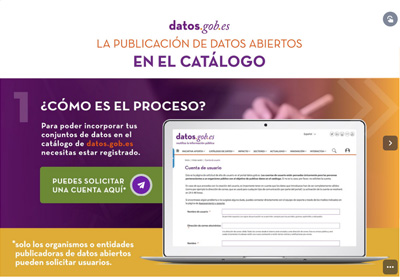 |
Published: July 2020 Publishing organizations have two ways of registering their data in the National Open Data Catalog, hosted in datos.gob.es: federated and manual. This interactive infographic shows both processes in a simple way, as well as the mechanisms used to ensure that the metadata meet the quality standards. |
Documentación
The Aporta Challenges are awards for new ideas and prototypes that, making use of open data, lead to efficiency improvements in a specific sector of activity. In this section you will find infographics with information about the different editions carried out.
I Aporta challenge: The value of the data for the Administration
 |
II Aporta Challenge: The value of data to the agri-food, forestry and rural sector
 |
III Aporta challenge: The value of data in digital education
 |
IV Aporta Challange: The value of data for health and well-being of citizens
Documentación
At the end of each year, at datos.gob.es we take an overview of the activity carried out during the last 365 days. In these infographics you will find a summary of the actions carried out and the achievements. New content will be published periodically.
- Balance of the Aporta Initiative 2025
- Balance of the Aporta Initiative 2024
- Balance of the Aporta Initiative 2023
- Balance of the Aporta Initiative 2022
- Balance of the Aporta Initiative 2021
- Balance of the Aporta Initiative 2020
- Balance of the Aporta Initiative 2019
- Balance of the Aporta Initiative 2018
- Balance of the Aporta Initiative 2017
Blog
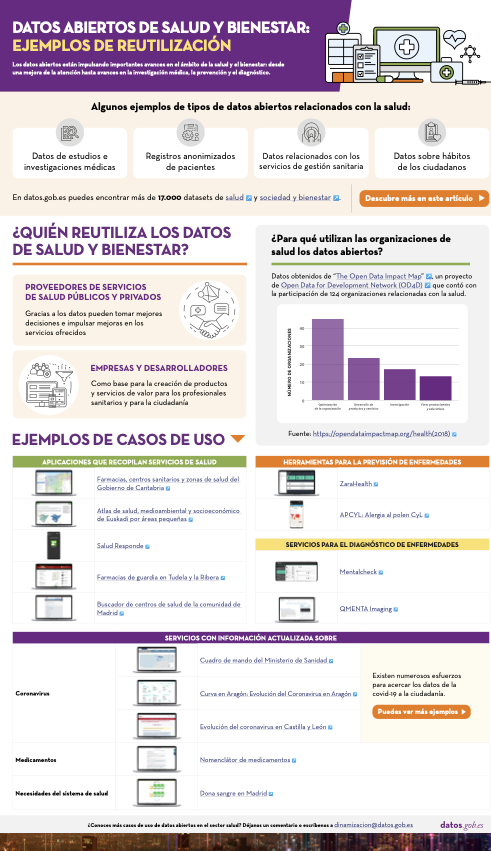
In the last year, we have seen how decisions on health matters have marked the political, social and economic agenda of our country, due to the global pandemic situation resulting from COVID-19. Decisions taken on the basis of public data on cumulative incidence, hospital bed occupancy or vaccination rates have marked our daily lives.
This fact highlights the importance of open health data for the management and decision-making of our governments, but it is also fundamental as a basis for solutions that help both patients and doctors.
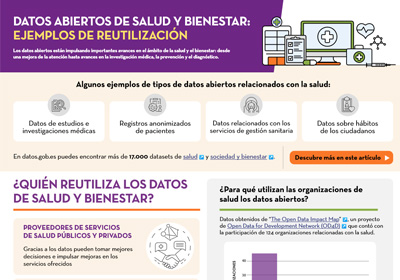
The types of data used in the field of health and wellbeing are numerous: results of medical studies and research, anonymised patient records, data on patients' habits (such as how much exercise we do or how much sleep we get) or data linked to health services and management. All these data are of great value that can be exploited by healthcare professionals, providers and citizens alike.
How have health services been using open data?
According to the study "The Open Data Impact Map", a project of the Open Data for Development Network (OD4D), health-related organisations use open data mainly for the purpose of optimising their management and organisation of resources. Of the 124 organisations interviewed in 2018, only 19 indicated that they use open data for the development of health products and services, and only 13 for research. The same study indicates that the most widely used open data are those directly related to health, and that very few organisations combine them with datasets from other themes - mainly geospatial or demographic or social indicators - to generate deeper and more detailed knowledge.
However, the opportunities in this field are vast, as shown below.
Click here to see the infographic in full size and in its accessible version
Examples of services based on open health data
The situation seems to be changing and there is increasing momentum for the implementation of applications, services or projects based on data in this field. Europe is committed to the creation of data spaces focused on the field of health, as part of its strategy to build a European cloud, while the Spanish government has included the promotion of Digital Health solutions in its Digital Spain 2025 strategy. Among the actions envisaged by our country is the streamlining of information systems to enable better data sharing and interoperability.
Applications that collect health services
When it comes to health apps, the most common are those that help citizens find local healthcare providers that meet their needs. An example is 24-hour pharmacies in Tudela and la Ribera or the search engine for health centres in the community of Madrid. Thanks to these, patients can find out where the centres are located and find out information of interest, such as opening hours. Some applications include additional services, such as Salud Responde, from the Junta de Andalucía, which allows the request and modification of medical appointments, improving the efficiency of the system.
But such services can also provide important information for more efficient resource management, especially when cross-referenced with other datasets. For example, Pharmacies, Health Centres and Health Areas of the Government of Cantabria, developed by Esri, includes information on the territorial organisation of health resources according to geographical, demographic, epidemiological, socio-economic, labour, cultural, climatological and transport factors. Its main objective is not only to facilitate citizens' access to this information, but also to ensure that "the provision of health services is carried out in the best conditions of accessibility, efficiency and quality".
The Health, environmental and socio-economic atlas of the Basque Country by small areas shows a series of maps with the aim of "monitoring geographical inequalities in health, socioeconomic and environmental indicators in the Basque Country, taking into account the gender perspective". This information is very useful for service managers in trying to promote greater equity in access to healthcare.
Disease prevention tools
There are also applications on the market aimed at disease prevention, such as ZaraHealth, a web application that displays real-time data on water quality, air quality and pollen levels in the city of Zaragoza. The user can set a series of thresholds for pollen and pollution levels, so that a warning is issued when they are reached. In this way, they can avoid going outdoors or exercising in areas that do not meet their needs. APCYL: Allergy to pollen CyL has the same goal.
Another important aspect of our health is our diet, a key factor in the prevention of various pathologies such as cardiovascular diseases or diabetes. Websites such as Mils, which offers detailed nutritional information on food, can help us to eat more healthily.
Services for the diagnosis and treatment of diseases
Open data can help assess health outcomes, develop more effective treatments and predict disease outbreaks.
In the field of mental health, for example, we find Mentalcheck, an app that enables psychological assessments and self-reporting via mobile devices. It aims to improve Ecological Momentary Assessment and Intervention (EMA and EMI). The application incorporates open data on medications and mental health services from the US Food and Drug Administration (FDA). It also allows the integration of psychological and physiological data to generate correlations.
Another example is Qmenta, a company focused on analysing brain data, using MRI and related clinical data. In recent months they have also incorporated open data related to COVID-19 in some of their work. Through medical image processing algorithms, they seek to accelerate the development of new therapies for neurological diseases.
Up-to-date information on diseases or system needs
Another area where open data can drive improvements is in the reporting of certain situations. This has become especially important in the context of the global pandemic where citizens demand constant and updated information. In this sense, we find the scorecard of the Ministry of Health at state level and different regional initiatives, such as Curve in Aragon: Evolution of Coronavirus in Aragon, or Evolution of the coronavirus in Castilla y León. These are just a couple of examples, but it should be noted that there are numerous efforts in this area, as the Ministry of Health reports on its website.
It is also important to make information on medicines transparent, both for doctors and patients, by facilitating comparisons. In this regard, the Nomenclature of Medicines shows more than 20,000 medicines marketed in Spain with Social Security coverage, offering information on price, presentation, links to the package leaflet, safety notes and active ingredients, among others.
Finally, it is also important to provide information on resource needs, for example, doctor vacancies or the state of blood reserves.
Data in general has driven important advances in improving health outcomes, from increased access to care to medical research and diagnosis. Open data is a key ingredient that can help further enrich these solutions with new variables. It is therefore essential that more and more health and wellness data will be opened, following a set of guidelines and standards that ensure the privacy and security of patients. In this sense, the report "Open data and health: technological context, stakeholders and legal framework" includes information on what types of data can be opened and what the legal framework says about it.
Do you know more use cases of open data applied to the health and welfare sector? Leave us a comment or write to dinamizacion@datos.gob.es.
Content prepared by the datos.gob.es team.
Noticia
A few weeks ago, we picked up on an article what were the most demanded datasets among all those offered by the Autonomous Communities, and that met certain standards that encouraged their reuse.On this occasion, we would like to focus on local entities. In order to draw up the list, we have taken the same questionnaire as a reference, where they were asked to identify in a simple way sets of data published by their organisation and which, from their point of view, meet the aforementioned characteristics. The Provincial Councils and Municipalities that have collaborated are:
All these organizations share data openly and in formats that facilitate their use by companies, researchers or the general public, through different spaces, accessible in the previous links. Most of the participants are local councils, but there are also two provincial councils. Provincial councils play a very important role in the open data ecosystem, as they promote the opening of data in small town councils, which without them would not be able to carry out these tasks. They are fundamental when it comes to highlighting interesting and useful regional data.
These 17 local entities are just a small sample of the open data ecosystem at the local level in Spain, but the presence in our country of this type of project is much greater. Specifically, in datos.gob.es we have identified 230 local initiatives open data.
Transport, environment and public sector, the most demanded data categories
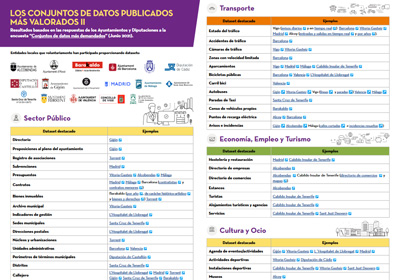
From the responses of the organizations participating in the survey, it is extracted that the most demanded local data sets are the following:
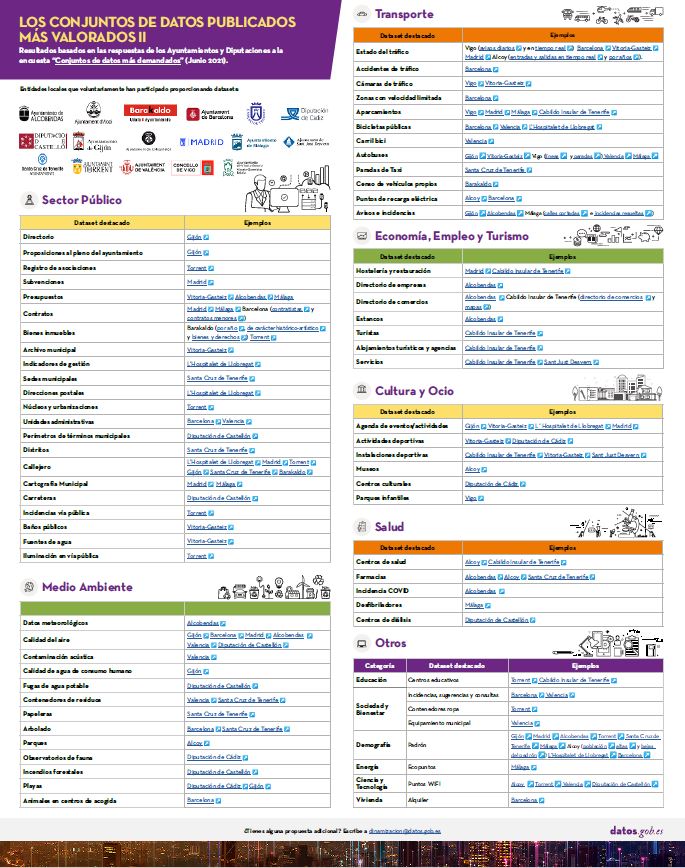
Click here to see the infographic in full size and in its accessible version.
Three categories stand out: transport, environment and public sector data. Three fundamental sectors to achieve efficient and sustainable cities.
In the case of transport data, those related to the state of traffic, parking lots and public services (such as public buses or bicycles) stand out, key to promoting an environmentally friendly transport system, in line with the marked on the "Sustainable and smart mobility strategy". These data are usually provided in real time, facilitating their re-use and helping public administrations, private companies and individuals to manage mobility more efficiently.
The air quality data are the most prominent in the environment section, highlighting the growing concern about pollution in our cities. Do not forget that according to the study Air quality in the Spanish State during 2020, prepared by Ecologists in Action, 42 million people breathed polluted air during the past year (that is, 88.4% of the population), which caused 30,000 premature deaths. Public agencies are increasingly aware of this situation, and carry out air quality assessments on a regular basis, which has led to the installation of more monitoring stations. Spain currently has 616 monitoring stations for official assessment, of which 535 measure NO2 and 475 record information on PM10 levels, generating valuable data for reutlisation and policy decisions.
In the environment category we also find datasets related to garbage management, noise pollution or trees in cities.
Regarding the public sector, we find a large number of datasets related to urban planning and infrastructures, such as the street map, municipal cartography or real estate. Datasets related to the activity of Public Administrations and their transparency, such as contracts, budgets or subsidies, also stand out.
Other prominent categories are the economy, employment and tourism, with datasets such as the Directory of businesses or hotels and restaurants; culture and leisure, where we find datasets on sports facilities or the events agenda; or health, with information on health centers, pharmacies or covid data. Finally, data on education, society and well-being, demography, science and technology, and housing have also been collected.
It should be noted that a large majority of the data sets highlighted by the Town Halls and Provincial Councils are included in the guide. Open data FEMP 2019: 40 datasets to be published by Local Entities, elaborated by the Federation of Municipalities and Provinces of Spain(FEMP). It contains a series of datasets considered priority and that should be published openly by local organizations, as well as instructions to do so in a harmonized way that facilitates interoperability.They also coincide with the vocabularies promoted by the Ciudades Abiertas project. It is, therefore, an opportunity to advance in the standardisation of the way in which data is published.
Why is local open data important?
The possibility of having local data, updated and differentiated by municipalities (or even districts or streets), allows to know the reality of each geographical area in a more concrete way. It allows us to appreciate differences and needs, and based on this, make more accurate decisions that help promote public policies aligned with the demands of citizens.
This data can also be reused, both by the administration itself and by third parties, to launch products that bring public services closer to citizens. This is the case of transport applications, which inform us about the most efficient and fastest way to reach our destination; or apps to recycle, which tell us where the closest waste containers are.
In short, the publication and reuse of open data not only benefits citizens, but also administrations when it comes to performing a more efficient management.
Noticia
The Aporta initiative, in its desire to promote harmonisation and seek synergies between the various publishers of open data in our country, has launched an initiative to find out which datasets are most in demand among those offered in open format according to standards that facilitate their reuse.
To this end, we share a questionnaire and invite different public organisations to identify up to 10 datasets that from their point of view meet the aforementioned characteristics, preferably published on datos.gob.es. In this article we will focus on the responses provided by the Autonomous Communities.
Nine Autonomous Communities took part in the questionnaire:
As can be seen in the links above, all of them have consolidated and sustainable open data portals in place. They have also shown their commitment to the openness and reuse of public data through various strategies and action plans included in the IV Open Government Plan.
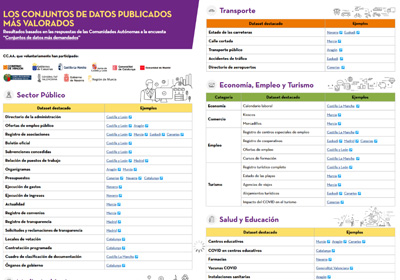
You can see the specific results of the questionnaire in the following infographic:
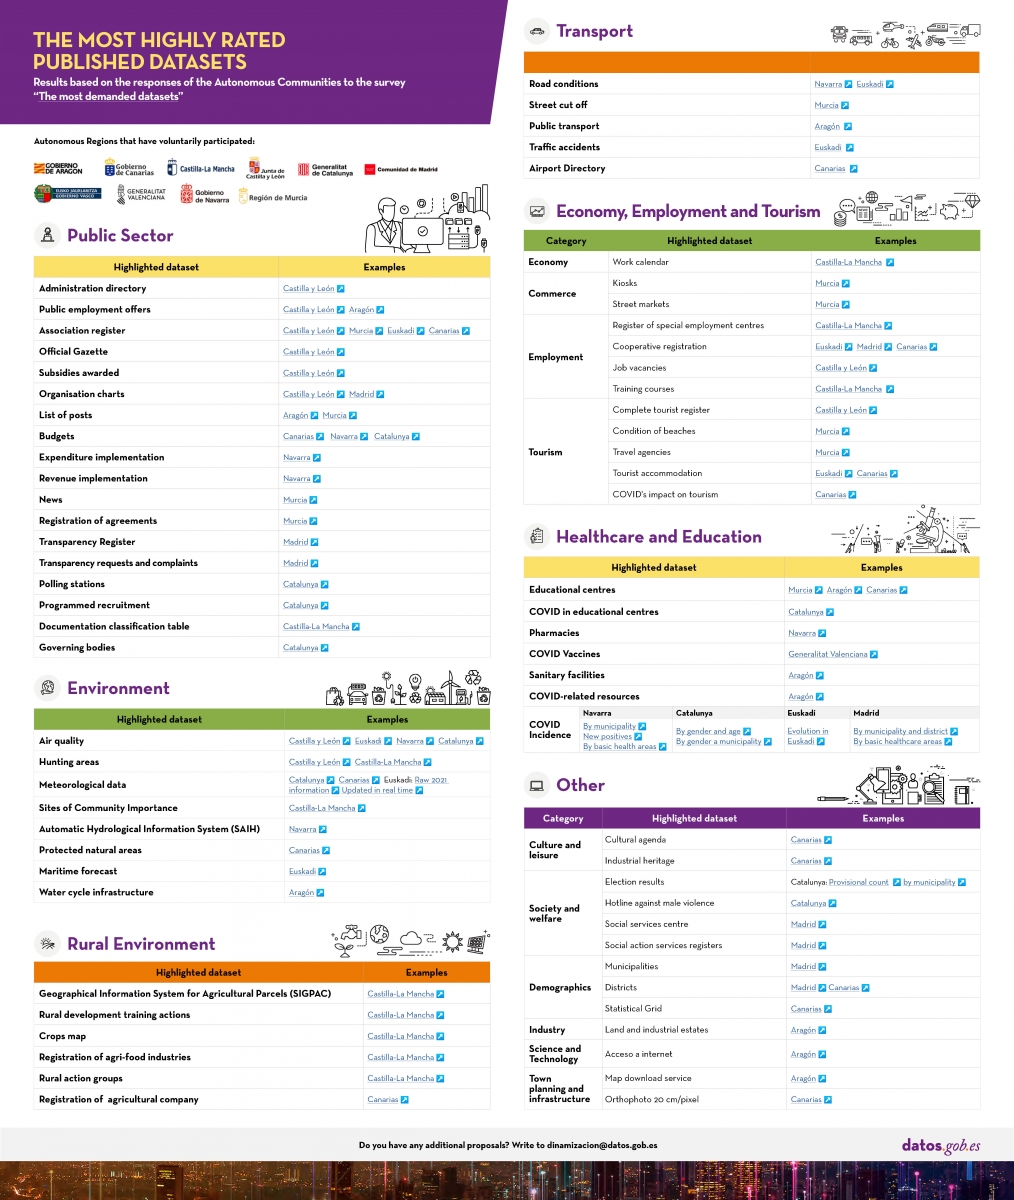
Click here to see the infographic in full size and in its accessible version.
It can be seen that the datasets that stand out as a priority are those related to the public sector: budgets, expenditure, hiring, subsidies or organisation charts showing jobs and roles in the administration, among others. Public employment offers and the official gazette of each community also stand out.
Secondly, environmental datasets, such as weather forecasts or air quality data, which are very necessary when it comes to making predictions that allow us to fight against climate emergencies, stand out. Closely linked to this category we also find rural environment datasets, such as the Geographic Information System for Agricultural Plots (SIGPAC), with information on agricultural plots declared by farmers and livestock farmers and through which farmers and livestock farmers must make applications for aid.
Datasets related to the economy and employment, where we have included fundamental sectors for our country such as commerce or tourism, complete the top 3 most demanded thematic categories. Job offers, training courses, tourist establishments or beach guides are just some of the examples of datasets included in this category.
Transport data, such as road conditions or those related to public transport, also stand out. And those linked to education and health. Given the current global pandemic situation, it is not surprising that the autonomous communities have also highlighted the importance of COVID data, which are essential for decision-making. These data have been among the most in demand in recent months due to the health situation.
It is worth noting that the work carried out by ASEDIE in promoting the opening of the datasets of associations, cooperatives and foundations (an action they have come to call top 3 ASEDIE) has borne fruit, as the majority of the communities participating in the questionnaire have not only opened them, but have also indicated that they consider them to be a priority.
With this questionnaire, we have learned about some of the datasets considered a priority by the Autonomous Communities. The challenge now is to promote their harmonisation, so that the different bodies publish the same information structure in a way that facilitates their interoperability. Whenever possible, access to data should also be facilitated by means of APIs, with priority being given to data provided in real time or with a very high update frequency.
Do you agree with the highlighted datasets? Let us know what you think in the comments.
Documentación
In order to extract the full value of data, it is necessary to classify, filter and cross-reference it through analytics processes that help us draw conclusions, turning data into information and knowledge. Traditionally, data analytics is divided into 3 categories:
- Descriptive analytics, which helps us to understand the current situation, what has happened to get there and why it has happened.
- Predictive analytics, which aims to anticipate relevant events. In other words, it tells us what is going to happen so that a human being can make a decision.
- Prescriptive analytics, which provides information on the best decisions based on a series of future scenarios. In other words, it tells us what to do.
The third report in the "Awareness, Inspire, Action" series focuses on the second stage, Predictive Analytics. It follows the same methodology as the two previous reports on Artificial Intelligence and Natural Language Processing.
Predictive analytics allows us to answer business questions such as: Will we suffer a stockout, will the price of a certain share fall, or will more tourists visit us in the future? Based on this information, companies can define their business strategy, and public bodies can develop policies that respond to the needs of citizens.
After a brief introduction that contextualises the subject matter and explains the methodology, the report, written by Alejandro Alija, is developed as follows:
- Awareness. The Awareness section explains the key concepts, highlighting the three attributes of predictive analytics: the emphasis on prediction, the business relevance of the resulting knowledge and its trend towards democratisation to extend its use beyond specialist users and data scientists. This section also mentions the mathematical models it makes use of and details some of its most important milestones throughout history, such as the Kyoto protocol or its usefulness in detecting customer leakage.
- Inspire. The Inspire section analyses some of the most relevant use cases of predictive analytics today in three very different sectors. It starts with the industrial sector, explaining how predictive maintenance and anomaly detection works. It continues with examples relating to price and demand prediction, in the distribution chain of a supermarket and in the energy sector. Finally, it ends with the health sector and augmented medical imaging diagnostics.
- Action. In the Action section, a concrete use case is developed in a practical way, using real data and technological tools. In this case, the selected dataset is traffic accidents in the city of Madrid, published by the Madrid City Council. Through the methodology shown in the following figure, it is explained in a simple way how to use time series analysis techniques to model and predict the number of accidents in future months.

The report ends with the Last stop section, where courses, books and articles of interest are compiled for those users who want to continue advancing in the subject.
In this video, the author tells you more about the report and predictive analytics (only available in Spanish).
Below, you can download the full report in pdf and word (reusable version), as well as access the code used in the Action example at this link.