Noticia
Since 2014, the European Commission has been monitoring Member States' digital progress through the annual DESI Digital Economy and Society Index. To do so, it analyses four digital performance indicators: human capital, connectivity, digital technology integration and digital public services.
In this year's edition, Spain is in seventh position, improving two places compared to 2021. It has gone from a score of 57.4% to 60.8%, which represents a growth of almost 6% (the EU average has grown by 3% in the same period). This puts Spain ahead of countries such as Germany, France and Italy. At the head of the EU-27 we find Finland, Denmark and the Netherlands.
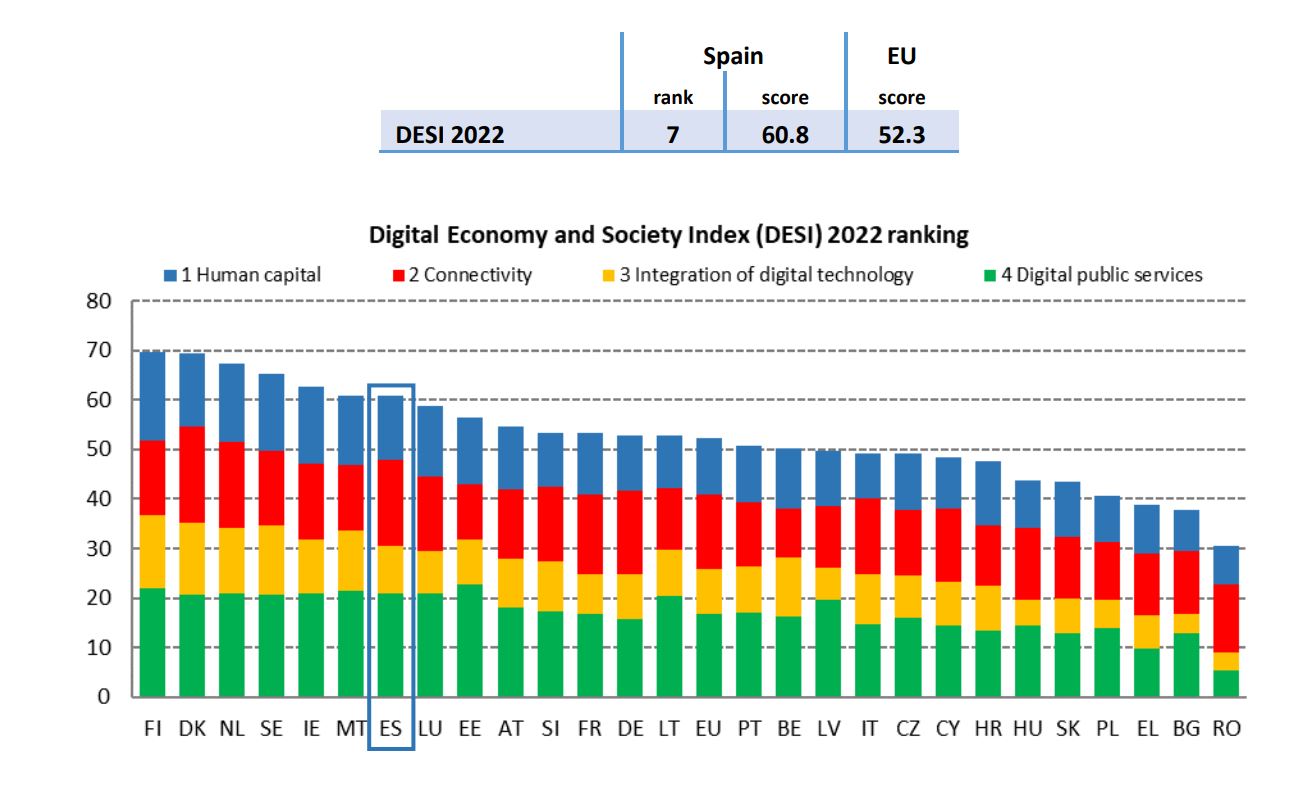
It should be noted that the DESI 2022 index is based mainly on data from 2021. Overall, during the COVID-19 pandemic, Member States have made progress in their digitisation efforts, thanks in part to the opportunity provided by the resources allocated by Europe through the NextGenerationEU recovery plan. However, there are still general challenges, related to digital skills gaps, the digital transformation of SMEs and the deployment of advanced 5G networks.
Digital progress in Spain
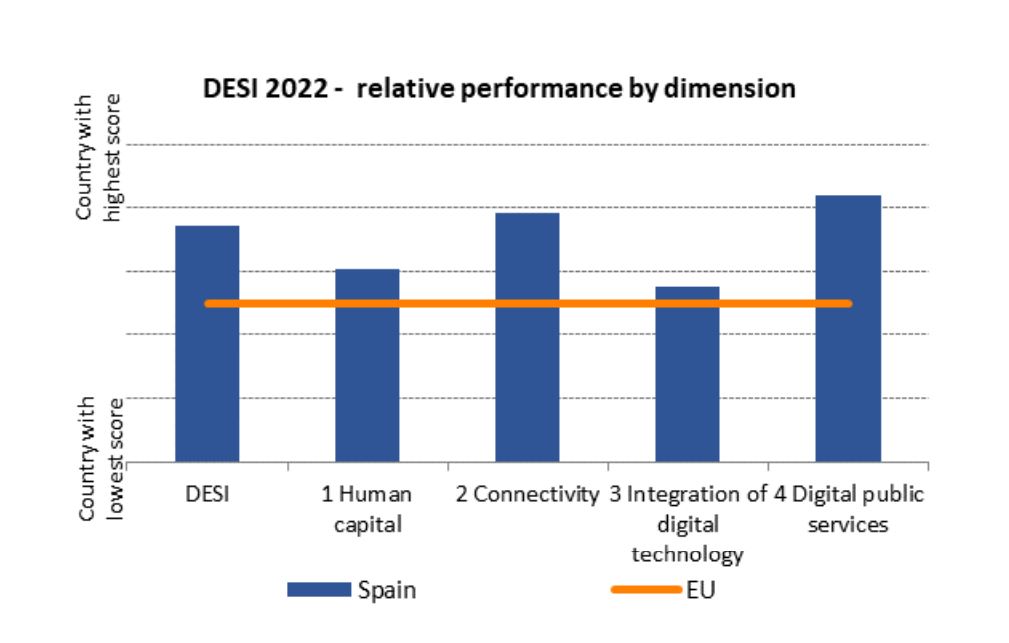
Spain is above the EU average in all four categories analysed:
- Human capital. Spain improves two positions with respect to 2021 and ranks tenth. It stands out mainly in basic digital skills, while it is only below the EU average in the proportion of information and communication technology (ICT) specialists and graduates. The report highlights that several of the measures outlined in the National Recovery and Resilience Plan aim to boost the acquisition of digital skills, especially for SME employees.
-
Connectivity. Spain is one of the EU leaders in terms of connectivity, where it ranks third for the second year in a row. Our country performs particularly well in very high capacity fixed network coverage (94% compared to 70% of the European average), although it still has room for improvement in 5G coverage. In this regard, strategic reforms and investments are being carried out under the National Recovery and Resilience Plan in order to achieve the Digital Decade connectivity targets and reduce the digital divide between urban and rural areas.
-
Digital technology integration. This is the area where most progress has been made, with an improvement of five positions. Spain is currently in eleventh place. It stands out especially in the percentage of SMEs with a basic level of digital intensity and which use social networks, online sales media and electronic information exchange systems. In the use of artificial intelligence, we are at the European average. On the other hand, technologies such as cloud and Big Data analysis are still not widespread. To improve these capabilities, professionals with digital skills are needed, something that will help to boost the SME Digitalisation Plan 2021-2025.
-
Digital public services. Spain, which has traditionally been a pioneer in this field, is in fifth place, two places above 2021. One of the areas where it performs best is in open data, where it is in third place, well above the European average (95% vs. 81%). In addition, the report highlights how our country is proactively developing new services to respond to the needs of citizens in areas such as health, digital identification, cybersecurity, mobile applications and the integration of AI in the sector. Some examples of projects in which Spain is participating are Genome of Europe and European Self Sovereign identity (ESSIF).
If you would like to go deeper into the analysis of the results of Spain and the other European countries in the DESI index, you can download the reports by country on this website. In addition, the Spanish e-Government portal provides users with various useful materials, divided by year.
Women in Digital (WiD) Scoreboard
Together with the DESI index, the EU has also published the 2022 edition of the "Women in Digital (WiD) Scoreboard", a report that assesses the digital development of women and their inclusion in areas such as employment and digital entrepreneurship.
In this ranking, Spain is in eighth position, also exceeding the European Union average (64.2% compared to 54.9%). Spanish women stand out especially in terms of Internet use skills, where they are in fourth position compared to European women.
All these data show how Spain continues to make progress in digital matters. Although there are still areas for improvement, investment from Spain's Recovery and Resilience Plan is expected to continue to drive progress, mainly in areas such as the digitisation of businesses, strengthening the digital skills of the population, improving digital connectivity and the digitisation of public administrations. All of this without neglecting support for digital-related research and development (R&D).
Blog
The Global Data Barometer is a new multi-dimensional study that assesses the potential of data use by public administration in more than 100 countries. It is a tool that thoroughly investigates data policies and practices in their governance, openness and use for the public good.
This new Barometer draws on the previous experience of the Open Data Barometer, which has been widely used to drive policy development, advocacy and academic research. However, it also goes further in its methodology with an in-depth analysis that includes new indicators on data governance, the capacity of governments to manage data, current availability, use and impact of data - as well as a wide range of thematic modules including data on climate change, health, public procurement and others.
In this article we will first briefly review the results obtained by the countries of the regional group of Europe and North America -among which Spain is included- according to the published report and then we will review the data and indicators compiled by the study (in the period between May 2019 and May 2021) to discover which are the elements that their research has considered most outstanding in our country with respect to data governance and the capacities for its management -which are in turn the two modules built on the previous methodology of the Open Data Barometer, and which will give us a better estimate of progress in terms of data openness.
Regional comparison of the report
Spain appears in the top 10 in the results in the analysis of the 27 countries -all of them OGP members and with a high level of democratic and economic development- that are included in the Europe and North America region of the study (extended with some other countries of a similar level of development such as Australia and South Korea). This has even more merit if we take into account that this is, in turn, the best performing of the six regions analysed in the study, and therefore we are also talking about the global leaders.
This group of countries, in general, including Spain, stands out for having historically led the open data movement and the development of standards for the reuse of information from the public sector - which has made it easier for government data to be increasingly used in this region by private sector companies and civil society agents such as journalists.
Spain also stands out from the rest of the countries in the group and at a global level for its high level of development in terms of data management capacities in general, as well as for its regional and local open data policies, where it is a global leader. It also has a strong open data initiative and mature and stable open data policies.
Indicators of data governance in Spain collected for the study
As mentioned above, this section includes some of the elements relating to our country that have been taken into account in the preparation of the report:
- Data protection: the existence of a comprehensive data protection framework is evident throughout the region mainly thanks to the reference of the European General Data Protection Regulation (GDPR). This gives European countries - among which of course Spain is also included with its Organic Act on Personal Data Protection and guarantee of digital rights - a clear leadership position in this matter, incorporating a wide range of rights such as choice, consent, access or rectification - as well as clear responsibilities for database owners.
- Open data policies: our country already has long-standing open data policies that have been expanded and improved over the years - sometimes even ahead of the evolution of EU legislation. The arrival of new policies at European level such as the Open Data Directive and the window of opportunity that will open up when it comes to its implementation may contribute to this improvement continuing and maintaining a high level of demand in the coming years. In Spain there are a number of laws that regulate the basic elements of opening public data, including the Act on Re-use of Public Sector Information (which has recently been amended by Royal Decree-Law 24/2021 transposing the latest European Directive on Open Data and Re-use of Public Sector Information), the Act on Transparency, Access to Public Information and Good Governance and the Legal Regime of the Public Sector. However, there are still some aspects of data sharing between private entities or from other entities to the administration that are not covered by such regulation. There is also another area for improvement regarding the regulation of the use of data by artificial intelligence applications, an issue that will be addressed soon through the European pilot project that is about to start.
- Data management: the National Interoperability Scheme and the resolution approving the Technical Interoperability Standard for the Re-use of Information Resources together form the basis for defining the standards for the management, cataloguing and publication of the administration's data at national level - also including other supporting elements such as quality control guides (and which in the very near future will be extended with an adaptation of the data quality guide published by the European Union).
Indicators of management capacities in Spain
- Training for civil servants: the National Institute of Public Administrations is the body in charge of developing the technical skills of civil servants throughout their careers and offers them an extensive catalogue of courses and conferences that also cover the skills needed to work with data. In addition, as part of the commitments of the Open Government action plan currently in force, there is a specific training plan that includes actions around open data and re-use of information.
- Open data initiatives: Spain has one of the pioneering open data initiatives in the world that started more than 12 years ago through the work of the Aporta Initiative, which promotes the opening of public information and the development of advanced data-based services. datos.gob.es is the virtual platform of this initiative. The initiative's lines of action include the management of the national open data portal and coordination with the rest of the administrations at local, autonomous and state level to promote the open data ecosystem. In this sense, it is also worth highlighting the Data Office, whose mission is to address the main challenges that exist today in the Data Economy, defining the legal and political frameworks for data sharing and governance. The Data Office emerges as an umbrella for various data openness and data sharing initiatives, encouraging the public and private sectors to collaborate in trust to help the expansion of the data society and the growth of the data economy.
- Support for reuse: by virtue of the existing agreement between Red.es and the General State Administration, different actions are carried out to promote the opening of information and the reuse of public sector information in Spain, including informative sessions, meetings and thematic conferences, seminars and competitions -also offering advice and direct support to public bodies and entities regarding the technical and methodological aspects of the publication and reuse of data. In addition, the national data catalogue platform also provides a series of guides, examples of the use of government data and other useful information on re-use.
- Data at local and regional level: there are a large number of open data initiatives at both regional and local level that are very active through their direct participation and commitments in international groups such as the Open Government Partnership or the Open Data Charter or in collaboration with the national private sector - in addition to collaborating with each other in defining strategies and common learning through associations such as the Spanish Federation of Municipalities and Provinces, the Spanish Network of Smart Cities or the Institute for Knowledge Transfer in Public Innovation. All the Autonomous Communities also have their own regulations on transparency, open government and open data, as well as their own data catalogues, which in turn can be integrated into the national catalogue.
Thus, with all of the above we can see how after the years that have passed since the last available report of the Open Data Barometer, this new study reveals how Spain continues to maintain its privileged position among the leaders in open data not only at European but also at international level. However, and according to the results of this new Barometer, some actions should be taken into account in order to maintain this position in the future, such as the need to continue investing in the training of civil servants working with data and supporting re-use activities - while continuing to increase the availability of data and redouble efforts to improve its quality, interoperability and ease of use and re-use.
Content prepared by Carlos Iglesias, Open data Researcher and consultant, World Wide Web Foundation.
The contents and views expressed in this publication are the sole responsibility of the author.
Noticia
What role can data portals play in the context of the data spaces identified in the European Data Strategy? This is the question posed by the European Commission, through its open data initiative 'data.europa.eu', and which serves as the starting point for the report "data.europa.eu and the European common data spaces".
Data.europa.eu and the Common European Data Spaces: Report Methodology
"data.europa.eu and the European common data spaces" is the first of two reports analysing the role that data.europa.eu could play in the context of the emerging European Union common data spaces envisaged in the European Data Strategy. It should be noted that part of this strategy is the development of interoperable common European data spaces across different sectors, an initiative that is still in the process of consolidation.
The objective of the report is twofold. On the one hand, it seeks to identify open data holders who are involved in ongoing implementations of data spaces. On the other hand, it offers a reflection on the role that open data portals could play in these implementations, especially the European portal.
To carry out the development of this first report, its authors (Óscar Corcho and Elena Simperl), conducted an in-depth analysis of the existing official documentation on the European Data Strategy, as well as reviewing online resources and use cases of initiatives such as IDSA, Gaia-X or Open DEI.
Simultaneously, they conducted interviews with developers of data architectures and data spaces. As full implementations do not yet exist, the analysis was based on use cases, work in progress and roadmaps, rather than on operational data spaces.
Main findings of the report
Although this is only the first of two studies, the authors have been able to highlight several far-reaching conclusions:
- Open data is commonly mentioned alongside private and personal data as a type of data source. However, open data owners are often not involved in initiatives to develop reference data space architectures or their implementations. This situation needs to change by ensuring their involvement.
- Open data holders have extensive experience in data publishing, metadata management, quality indicators, dataset discovery and federation, as well as in technologies and standards such as DCAT. However, there is very little transfer of knowledge and technologies from the open data community to the data space community.
- The use of data from multiple sources requires interoperability at various levels. The need for data intermediaries acting as neutral brokers to ensure interoperability is an under-explored issue in the context of data spaces. Public administrations, building on their experience in data publishing, are best placed to take on this role.
The second report - to be published once the data space implementations are available in 2023 - will explore three data space scenarios, with data.europa.eu as data holder or data broker. In addition, it will analyse in detail the challenges and opportunities for the European portal in the context of these developments.
A webinar to further explore the role of the European Data Portal in data spaces
The concept of "data space" arises from the need to provide as much openness of information as possible, while recognising that some data should not be completely open. As a result of this dichotomy, the idea of creating a community of participants who share and use data on the basis of pre-established rules, guaranteeing an environment of sovereignty and trust, was born.
Ideas such as these prompted a webinar on open data and how it fits into broader data space ecosystems to be held on 4 May in the framework of the data.europa.academy. During this session in English, which you can access via this link, some key points of the report's analysis were explored in more detail. In addition to the recording of the session, you can view and download for free the PDF presentation that was used as a guide for the webinar.
Next steps
Ultimately, data spaces belong to an emerging field that still has some biases and limitations. Open government data sources, portals and their practitioners are not as well represented as they could be, even in sectors where they play a key role, such as mobility or smart cities. This needs to change.
The future of the research conducted in this report is to await the publication of the aforementioned second report, which will become effective once more developed European common data spaces are available and the work on reference resources has been completed by IDSA and Gaia-X. These forthcoming actions will allow the formulation of more specific recommendations that can be based on the characteristics of the actual data spaces in operation.
Empresa reutilizadora
KSNET (Knowledge Sharing Network S.L) is a company dedicated to the transfer of knowledge that aims to improve programmes and policies with both a social and economic impact. That is why they accompany their clients throughout the process of creating these programmes, from the diagnosis, design and implementation phase to the evaluation of the results and impact achieved, also providing a vision of the future based on proposals for improvement.
Noticia
ASEDIE (the Multisectoral Information Association) has just published a new edition of its Infomediary Sector Report, which analyses the real, economic and social value of companies reusing data from the public and/or private sector to develop value-added products. The presentation took place at an event at the National Geographic Institute, in which the Data Office also participated.
This year is special because the report is in its 10th edition. Throughout these years, the different reports have shown the growth and consolidation of the sector. Specifically, for this edition, 701 companies have been identified, which represents a growth of 58% compared to the first report, produced in 2013. However, the figure is very similar to that already analysed in 2021.
This year's edition is subtitled "Data Economy in the Infomediary". The data economy already plays a major role in European production ecosystems and is expected to continue to grow: by 2025, it is estimated that it will contribute 4% of GDP.
In this context, ASEDIE has set among its objectives not only to promote the infomediary sector and the Data Economy, but also to contribute to raising public awareness of its benefits. To this end, it has prepared this report with various indicators that show the impact of the sector.
Main findings of the report
Below is a breakdown of the main conclusions drawn from the report:
- The 10th edition of the report shows a turnover of more than €2 billion, offering employment to almost 23,000 professionals.
- 44% of the infomediary companies surveyed use AI to create value-added products or as a tool. 72% of respondents claim to use both public and private data for the creation of their products and/or services. On the other hand, 17% of the companies indicate that they only use private information compared to 11% that only use public data.
- There are 3 sectors that continue to account for most of the activity, with geographic information standing out. The majority of infomediaries specialise in "geographic information" (24%), "market research" (20%) and the "economic and financial" sub-sector (19%).
- Only two of the subsectors account for almost half of total sales (49%): "Geographic information" and "Economic and financial". However, "Publishing", despite being the 6th sector in terms of number of companies, is the one with the highest average sales (€6M) and median (€917,000). Regarding the latter, it practically doubles the next most important sector ("Directoriales"), which has a value of around €503,000, well above the rest of the sectors.
- Most of the companies are located in the Community of Madrid (38%), Catalonia (13%) and Andalusia (11%). As in previous years, the Infomediary Sector is represented in all the Autonomous Communities.
- 71% of the infomediary companies have been created less than 20 years ago. Of these, 36% are between 11 and 20 years old and 35% are less than 10 years old. The average age continues to be 16 years, with the Publishing subsector being the oldest and the Tourism subsector the youngest.
- The average number of employees per company in the Infomediary Sector is 43, reaching 22,638 employees. As in turnover, the subsector with the highest figure is "geographic information" with 30% of the total.
- The aggregate subscribed capital reached 273,789,439 €, which represents a decrease of 12.2% with respect to the previous edition. Furthermore, the three most capitalised subsectors are "market research", "economic and financial" and "geographic information".
- The net profit generated this year exceeds 110 million euros, which represents a slight decrease compared to the previous year. "Culture" and "Directories" were the only two sub-sectors whose companies did not make a positive profit this year.
- The report identifies the opening of new public sources, the digitisation of the public sector and the interoperability of sources as the main challenges to be addressed. The updating and quality of information are some of the barriers to access and reuse of information.
- 94% of respondents see the creation of the Data Office as an opportunity for the geospatial sector. They expect this body to help in the coordination, centralisation and integration of data, and to promote openness and homogenisation of the availability of public sources.

Top 3 ASEDIE and success stories
The report includes a review of the status of the Top 3 Asedie, ASEDIE's initiative to promote the complete opening of three datasets by all Autonomous Communities, following unified criteria that facilitate their reuse. In 2019, the opening of the Cooperatives, Associations and Foundations databases was proposed. The initiative was a success, and all Communities have now opened at least two of the three proposed databases. This initiative is included in Commitment 9 of the 4th Open Government Plan.
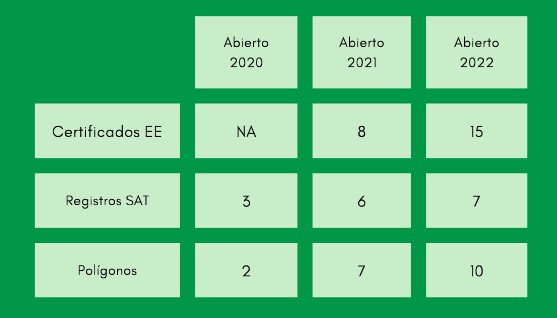
Given the good reception, a new Top 3 was launched in 2020, aimed at those Autonomous Communities that had already opened the first three databases, so that they could continue to advance in the opening of new datasets relating to: Register of Energy Efficiency Certificates, Industrial Estates and SAT Registers (Agricultural Transformation Companies). The evolution in the opening of these databases in the last year has also been remarkable, as shown in the following image.
The report concludes with several success stories of infomediary companies and examples of the products and services they produce, such as Infoempresa's web browser extension for obtaining business information or Axesor's platform (Investiga Pro) that allows online consultation of the Real Property Databases of both the Commercial Registry and the General Council of Notaries.
The report is available on Asedie's website in Spanish together with the video of the presentation of the report. It will soon be available in English together with an executive summary in French and Portuguese.
In conclusion, the sector is in good health, but this year has shown a slight decrease of 4.6% in times of pandemic. However, these figures are above the Spanish average (Spain's GDP fell by almost 10% in the same period). Although 55% of respondents have noticed the effect of Covid-19 on companies' or citizens' access to their data, the fact that 92% of respondents say they are satisfied with the level of digitisation available to them gives hope for improved results in the near future.
Evento
This year, the Infomediary Sector Report, prepared by the Multisectorial Association of Information (ASEDIE), reaches its 10th edition. The report, which is carried out annually, analyses in detail the national infomediary market, that is, the one linked to the reuse of public and/or private information for the development of value-added products.
The conclusions of this new edition will be made public on Thursday 7th April, in an event that can be followed both online and in person, from the National Geographic Institute.
The session will be entitled "The Data Economy in its Infomediary Sphere", a market of special interest to Asedie members. The EU estimates that the Data Economy will reach a value of 829,000 million euros in 2025 for the 27 member countries. This data represents a great business opportunity for companies in all sectors, but especially for infomediaries.
Agenda
The event will last for an hour and a half. It will start at 9:30 a.m. and will be attended by the Data Office, a key player in the promotion of the Data Economy in our country.
The full programme will be as follows:
| Time | Content |
|---|---|
| 09:15 – 09:30 | Reception of Attendees |
| 09:30 – 09:50 |
Welcome: Mr. Lorenzo García Asensio. Director of the IGN and President of the CNIG Inauguration: Mr. Ignacio Jiménez. President of Asedie Opening: Mr. Carlos Alonso Peña. Director of the Data Office Division. |
| 09.50 – 10.35 | Presentation of the 10th Edition of the Asedie Report The Data Economy in its Infomediary Scope. Mr. Javier Pérez, President of Asedie''s Information Sources Commission. |
| 10:35 – 10.45 | Appointment as Honorary Member of the CNIG. Mr. Emilio López Romero. Director CNIG |
| 10:45 – 11:00 |
Closing: Mr. Jesús Gómez García. Undersecretary of the Ministry of Transport, Mobility and Urban Agenda. Farewell: Mr. Ignacio Jiménez. President of Asedie |
The infomediary sector is growing steadily
In the previous edition of the report we were able to learn that in 2019 the Infomediary Sector grew by 6.4% in our country, exceeding the growth of the Gross Domestic Product (3.4%). At that time, this sector employed almost 22,000 people and had a turnover of more than 2,543 million euros.
Moreover, these companies tend to be closely linked to innovation and technological disruption. Of the 700 companies analysed in the last edition of the report, 61% indicated that they used AI to create value-added products or as a tool.
We will now wait until 7 April to find out whether this market has maintained this good trend.
Registration required
Whether you want to attend online or in person, you need to register in advance via this link.
Noticia
What are the needs of European public institutions that reuse open data? This is the question posed by the European Commission, through the European open data initiative data.europa.eu, and which is the starting point of the report "Measuring data demand within the public sector", recently published by the initiative.
The report is part of a series of actions that data.europa.eu is undertaking to encourage the re-use of data by the public sector. It is a year-long campaign that will include a series of articles and a webinar. The campaign will culminate in a second report on the findings.
This first report lays the groundwork for the issues to be addressed, setting out 3 objectives:
- Clarify the importance of public institutions as data re-users.
- Identify methods and good practices for assessing the demand from public institutions.
- Stimulate debate on the most appropriate way to foster the re-use of open data by public institutions.
Ultimately, the aim is to foster a data-driven public sector that recognises data as an integral asset for policy formulation, service delivery, management and public innovation.
The benefits of open data re-use by public institutions
Traditionally, in the open data ecosystem, an approach has been followed where the roles were divided: the public sector was the provider of data and the private sector was the re-user. However, this is changing and more and more institutions are realising the benefits of harnessing the potential of open data.
The report highlights how the OECD has identified three areas where data re-use can improve the effectiveness of public institutions:
- Anticipating governance. Open data helps to predict trends and patterns in order to mitigate emerging risks and respond to developing crises. One example is the interactive dashboard developed by Eurostat with statistical, monthly and quarterly indicators. This dashboard is used by different countries to monitor the economic and social recovery linked to the COVID-19 pandemic.
- Policy and service design and delivery. Open data helps to understand issues, engage citizens and drive evidence-based policy making. The report gives the example of the Baltic Sea regions, where cross-border use of open government data is being applied to improve social services.
- Performance management. Open data can also have an impact on increased public sector productivity, more efficient use of resources and better policy evaluation. In this respect, the European Commission's agri-food data portal, which integrates data from multiple European institutions, facilitates the calculation of key indicators for the evaluation of agricultural policies in all countries.
Open data therefore helps to make public services and policies more efficient, but also more sustainable, inclusive and trustworthy, benefiting citizens and businesses. However, despite these advantages, we find that much data in public institutions still does not flow freely, but is siloed. There is a lack of incentive to share, but also a fear of loss of control, among other factors.
The report suggests that the solution lies in taking into account and measuring the demand for data from public institutions. Knowing the benefits of opening up certain data encourages other institutions to open up and reuse it. In this regard, the report highlights, among others, Spain's efforts in engaging with user communities and monitoring the re-use of public data through the Aporta Initiative.
Existing approaches to assessing public institutions' demand for data
After this first part focusing on the benefits, the report goes on to analyse the approaches and indicators that currently exist in the European landscape for assessing the needs of public institutions as data re-users, in order to determine which methods are the most appropriate.
The literature review and the analysis of international measurement frameworks show that demand measurement is not common. The approaches and indicators developed by EU institutions and Member States are few and far between, and focus on fostering demand for data that is already available, without determining the extent of actual re-use of publicly available data and the impact achieved with it. Moreover, they usually focus on re-users in general and on groups such as businesses, journalists, civil society, etc., while neglecting the public sector.
Among the most advanced countries in this area, the report mentions Spain, where a proactive strategy is adopted through challenges and hackathons, co-creation events, information sessions and regular training.
When it comes to measuring impact, a combination of quantitative and qualitative methods is recommended, for example:
- Analyse IP addresses and web statistics.
- Implement web crawling techniques (e.g. search APIs) to identify mentions of open data reuse.
- Quantitative analysis of Tweets mentioning open data.
- Conduct online questionnaires and interviews with re-users.
- Use of contact forms so that users can share use cases or rating systems so that they can rate datasets.
In Spain, quite a few initiatives have already implemented these mechanisms, along with additional ones.
The report also reviews some international indices and reports in search of indicators that measure demand. Many, such as the Global Open Data Index, the Open Data Barometer or the Open Data Inventory (ODIN) focus on data provision and do not include any indicators to calculate the demand for open data by or within public institutions. However, here too the situation is changing and we find other reports such as the European Open Data Maturity Assessment or the Open Data Readiness Assessment (ODRA) that do include this type of metric. Also the forthcoming Global Data Barometer, produced by the Latin American open data initiative ILDA and the Data for Development Network, will include demand indicators as part of the study.
In this sense, the report includes in the annex two tables, one with the overview of the frameworks examined and another one that groups the indicators included in these frameworks that can be used to analyse the demand for open data from public institutions.
Next steps
The paper concludes with a list of key questions emerging from the research, which will be used to trigger a debate among stakeholders on appropriate methods and indicators to measure the demand for data from public institutions, in the context of the data.europa.eu portal. Examples of such questions are: what are the appropriate activities to attract re-users in the public sector or how can automated metrics be leveraged to measure the demand for data from public institutions.
A webinar will take place on Tuesday 29 March to discuss this report. Speakers from different agencies will explain how they engage with data re-users in public institutions, measure their demand and incorporate data into their open data policies. You can register at this link.
Noticia
Companies and public administrations in our country continue to advance on their path towards digitalization, with the opportunities that this entails: process optimization, improved user experience, and innovation in the products and services offered. This is reflected in several of the reports published during 2021, starting with the DESI index, prepared within the framework of the European Commission.
DESI Index
The DESI (Digital Economy and Society Index) tracks the progress made by EU Member States in digital competitiveness. For the latest edition, published at the end of 2021, there has been a change in methodology in order to align with the Recovery and Resilience Plan and the objectives set out in the EU Digital Decade Digital Compass. In this way, 4 indicators have been changed to measure: human capital, broadband connectivity, integration of digital technologies by businesses and digital public services.
It should also be noted that the data in the report correspond mainly to the first half of 2020, so the effect of the pandemic is only partially reflected. Its consequences will become clearer in the next edition.
In this context, Spain is positioned in 9th position, improving two positions compared to the previous year.
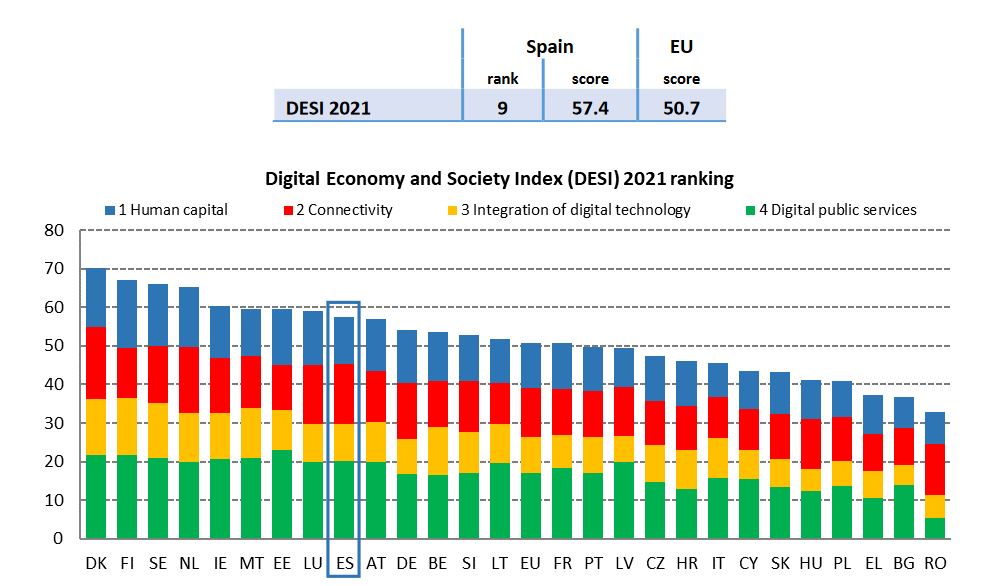
Spain remains ahead of the European average in the 4 categories analysed, standing out especially in the dimensions of digital public services and connectivity.
- Digital public services. The category where our country scores best, especially in the subsection of open data, with a score (94%) 16 percentage points above the EU average. The report also highlights that 67% of Internet users actively participate in e-government services. Thanks to the Public Administration Digitalization Plan, it is expected that at least 50% of digital public services will be accessible via mobile by the end of 2025. This seeks greater personalization of services and improved effectiveness, efficiency and transparency in the public sector.
- Connectivity. Spain stands out in very high-capacity networks. The differences between rural and urban areas are being increasingly reduced, although they still exist. 99.9% of populated areas have 4G coverage, but 5G still only reaches a minority. To reverse the situation, the Plan for Connectivity and Digital Infrastructures and the Strategy to Boost 5G Technology is underway, a roadmap whose goal is for the entire population to have a connection greater than 100 Mbps by 2025.
- Human capital. The report highlights that 57% of the Spanish population has at least basic digital skills. To increase this figure to reach the European target of 80% by 2030, the Spanish government has included the promotion of the population's digital skills as one of the main lines of action of the Digital Spain 2025 strategy. In this regard, the National Digital Skills Plan has been launched with seven lines of action ranging from the digital training of citizens and the reduction of the digital divide to the promotion of ICT specialists, a field where there is still ample room for improvement. The report also highlights the launch of the Educa en Digital Program, which establishes measures to promote greater digitalization of the Spanish education system.
- Integration of digital technology. 62% of Spanish SMEs have at least a basic level of digital intensity and 24% have embraced e-commerce, but few companies are taking advantage of technologies such as artificial intelligence, big data or cloud services. The response to improve this situation is the SME Digitalization Plan 2021-2025, which has five main lines of action: basic digitalization for SMEs; support for digital change management; promotion of disruptive innovation and digital entrepreneurship; support for sectoral digitalization (with a focus on industry, tourism and commerce); and coordination and efficiency.

Other reports related to digital transformation in Spain
In addition to the DESI index, some reports have also been published in our country during the last 12 months that refer to the current state of implementation of digital tools in different areas.
One example is "Sociedad Digital en España 2020-2021" (Digital Society in Spain 2020-2021), by the Telefónica Foundation. The report analyses the effects of the current healthcare situation on the technological habits of Spanish companies and citizens, globally and by autonomous communities. The COVID has driven the transformation, boosting teleworking and forcing many companies and public administrations to adopt digital tools both for their internal processes and for the relationship and provision of services to citizens. In this situation, the report highlights 3 key aspects:
- The importance of connectivity and the quality of the Spanish network, which faced a massive increase in traffic of almost 50%.
- The acceleration of the digitalization of individuals and companies, with the increase in the number of users connected to the network and consuming online services. It is estimated that digitalization could increase Spain's GDP by between 1.5 and 2.5 points each year until 2025 and improve the productivity of SMEs by between 15 and 25%.
- The need to put people at the centre of digital transformation. The pandemic has also widened the gap between those who have already embraced digital transformation and those who have not yet started. To alleviate this situation, it is proposed to rely on public-private partnership initiatives.
Last year also saw an update of the report The Digitalization of the Economy (originally published in 2017), by the Economic and Social Council of Spain. The debate on the impact of digitalization on productivity and employment has been joined by other new challenges related to the risk of technological hegemony of certain countries and companies, the deployment of 5G, the ethical limits to artificial intelligence or data ownership, among others.
Given that this is a situation in continuous evolution, the reports on the subject are constantly being updated. In the coming months, for example, we will be able to discover the conclusions of the new edition of "The Digital Economy in Spain", by the COTEC Foundation, currently under development.
What cannot be denied is that our country is advancing on its path towards digital opportunities. A path in which it is essential to continue promoting access to quality data and related capabilities to extract its full value.
Blog
Public administrations and international organisations are increasingly using new, more practical and creative approaches to problem solving, focusing on real data and how to better understand people's needs. This will enable them to propose solutions that meet those needs more directly and effectively, rather than designing policies or products in isolation and independently, and then trying to make the recipients conform to them.
A good example of this trend is the growing popularity of people-centred design methodologies - such as design thinking - among legislators, public service designers and policy innovators. Thus, we can see how institutions such as the United Nations or governments such as those of Australia or Hong Kong have been exploring the opportunities and advantages that user-centred design offers them for some time now.
This change of mentality also means that the way in which the analysis and results of these public policies have traditionally been presented through macro-reports is also evolving to adapt to the new needs of participatory and collaborative development. Here are three current examples of how this change in philosophy is already being put into practice.
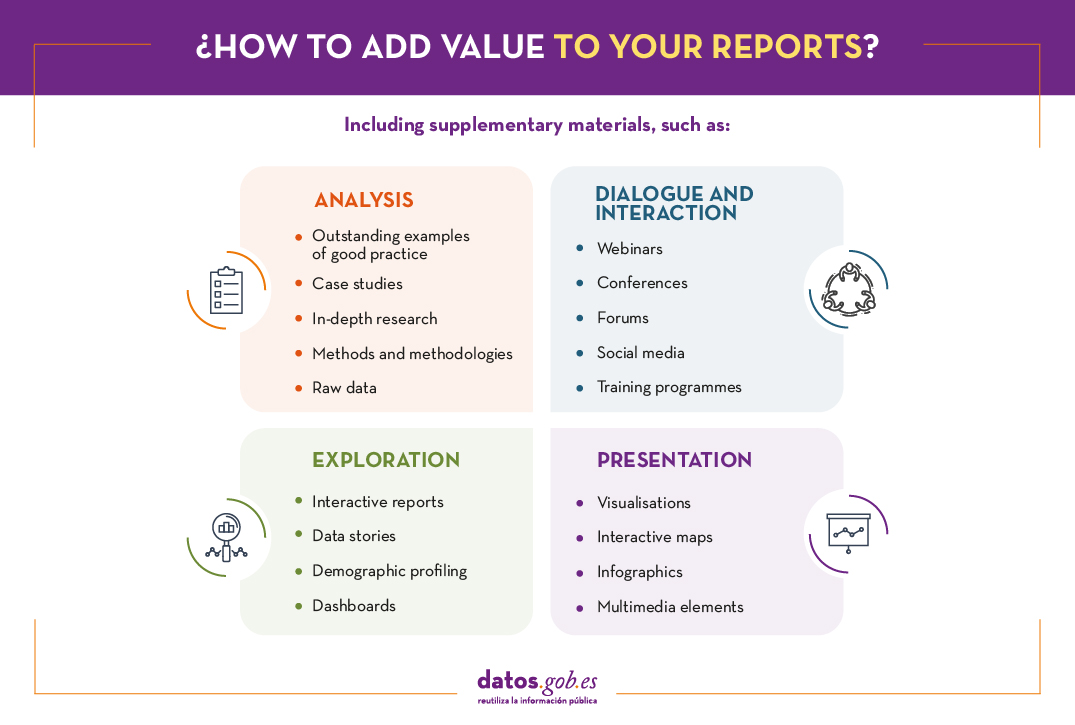
World Bank Global Development Report
About a year ago we shared the first draft of the World Bank's Development Report and already then it was striking that they had prepared a series of public consultations through which they sought to answer the main questions presented in that initial draft. Now that the rounds of consultations are over and a few months after the publication and presentation of the final version of the report, it is also pleasing to note that the World Bank is once again going a step further in presenting the results and offering us a range of options, including the following:
- Highlighted examples: A series of thematic case studies showing how data can be used to drive development in areas as diverse as road safety, environment, gender-based violence, public debt management, and weather forecasting.
- Data and analysis tools: Providing access to and the ability to explore and download all the data underpinning the report. This includes a number of time-series indicators for more than 170 countries, data on laws and regulations affecting data governance in 80 countries, and indicators on the maturity of countries' data governance practices.
- In-depth research: Provides a series of research articles that delve into some of the more detailed aspects of the issues covered in the report, such as the factors limiting internet adoption in West Africa and the cost to countries of enforcing and implementing personal data regulation.
- Case studies: where the World Bank will be incorporating real cases where it is working with countries to facilitate the implementation of appropriate data governance systems, although at the moment it only has a single case study on the data ecosystem in Jordan.
On the other hand, we can also see how this trend towards collaborative design and development not only seems to be consolidated, but also reinforced and extended through a series of online seminars in which the World Bank has been collaborating with other entities and organisations such as the G20, the OECD, the United Nations, Paris21, the Internet Society, the Open Institute or Data2X to continue analysing the results of the study from different points of view.
United Nations Sustainable Development Goals
Another good example of this trend can be seen in the ambitious Sustainable Development Goals project promoted by the United Nations, which, due to its size and complexity, needs to be supported by a variety of other tools beyond the traditional global reports on sustainable development that they also continue to publish on a regular basis. This is why they offer us a huge amount of additional documentation that includes detailed information on each of the 17 development goals, summaries of each goal through infographics and detailed information on their goals and actions, as well as hundreds of publications related to each goal in particular.
But that's not all: they also have a multitude of conferences, events and webinars so that anyone who wants to learn more about the goals or become more actively involved in their development and implementation can have an opportunity to do so. There are also specific high-level forums for the direct participation of member countries ultimately responsible for implementing the goals, as well as specific training and capacity building programmes for them. And, of course, they have their own social media presence through Facebook and Twitter, where they regularly report on all developments and news of possible interest to the general public.
Finally, in addition to all of the above, the UN also provides a range of resources for the scrupulous monitoring of member countries' conversations and dialogues around the goals, as well as the extent to which the goals are being met at any given moment. These monitoring tools include data explorers, interactive maps, country profiles, and stories told through data - which offer a variety of information and visualisations, whether promoted directly by the agency itself or by the community, or carried out by other institutions specialising in more specific issues such as energy or agriculture.
ITU Digital Development Indicators
Finally, a third good example of how to go a step beyond the traditional report can be seen in the statistics that the International Telecommunication Union (ITU) publishes regularly through its digital development measurement reports, which are not limited again to the publication of traditional reports, They offer a whole range of complementary alternatives including interactive reports, a complete multimedia kit to help us disseminate the main findings of the report and a whole series of events through which we can go deeper into different aspects of the results, ranging from international symposia, online seminars, expert group meetings or courses.
In addition, the ITU has created a series of interactive websites through which you can access the main digital development indicators and check their evolution over the last few years in the different countries, or review some more specific indicators such as those related to the cost of digital services, again including historical series and comparisons between different countries. Finally, they also offer us a complete data portal dedicated to collecting all the historical data of the main statistics and indicators available to the institution. And of course, we still have the option of accessing the raw data - including several specific time series and secondary indicators - to do our own analysis.
The above examples show how this shift in thinking about high-impact policy beyond reporting puts a whole new range of tools and methods at our disposal. These in turn will help us to breathe new life into the data we work with, moving from one-way procedures and reporting to increasingly collaborative processes in which data will flow between all participants at different stages of the process, from generating evidence about the problem we want to solve, building partnerships to find solutions, collaboratively developing those solutions, and finally channelling the actions needed to put them into practice.
Content prepared by Carlos Iglesias, Open data Researcher and consultan, World Wide Web Foundation.
Contents and points of view expressed in this publication are the exclusive responsibility of its author.
Noticia
The European Data Portal (EDP) has presented its report "Copernicus data for the open data community", prepared by con.terra as part of the EDP consortium. As we have reported before, Copernicus is the European Union's Earth Observation program that provides accurate, timely and easily accessible information to improve environmental management, understand and mitigate the effects of climate change and ensure civil security.
The report aims to help users harness the potential of Copernicus data to create Earth observation applications by answering three basic questions:
- What can I do with Copernicus data?
- How can I access the data?
- What tools do I need to use the data?
After an introduction reviewing the main activities and services available from the program, the report is divided into two parts: a first part where examples of Copernicus data applications are examined and a second, more practical part, where a particular use case is replicated in depth.
Copernicus use cases
The first part covers a series of possible use cases at a general level to answer the first of the questions posed above: what can be done with Copernicus data?
The use cases discussed are linked to the thematic areas addressed by the Copernicus program (emergency, security, marine, land, climate change and atmospheric monitoring), as well as to its services and tools. These examples cover the observation of plastic pollution of the oceans, land change due to mining activities, the impact of volcanic activities, ice loss, the creation of artificial islands, deforestation, forest fires, storms or pests.

The report highlights the importance of knowing what data are appropriate for each specific use case. For example, SENTINEL 2 MSI data is suitable for land monitoring, emergency management and security services, while SENTINEL 3 Altimetry data is linked to the areas of marine monitoring and climate change. To assist in this identification task, the guide includes references to various user guides with specifications on the missions, the instruments used to collect the data and the data products generated.
Case study on the use of Copernicus data
The second part of the report focuses on a particular use case that it addresses in depth, including how to download the appropriate data, process it and build applications with it. Specifically, it addresses the mapping of the lava flow of the Etna volcano using data from the Copernicus emergency management service. The aim is to track the impact of volcanic activities on nature and urban areas.
First, the report shows how to search and download data for this area of interest. In this case, Sentinel-2 products are used from the Copernicus Open Access Hub. The entry point for accessing the Copernicus data is their own website, which provides an overview of the data access points. Through different images, the report shows search and filter options to locate the appropriate data.

To visualize and process the data, it is proposed to use commercial software such as ArcGIS Pro, free GIS tools such as QGIS, open source processing tools such as SNAP or programming libraries such as GDAL. In the case of the example, SNAP (Sentinel Application Platform), the European Space Agency (ESA) platform, is used to view the lava flow.
Some explanations on workflow automation with the Open Access Hub API and the SNAPgraph tool are given at the end of the chapter.
Final conclusions
The report ends with several conclusions, among which the following stand out:
- Users can extract great value from Copernicus data but to do so they need to be familiar with the platforms involved and the necessary tools.
- For most use cases, it is necessary to combine Copernicus data with in situ data. The Copernicus program itself uses data from ground-based sensors, for example, for calibration and validation of its products.
Spain's role in Copernicus
The Ministry of Transport, Mobility and Urban Agenda, through the National Geographic Institute, and the Ministry for Ecological Transition (MITECO) represent Spain in the Copernicus User Forum, for the monitoring and evolution of the program. In this interview Nuria Valcárcel, Deputy Assistant Director (Observation of the Territory) of the General Directorate of Geodesy and Cartography, in the D.G. National Geographic Institute (IGN) delves into the services of Copernicus and its usefulness in the economic and social field.
In datos.gob.es you can also find this other interview with Stéphane Ourevitch, founder of SpaceTec, who participated as a speaker at the Encuentro Aporta 2019, where he tells us about the usefulness of data for space observation and how the Copernicus program promotes entrepreneurship through actions such as hackathons.
Copernicus data are very useful all over the world. In our country, we also find multiple services and applications developed based on Copernicus data, some of which are collected in this article.