Blog
Citizen science is consolidating itself as one of the most relevant sources of most relevant sources of reference in contemporary research contemporary research. This is recognised by the Centro Superior de Investigaciones Científicas (CSIC), which defines citizen science as a methodology and a means for the promotion of scientific culture in which science and citizen participation strategies converge.
We talked some time ago about the importance importance of citizen science in society in society. Today, citizen science projects have not only increased in number, diversity and complexity, but have also driven a significant process of reflection on how citizens can actively contribute to the generation of data and knowledge.
To reach this point, programmes such as Horizon 2020, which explicitly recognised citizen participation in science, have played a key role. More specifically, the chapter "Science with and for society"gave an important boost to this type of initiatives in Europe and also in Spain. In fact, as a result of Spanish participation in this programme, as well as in parallel initiatives, Spanish projects have been increasing in size and connections with international initiatives.
This growing interest in citizen science also translates into concrete policies. An example of this is the current Spanish Strategy for Science, Technology and Innovation (EECTI), for the period 2021-2027, which includes "the social and economic responsibility of R&D&I through the incorporation of citizen science" which includes "the social and economic responsibility of I through the incorporation of citizen science".
In short, we commented some time agoin short, citizen science initiatives seek to encourage a more democratic sciencethat responds to the interests of all citizens and generates information that can be reused for the benefit of society. Here are some examples of citizen science projects that help collect data whose reuse can have a positive impact on society:
AtmOOs Academic Project: Education and citizen science on air pollution and mobility.
In this programme, Thigis developed a citizen science pilot on mobility and the environment with pupils from a school in Barcelona's Eixample district. This project, which is already replicable in other schoolsconsists of collecting data on student mobility patterns in order to analyse issues related to sustainability.
On the website of AtmOOs Academic you can visualise the results of all the editions that have been carried out annually since the 2017-2018 academic year and show information on the vehicles used by students to go to class or the emissions generated according to school stage.
WildINTEL: Research project on life monitoring in Huelva
The University of Huelva and the State Agency for Scientific Research (CSIC) are collaborating to build a wildlife monitoring system to obtain essential biodiversity variables. To do this, remote data capture photo-trapping cameras and artificial intelligence are used.
The wildINTEL project project focuses on the development of a monitoring system that is scalable and replicable, thus facilitating the efficient collection and management of biodiversity data. This system will incorporate innovative technologies to provide accurate and objective demographic estimates of populations and communities.
Through this project which started in December 2023 and will continue until December 2026, it is expected to provide tools and products to improve the management of biodiversity not only in the province of Huelva but throughout Europe.
IncluScience-Me: Citizen science in the classroom to promote scientific culture and biodiversity conservation.
This citizen science project combining education and biodiversity arises from the need to address scientific research in schools. To do this, students take on the role of a researcher to tackle a real challenge: to track and identify the mammals that live in their immediate environment to help update a distribution map and, therefore, their conservation.
IncluScience-Me was born at the University of Cordoba and, specifically, in the Research Group on Education and Biodiversity Management (Gesbio), and has been made possible thanks to the participation of the University of Castilla-La Mancha and the Research Institute for Hunting Resources of Ciudad Real (IREC), with the collaboration of the Spanish Foundation for Science and Technology - Ministry of Science, Innovation and Universities.
The Memory of the Herd: Documentary corpus of pastoral life.
This citizen science project which has been active since July 2023, aims to gather knowledge and experiences from sheperds and retired shepherds about herd management and livestock farming.
The entity responsible for the programme is the Institut Català de Paleoecologia Humana i Evolució Social, although the Museu Etnogràfic de Ripoll, Institució Milà i Fontanals-CSIC, Universitat Autònoma de Barcelona and Universitat Rovira i Virgili also collaborate.
Through the programme, it helps to interpret the archaeological record and contributes to the preservation of knowledge of pastoral practice. In addition, it values the experience and knowledge of older people, a work that contributes to ending the negative connotation of "old age" in a society that gives priority to "youth", i.e., that they are no longer considered passive subjects but active social subjects.
Plastic Pirates Spain: Study of plastic pollution in European rivers.
It is a citizen science project which has been carried out over the last year with young people between 12 and 18 years of age in the communities of Castilla y León and Catalonia aims to contribute to generating scientific evidence and environmental awareness about plastic waste in rivers.
To this end, groups of young people from different educational centres, associations and youth groups have taken part in sampling campaigns to collect data on the presence of waste and rubbish, mainly plastics and microplastics in riverbanks and water.
In Spain, this project has been coordinated by the BETA Technology Centre of the University of Vic - Central University of Catalonia together with the University of Burgos and the Oxygen Foundation. You can access more information on their website.
Here are some examples of citizen science projects. You can find out more at the Observatory of Citizen Science in Spain an initiative that brings together a wide range of educational resources, reports and other interesting information on citizen science and its impact in Spain. do you know of any other projects? Send it to us at dinamizacion@datos.gob.es and we can publicise it through our dissemination channels.
Blog
Digital transformation has reached almost every aspect and sector of our lives, and the world of products and services is no exception. In this context, the Digital Product Passport (DPP) concept is emerging as a revolutionary tool to foster sustainability and the circular economy. Accompanied by initiatives such as CIRPASS (Circular Product Information System for Sustainability), the DPP promises to change the way we interact with products throughout their life cycle. In this article, we will explore what DPP is, its origins, applications, risks and how it can affect our daily lives and the protection of our personal data.
What is the Digital Product Passport (DPP)? Origin and importance
The Digital Product Passport is a digital collection of key information about a product, from manufacturing to recycling. This passport allows products to be tracked and managed more efficiently, improving transparency and facilitating sustainable practices. The information contained in a DPP may include details on the materials used, the manufacturing process, the supply chain, instructions for use and how to recycle the product at the end of its life.
The DPP has been developed in response to the growing need to promote the circular economy and reduce the environmental impact of products. The European Union (EU) has been a pioneer in promoting policies and regulations that support sustainability. Initiatives such as the EU's Circular Economy Action Plan have been instrumental in driving the DPP forward. The objectives of this plan are as follows:
- Greater Transparency: Consumers no longer have to guess about the origin of their products and how to dispose of them correctly. With a machine-readable DPP (e.g. QR code or NFC tag) attached to end products, consumers can make informed purchasing decisions and brands can eliminate greenwashing with confidence.
- Simplified Compliance: By creating an audit of events and transactions in a product's value chain, the DPP provides the brand and its suppliers with the necessary data to address compliance demands efficiently.
- Sustainable Production: By tracking and reporting the social and environmental impacts of a product from source to disposal, brands can make data-driven decisions to optimise sustainability in product development.
- Circular Economy: The DPP facilitates a circular economy by promoting eco-design and the responsible production of durable products that can be reused, remanufactured and disposed of correctly.
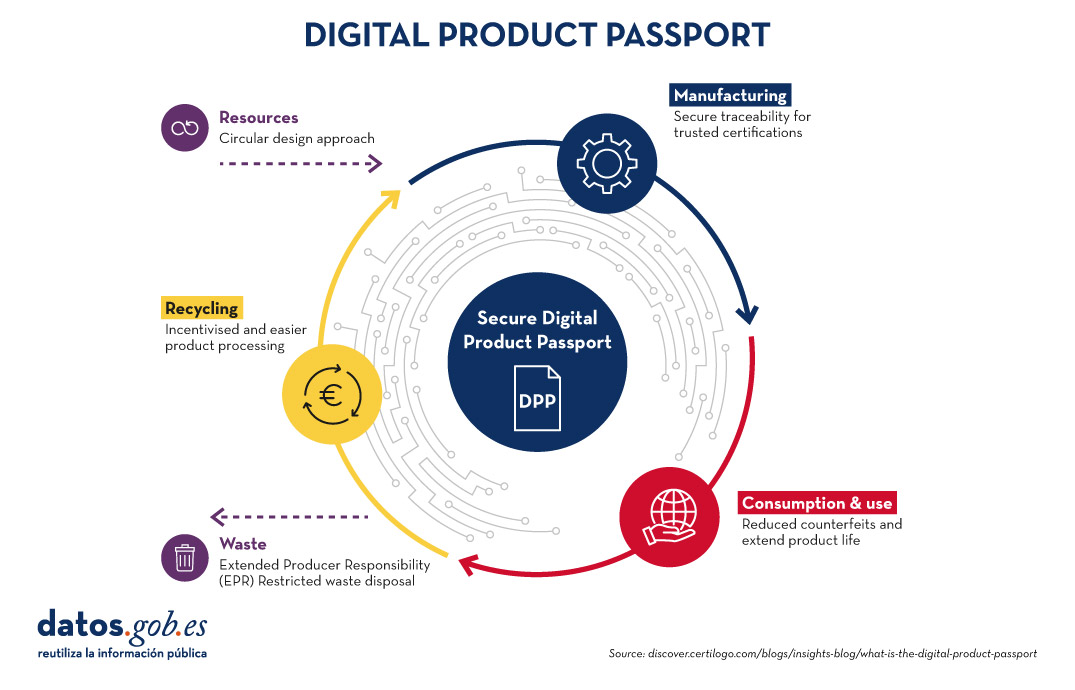
The following image summarises the main advantages of the digital passport at each stage of the digital product manufacturing process:
CIRPASS as a facilitator of DPP implementation
CIRPASS is a platform that supports the implementation of the DPP. This European initiative aims to standardise the collection and exchange of data on products, facilitating their traceability and management throughout their life cycle. CIRPASS plays a crucial role in creating an interoperable digital framework that connects manufacturers, consumers and recyclers.
DPP applications in various sectors
On 5 March 2024, CIRPASS, in collaboration with the European Commission, organised an event on the future development of the Digital Product Passport. The event brought together various stakeholders from different industries and organisations, who, with an eminently practical approach presented and discussed various aspects of the upcoming regulation and its requirements, possible solutions, examples of use cases, and the obstacles and opportunities for the affected industries and businesses.
The following are the applications of DPP in various sectors as explained at the event:
- Textile industry: It allows consumers to know the origin of the garments, the materials used and the working conditions in the factories.
- Electronics: Facilitates recycling and reuse of components, reducing electronic waste.
- Automotive: It assists in tracking parts and materials, promoting the repair and recycling of vehicles.
- Power supply: It provides information on food traceability, ensuring safety and sustainability in the supply chain.
The impact of the DPP on citizens' lives
But what impact will the use of this kind of novel paradigm have on our daily lives? And how does this impact on us as end users of multiple products and services such as those mentioned above? We will focus on four base cases: informed consumers in any field, ease of product repair, trust and transparency, and efficient recycling.
The DPP provides consumers with access to detailed information about the products they buy, such as their origin, materials and production practices. This allows consumers to make more informed choices and opt for products that are sustainable and ethical. For example, a consumer can choose a garment made from organic materials and produced under fair labour conditions, thus promoting responsible and conscious consumption.
Similarly, one of the great benefits of the DPP is the inclusion of repair guides within the digital passport. This means that consumers can easily access detailed instructions on how to repair a product instead of discarding it when it breaks down. For example, if an appliance stops working, the DPP can provide a step-by-step repair manual, allowing the user to fix it himself or take it to a technician with the necessary information. This not only extends the lifetime of products, but also reduces e-waste and promotes sustainability.
Also, access to detailed and transparent product information through the DPP can increase consumers' trust in brands. Companies that provide a complete and accurate DPP demonstrate their commitment to transparency and accountability, which can enhance their reputation and build customer loyalty. In addition, consumers who have access to this information are better able to make responsible purchasing decisions, thus encouraging more ethical and sustainable consumption habits.
Finally, the DPP facilitates effective recycling by providing clear information on how to break down and reuse the materials in a product. For example, a citizen who wishes to recycle an electronic device can consult the DPP to find out which parts can be recycled and how to separate them properly. This improves the efficiency of the recycling process and ensures that more materials are recovered and reused instead of ending up in landfill, contributing to a circular economy.
Risks and challenges of the DPP
Similarly, as a novel technology and as part of the digital transformation that is taking place in the product sectors, the DPP also presents certain challenges, risks and challenges such as:
- Data Protection: The collection and storage of large amounts of data can put consumers' privacy at risk if not properly managed.
- Security: Digital data is vulnerable to cyber-attacks, which requires robust security measures.
- Interoperability: Standardisation of data across different industries and countries can be complex, making it difficult to implement the DPP on a large scale.
- Costs: Creating and maintaining digital passports can be costly, especially for small and medium-sized enterprises.
Data protection implications
The implementation of the DPP and systems such as CIRPASS implies careful management of personal data. It is essential that companies and digital platforms comply with data protection regulations, such as the EU's General Data Protection Regulation (GDPR). Organisations must ensure that the data collected is used in a transparent manner and with the explicit consent of consumers. In addition, advanced security measures must be implemented to protect the integrity and confidentiality of the data.
Relationship with European Data Spaces
The European Data Spaces are an EU initiative to create a single market for data, promoting innovation and the digital economy. The DPP and CIRPASS are aligned with this vision, as they encourage the exchange of information between different actors in the economy. Data interoperability is essential for the success of the European Data Spaces, and the DPP can contribute significantly to this goal by providing structured and accessible product data.
Conclusion
In conclusion, the Digital Product Passport and the CIRPASS initiative represent a significant step towards a more circular and sustainable economy. Through the collection and exchange of detailed product data, these systems can improve transparency, encourage responsible consumption practices and reduce environmental impact. However, their implementation requires overcoming challenges related to data protection, security and interoperability. As we move towards a more digitised future, the DPP and CIRPASS have the potential to transform the way we interact with products and contribute to a more sustainable world.
Content prepared by Dr. Fernando Gualo, Professor at UCLM and Data Governance and Quality Consultant The content and the point of view reflected in this publication are the sole responsibility of its author.
Documentación
The digital revolution is transforming municipal services, driven by the increasing adoption of artificial intelligence (AI) technologies that also benefit from open data. These developments have the potential to redefine the way municipalities deliver services to their citizens, providing tools to improve efficiency, accessibility and sustainability. This report looks at success stories in the deployment of applications and platforms that seek to improve various aspects of life in municipalities, highlighting their potential to unlock more of the vast untapped potential of open data and associated artificial intelligence technologies.
The applications and platforms described in this report have a high potential for replicability in different municipal contexts, as they address common problems. Replication of these solutions can take place through collaboration between municipalities, companies and developers, as well as through the release and standardisation of open data.
Despite the benefits, the adoption of open data for municipal innovation also presents significant challenges. The quality, updating and standardisation of data published by local authorities, as well as interoperability between different platforms and systems, must be ensured. In addition, the open data culture needs to be reinforced among all actors involved, including citizens, developers, businesses and public administrations themselves.
The use cases analysed are divided into four sections. Each of these sections is described below and some examples of the solutions included in the report are shown.
Transport and Mobility
One of the most significant challenges in urban areas is transport and mobility management. Applications using open data have proven to be effective in improving these services. For example, applications such as Park4Dis make it easy to locate parking spaces for people with reduced mobility, using data from multiple municipalities and contributions from volunteers. CityMapper, which has gone global, on the other hand, offers optimised public transport routes in real time, integrating data from various transport modes to provide the most efficient route. These applications not only improve mobility, but also contribute to sustainability by reducing congestion and carbon emissions.
Environment and Sustainability
Growing awareness of sustainability has spurred the development of applications that promote environmentally friendly practices. CleanSpot, for example, facilitates the location of recycling points and the management of municipal waste. The application encourages citizen participation in cleaning and recycling, contributing to the reduction of the ecological footprint. Liight gamifies sustainable behaviour by rewarding users for actions such as recycling or using public transport. These applications not only improve environmental management, but also educate and motivate citizens to adopt more sustainable habits.
Optimisation of Basic Public Services
Urban service management platforms, such as Gestdropper, use open data to monitor and control urban infrastructure in real time. These tools enable more efficient management of resources such as street lighting, water networks and street furniture, optimising maintenance, incident response and reducing operating costs. Moreover, the deployment of appointment management systems, such as CitaME, helps to reduce waiting times and improve efficiency in customer service.
Citizen Services Aggregators
Applications that centralise public information and services, such as Badajoz Es Más and AppValencia, improve accessibility and communication between administrations and citizens. These platforms provide real-time data on public transport, cultural events, tourism and administrative procedures, making life in the municipality easier for residents and tourists alike. For example, integrating multiple services into a single application improves efficiency and reduces the need for unnecessary travel. These tools also support local economies by promoting cultural events and commercial services.
Conclusions
The use of open data and artificial intelligence technologies is transforming municipal management, improving the efficiency, accessibility and sustainability of public services. The success stories presented in this report describe how these tools can benefit both citizens and public administrations by making cities smarter, more inclusive and sustainable environments, and more responsive to the needs and well-being of their inhabitants and visitors.
To delve deeper into the report’s content, we’ve recorded a podcast and a video-interview in which the author explains the key points of this guide. We’ve also created an infographic and an executive summary.
Listen to the podcast (only available in spanish)
Watch the video-interview with the author
Blog
The cross-cutting nature of open data on weather and climate data has favoured its use in areas as diverse as precision agriculture, fire prevention or the precision forestry. But the relevance of these datasets lies not only in their direct applicability across multiple industries, but also in their contribution to the challenges related to climate change and environmental sustainability challenges related to climate change and environmental sustainability, which the different action lines of the which the different action lines of the European Green Pact seek to address.
Meteorological data are considered by the European Commission, high value data in accordance with the annex to Regulation 2023/138. In this post we explain which specific datasets are considered to be of high value and the level of availability of this type of data in Spain.
The State Meteorological Agency
In Spain, it corresponds to the State Agency for Meteorology (AEMET) the mission of providing meteorological and climatological services at national level. As part of the Ministry for Ecological Transition and the Demographic Challenge. AEMET leads the related activities of observation, prediction and study of meteorological and climatic conditions, as well as research related to these fields. Its mission includes the provision and dissemination of essential information and forecasts of general interest. This information can also support relevant areas such as civil protection, air navigation, national defence and other sectors of activity.
In order to fulfil this mission, AEMET manages an open data portal that enables the reuse by natural or legal persons, for commercial or non-commercial purposes, of part of the data it generates, prepares and safeguards in the performance of its functions. This portal, known as AEMET OpenData currently offers two modalities for accessing and downloading data in reusable formats:
- General access, which consists of graphical access for the general public through human-friendly interfaces.
- AEMET OpenData API, designed for periodic or scheduled interactions in any programming language, which allows developers to include AEMET data in their own information systems and applications.
In addition, in accordance with Regulation 2023/138, it is envisaged to enable a third access route that would allow re-users to obtain packaged datasets for mass downloading where possible.
In order to access any of the datasets, an access key (API Key) which can be obtained through a simple request in which only an e-mail address is required, without any additional data from the applicant, for the sending of the access key. This is a control measure to ensure that the service is provided with adequate quality and in a non-discriminatory manner for all users.
AEMET OpenData also pioneered the availability of open meteorological data in Europe, reflecting AEMET''s commitment to the continuous improvement of meteorological services, support to the scientific and technological community, and the promotion of a more informed and resilient society in the face of climate challenges.
High-value meteorological datasets
The Annex to Regulation (EU) 2023/138 details five high-value meteorological data sets: weather station observations, validated weather data observations, weather warnings, radar data and numerical prediction model (NMP) data. For each of the sets, the regulation specifies the granularity and the main attributes to be published.
If we analyse the correspondence of the datasets that are currently available grouped in 14 categories in the portal AEMET OpenData portal, with the five datasets that will become mandatory in the coming months, we obtain the conclusions summarised in the following table:
| High-value meteorological datasets | Equivalence in the AEMET OpenData datasets |
|---|---|
| Observation data measured by meteorological stations | The "Conventional Observation" dataset, generated by the Observing Service, provides a large number of hourly variables on liquid and solid precipitation, wind speed and direction, humidity, pressure, air, soil and subsoil temperature, visibility, etc. It is updated twice an hour. In accordance with the Regulation, ten-minute data shall be included with continuous updating. |
| Climate data: validated observations | Within the category "Climatological Values", four datasets on climate data observations are provided: "Daily climatologies", "Monthly/annual climatologies", "Normal values" and "Recorded extremes". The validated dataset provided by the National Climatological Data Bank Service is normally updated once a day with a delay of four days due to validation processes. Attributes available include daily mean temperature, daily precipitation in its standard 07:00 to 07:00 measurement form, daily mean relative humidity, maximum gust direction, etc. In accordance with the Regulation, the inclusion of hourly climatology is planned. |
| Weather warnings | Adverse weather warnings" are provided for the whole of Spain, or segmented by province or Autonomous Community. Both the latest issued and the historical ones since 2018. They provide data on observed and/or forecast severe weather events, from the present time until the next 72 hours. These warnings refer to each meteorological parameter by warning level, for each weather zone defined in the Meteoalert Plan. It is generated by the Adverse Events Functional Groups and the information is available any time an adverse weather event is issued, in line with the Regulation, which requires the dataset to be published "as issued or hourly". In this case, AEMET announces preferential broadcasting hours: 09:00, 11:30, 23:00 y 23:50. |
| Radar data | There are two sets of data: "Regional radar graphic image" and "National radar composition image", which provide reflectivity images, but not the others described in the Regulation (backscatter, polarisation, precipitation, wind and echotop). The dataset is generated by the Land Remote Sensing group and the information is available at a periodicity of 10 minutes instead of the 5 minutes recommended in the Regulation. However, according to the Strategic Plan 2022-2025 of the AEMET the updating of the 15 weather radars and the incorporation of new radars with higher resolution is foreseen, so that in addition to strengthening the early warning system, the obligations of the Regulation can be fulfilled. |
| PMN model data | There are several datasets with forecast information, some available for download and some available on the web: weather forecast, normalised text forecast, specific forecasts, maritime forecast and maps of weather variables maps of the HARMONIE-AROME numerical models for different geographical areas and time periods. However, the AEMET, according to their frequently asked questions document does not currently consider numerical model outputs as open data. AEMET offers the possibility of requesting this or any other dataset through the general register or through the electronic site but this is not an option provided for in the Regulation. In line with this, the inclusion of numerical atmospheric and wave model outputs is foreseen. |
Figure 1: Table showing the equivalence between high value datasets and AEMET OpenData datasets.
The regulation also sets out a number of requirements for publication in terms of format, licence granted, frequency of updating and timeliness, means of access and metadata provided.
In the case of metadata, AEMET publishes, in machine-readable format, the main characteristics of the downloaded file: who prepares it, how often it is prepared, what it contains and its format, as well as information on the data fields (meteorological variable, unit of measurement, etc.). The copyright and terms of use are also specified by means of the legal notice. In this regard, it is foreseen that the current licences will be reviewed to make the datasets available under a licensing scheme compliant with the Regulation, possibly following the recommendation by adopting the license CC BY-SA 4.0.
All in all, it seems that the long track record of the State Meteorological Agency (AEMET) in providing quality open data has put it in a good position to comply with the requirements of the new regulation, making some adjustments to the datasets it already offers through AEMET OpenData to align them with the new obligations. AEMET plans to include in this service the datasets required by the Regulation and which are currently not available, as it adapts its regulations on public prices, as well as the infrastructure and systems that make this possible. Additional datasets that will be available will be ten-minute observation data, hourly climatologies and some data parameters from regional radars and numerical wave and forecast models.
Content prepared by Jose Luis Marín, Senior Consultant in Data, Strategy, Innovation & Digitalization. The contents and views reflected in this publication are the sole responsibility of the author.
Documentación
1. Introduction
In the information age, artificial intelligence has proven to be an invaluable tool for a variety of applications. One of the most incredible manifestations of this technology is GPT (Generative Pre-trained Transformer), developed by OpenAI. GPT is a natural language model that can understand and generate text, providing coherent and contextually relevant responses. With the recent introduction of Chat GPT-4, the capabilities of this model have been further expanded, allowing for greater customisation and adaptability to different themes.
In this post, we will show you how to set up and customise a specialised critical minerals wizard using GPT-4 and open data sources. As we have shown in previous publications critical minerals are fundamental to numerous industries, including technology, energy and defence, due to their unique properties and strategic importance. However, information on these materials can be complex and scattered, making a specialised assistant particularly useful.
The aim of this post is to guide you step by step from the initial configuration to the implementation of a GPT wizard that can help you to solve doubts and provide valuable information about critical minerals in your day to day life. In addition, we will explore how to customise aspects of the assistant, such as the tone and style of responses, to perfectly suit your needs. At the end of this journey, you will have a powerful, customised tool that will transform the way you access and use critical open mineral information.
Access the data lab repository on Github.
2. Context
The transition to a sustainable future involves not only changes in energy sources, but also in the material resources we use. The success of sectors such as energy storage batteries, wind turbines, solar panels, electrolysers, drones, robots, data transmission networks, electronic devices or space satellites depends heavily on access to the raw materials critical to their development. We understand that a mineral is critical when the following factors are met:
- Its global reserves are scarce
- There are no alternative materials that can perform their function (their properties are unique or very unique)
- They are indispensable materials for key economic sectors of the future, and/or their supply chain is high risk
You can learn more about critical minerals in the post mentioned above.
3. Target
This exercise focuses on showing the reader how to customise a specialised GPT model for a specific use case. We will adopt a "learning-by-doing" approach, so that the reader can understand how to set up and adjust the model to solve a real and relevant problem, such as critical mineral expert advice. This hands-on approach not only improves understanding of language model customisation techniques, but also prepares readers to apply this knowledge to real-world problem solving, providing a rich learning experience directly applicable to their own projects.
The GPT assistant specialised in critical minerals will be designed to become an essential tool for professionals, researchers and students. Its main objective will be to facilitate access to accurate and up-to-date information on these materials, to support strategic decision-making and to promote education in this field. The following are the specific objectives we seek to achieve with this assistant:
- Provide accurate and up-to-date information:
- The assistant should provide detailed and accurate information on various critical minerals, including their composition, properties, industrial uses and availability.
- Keep up to date with the latest research and market trends in the field of critical minerals.
- Assist in decision-making:
- To provide data and analysis that can assist strategic decision making in industry and critical minerals research.
- Provide comparisons and evaluations of different minerals in terms of performance, cost and availability.
- Promote education and awareness of the issue:
- Act as an educational tool for students, researchers and practitioners, helping to improve their knowledge of critical minerals.
- Raise awareness of the importance of these materials and the challenges related to their supply and sustainability.
4. Resources
To configure and customise our GPT wizard specialising in critical minerals, it is essential to have a number of resources to facilitate implementation and ensure the accuracy and relevance of the model''s responses. In this section, we will detail the necessary resources that include both the technological tools and the sources of information that will be integrated into the assistant''s knowledge base.
Tools and Technologies
The key tools and technologies to develop this exercise are:
- OpenAI account: required to access the platform and use the GPT-4 model. In this post, we will use ChatGPT''s Plus subscription to show you how to create and publish a custom GPT. However, you can develop this exercise in a similar way by using a free OpenAI account and performing the same set of instructions through a standard ChatGPT conversation.
- Microsoft Excel: we have designed this exercise so that anyone without technical knowledge can work through it from start to finish. We will only use office tools such as Microsoft Excel to make some adjustments to the downloaded data.
In a complementary way, we will use another set of tools that will allow us to automate some actions without their use being strictly necessary:
- Google Colab: is a Python Notebooks environment that runs in the cloud, allowing users to write and run Python code directly in the browser. Google Colab is particularly useful for machine learning, data analysis and experimentation with language models, offering free access to powerful computational resources and facilitating collaboration and project sharing.
- Markmap: is a tool that visualises Markdown mind maps in real time. Users write ideas in Markdown and the tool renders them as an interactive mind map in the browser. Markmap is useful for project planning, note taking and organising complex information visually. It facilitates understanding and the exchange of ideas in teams and presentations.
Sources of information
- Raw Materials Information System (RMIS): raw materials information system maintained by the Joint Research Center of the European Union. It provides detailed and up-to-date data on the availability, production and consumption of raw materials in Europe.
- International Energy Agency (IEA) Catalogue of Reports and Data: the International Energy Agency (IEA) offers a comprehensive catalogue of energy-related reports and data, including statistics on production, consumption and reserves of energy and critical minerals.
- Mineral Database of the Spanish Geological and Mining Institute (BDMIN in its acronym in Spanish): contains detailed information on minerals and mineral deposits in Spain, useful to obtain specific data on the production and reserves of critical minerals in the country.
With these resources, you will be well equipped to develop a specialised GPT assistant that can provide accurate and relevant answers on critical minerals, facilitating informed decision-making in the field.
5. Development of the exercise
5.1. Building the knowledge base
For our specialised critical minerals GPT assistant to be truly useful and accurate, it is essential to build a solid and structured knowledge base. This knowledge base will be the set of data and information that the assistant will use to answer queries. The quality and relevance of this information will determine the effectiveness of the assistant in providing accurate and useful answers.
Search for Data Sources
We start with the collection of information sources that will feed our knowledge base. Not all sources of information are equally reliable. It is essential to assess the quality of the sources identified, ensuring that:
- Information is up to date: the relevance of data can change rapidly, especially in dynamic fields such as critical minerals.
- The source is reliable and recognised: it is necessary to use sources from recognised and respected academic and professional institutions.
- Data is complete and accessible: it is crucial that data is detailed and accessible for integration into our wizard.
In our case, we developed an online search in different platforms and information repositories trying to select information belonging to different recognised entities:
- Research centres and universities:
- They publish detailed studies and reports on the research and development of critical minerals.
- Example: RMIS of the Joint Research Center of the European Union.
- Governmental institutions and international organisations:
- These entities usually provide comprehensive and up-to-date data on the availability and use of critical minerals.
- Example: International Energy Agency (IEA).
- Specialised databases:
- They contain technical and specific data on deposits and production of critical minerals.
- Example: Minerals Database of the Spanish Geological and Mining Institute (BDMIN).
Selection and preparation of information
We will now focus on the selection and preparation of existing information from these sources to ensure that our GPT assistant can access accurate and useful data.
RMIS of the Joint Research Center of the European Union:
- Selected information:
We selected the report "Supply chain analysis and material demand forecast in strategic technologies and sectors in the EU - A foresight study". This is an analysis of the supply chain and demand for minerals in strategic technologies and sectors in the EU. It presents a detailed study of the supply chains of critical raw materials and forecasts the demand for minerals up to 2050.
- Necessary preparation:
The format of the document, PDF, allows the direct ingestion of the information by our assistant. However, as can be seen in Figure 1, there is a particularly relevant table on pages 238-240 which analyses, for each mineral, its supply risk, typology (strategic, critical or non-critical) and the key technologies that employ it. We therefore decided to extract this table into a structured format (CSV), so that we have two pieces of information that will become part of our knowledge base.

Figure 1: Table of minerals contained in the JRC PDF
To programmatically extract the data contained in this table and transform it into a more easily processable format, such as CSV(comma separated values), we will use a Python script that we can use through the platform Google Colab platform (Figure 2).

Figure 2: Script Python para la extracción de datos del PDF de JRC desarrollado en plataforma Google Colab.
To summarise, this script:
- It is based on the open source library PyPDF2capable of interpreting information contained in PDF files.
- First, it extracts in text format (string) the content of the pages of the PDF where the mineral table is located, removing all the content that does not correspond to the table itself.
- It then goes through the string line by line, converting the values into columns of a data table. We will know that a mineral is used in a key technology if in the corresponding column of that mineral we find a number 1 (otherwise it will contain a 0).
- Finally, it exports the table to a CSV file for further use.
International Energy Agency (IEA):
- Selected information:
We selected the report "Global Critical Minerals Outlook 2024". It provides an overview of industrial developments in 2023 and early 2024, and offers medium- and long-term prospects for the demand and supply of key minerals for the energy transition. It also assesses risks to the reliability, sustainability and diversity of critical mineral supply chains.
- Necessary preparation:
The format of the document, PDF, allows us to ingest the information directly by our virtual assistant. In this case, we will not make any adjustments to the selected information.
Spanish Geological and Mining Institute''s Minerals Database (BDMIN)
- Selected information:
In this case, we use the form to select the existing data in this database for indications and deposits in the field of metallogeny, in particular those with lithium content.
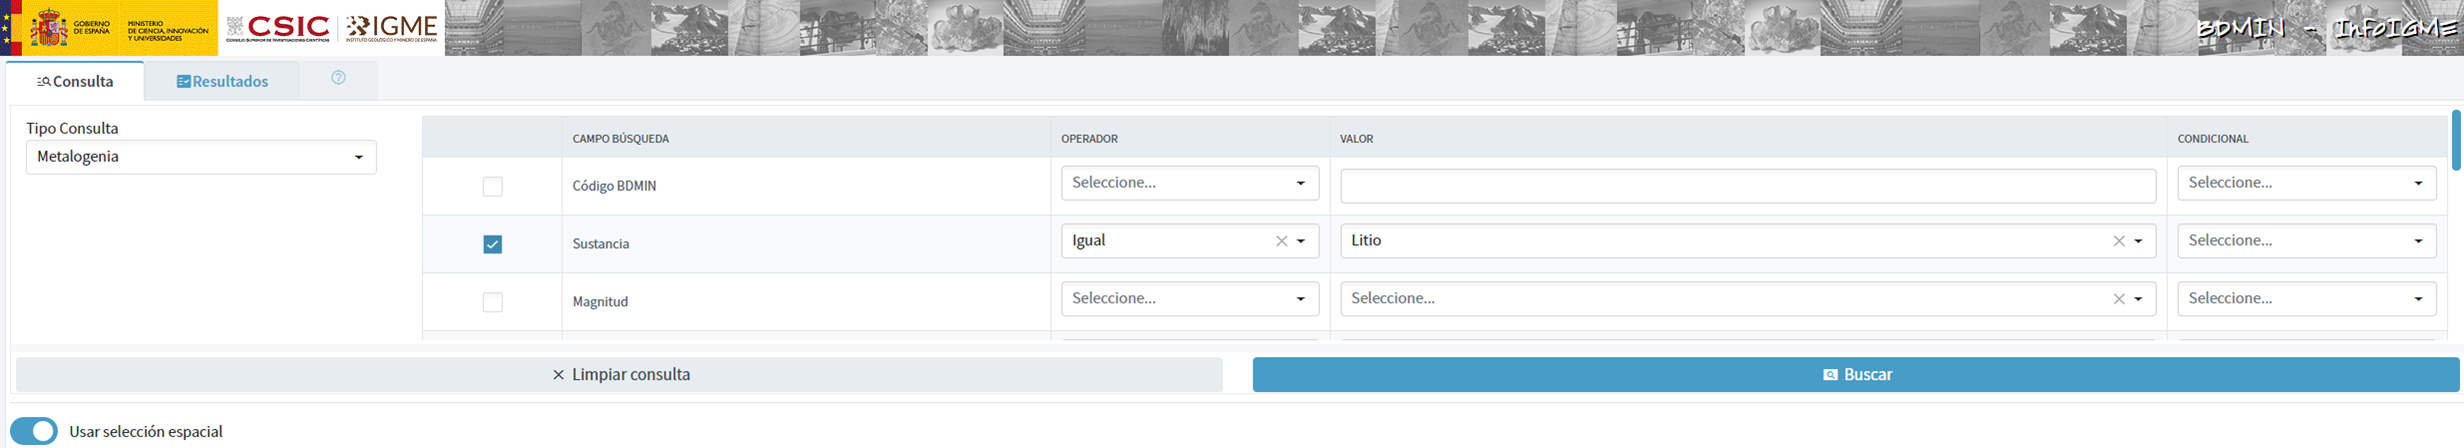
Figure 3: Dataset selection in BDMIN.
- Necessary preparation:
We note how the web tool allows online visualisation and also the export of this data in various formats. Select all the data to be exported and click on this option to download an Excel file with the desired information.

Figure 4: Visualization and download tool in BDMIN

Figure 5: BDMIN Downloaded Data.
All the files that make up our knowledge base can be found at GitHub, so that the reader can skip the downloading and preparation phase of the information.
5.2. GPT configuration and customisation for critical minerals
When we talk about "creating a GPT," we are actually referring to the configuration and customisation of a GPT (Generative Pre-trained Transformer) based language model to suit a specific use case. In this context, we are not creating the model from scratch, but adjusting how the pre-existing model (such as OpenAI''s GPT-4) interacts and responds within a specific domain, in this case, on critical minerals.
First of all, we access the application through our browser and, if we do not have an account, we follow the registration and login process on the ChatGPT platform. As mentioned above, in order to create a GPT step-by-step, you will need to have a Plus account. However, readers who do not have such an account can work with a free account by interacting with ChatGPT through a standard conversation.
Figure 6: ChatGPT login and registration page.
Once logged in, select the "Explore GPT" option, and then click on "Create" to begin the process of creating your GPT.

Figure 7: Creation of new GPT.
The screen will display the split screen for creating a new GPT: on the left, we will be able to talk to the system to indicate the characteristics that our GPT should have, while on the left we will be able to interact with our GPT to validate that its behaviour is adequate as we go through the configuration process.

Figure 8: Screen of creating new GPT.
In the GitHub of this project, we can find all the prompts or instructions that we will use to configure and customise our GPT and that we will have to introduce sequentially in the "Create" tab, located on the left tab of our screens, to complete the steps detailed below.
The steps we will follow for the creation of the GPT are as follows:
- First, we will outline the purpose and basic considerations for our GPT so that you can understand how to use it.
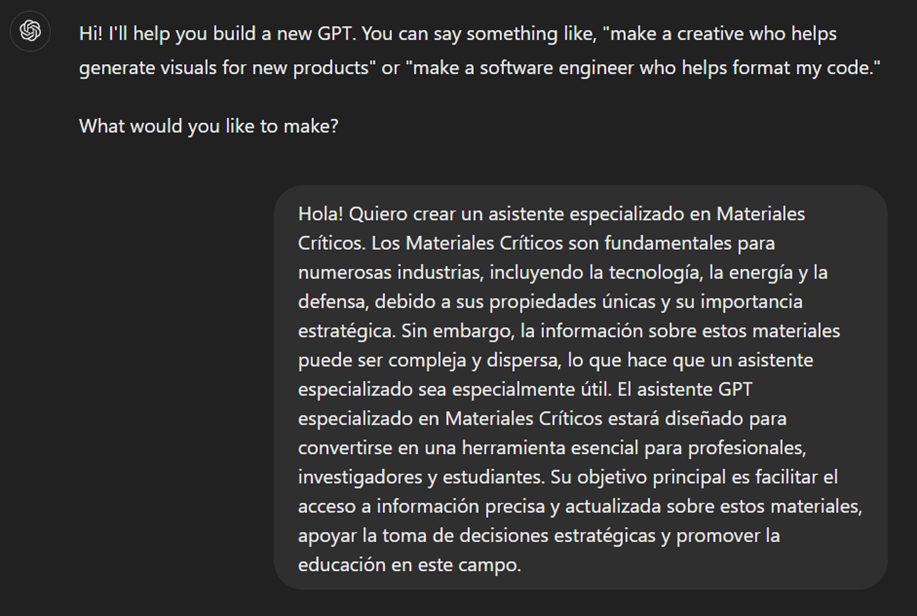
Figure 9: Basic instructions for new GPT.
2. We will then create a name and an image to represent our GPT and make it easily identifiable. In our case, we will call it MateriaGuru.

Figure 10: Name selection for new GPT.

Figure 11: Image creation for GPT.
3.We will then build the knowledge base from the information previously selected and prepared to feed the knowledge of our GPT.


Figure 12: Uploading of information to the new GPT knowledge base.
4. Now, we can customise conversational aspects such as their tone, the level of technical complexity of their response or whether we expect brief or elaborate answers.
5. Lastly, from the "Configure" tab, we can indicate the conversation starters desired so that users interacting with our GPT have some ideas to start the conversation in a predefined way.

Figure 13: Configure GPT tab.
In Figure 13 we can also see the final result of our training, where key elements such as their image, name, instructions, conversation starters or documents that are part of their knowledge base appear.
5.3. Validation and publication of GPT
Before we sign off our new GPT-based assistant, we will proceed with a brief validation of its correct configuration and learning with respect to the subject matter around which we have trained it. For this purpose, we prepared a battery of questions that we will ask MateriaGuru to check that it responds appropriately to a real scenario of use.
| # | Question | Answer |
|---|---|---|
| 1 | Which critical minerals have experienced a significant drop in prices in 2023? | Battery mineral prices saw particularly large drops with lithium prices falling by 75% and cobalt, nickel and graphite prices falling by between 30% and 45%. |
| 2 | What percentage of global solar photovoltaic (PV) capacity was added by China in 2023? | China accounted for 62% of the increase in global solar PV capacity in 2023. |
| 3 | What is the scenario that projects electric car (EV) sales to reach 65% by 2030? | The Net Zero Emissions (NZE) scenario for 2050 projects that electric car sales will reach 65% by 2030. |
| 4 | What was the growth in lithium demand in 2023? | Lithium demand increased by 30% in 2023. |
| 5 | Which country was the largest electric car market in 2023? | China was the largest electric car market in 2023 with 8.1 million electric car sales representing 60% of the global total. |
| 6 | What is the main risk associated with market concentration in the battery graphite supply chain? | More than 90% of battery-grade graphite and 77% of refined rare earths in 2030 originate in China, posing a significant risk to market concentration. |
| 7 | What proportion of global battery cell production capacity was in China in 2023? | China owned 85% of battery cell production capacity in 2023. |
| 8 | How much did investment in critical minerals mining increase in 2023? | Investment in critical minerals mining grew by 10% in 2023. |
| 9 | What percentage of battery storage capacity in 2023 was composed of lithium iron phosphate (LFP) batteries? | By 2023, LFP batteries would constitute approximately 80% of the total battery storage market. |
| 10 | What is the forecast for copper demand in a net zero emissions (NZE) scenario for 2040? | In the net zero emissions (NZE) scenario for 2040, copper demand is expected to have the largest increase in terms of production volume. |
Figure 14: Table with battery of questions for the validation of our GPT.
Using the preview section on the right-hand side of our screens, we launch the battery of questions and validate that the answers correspond to those expected.
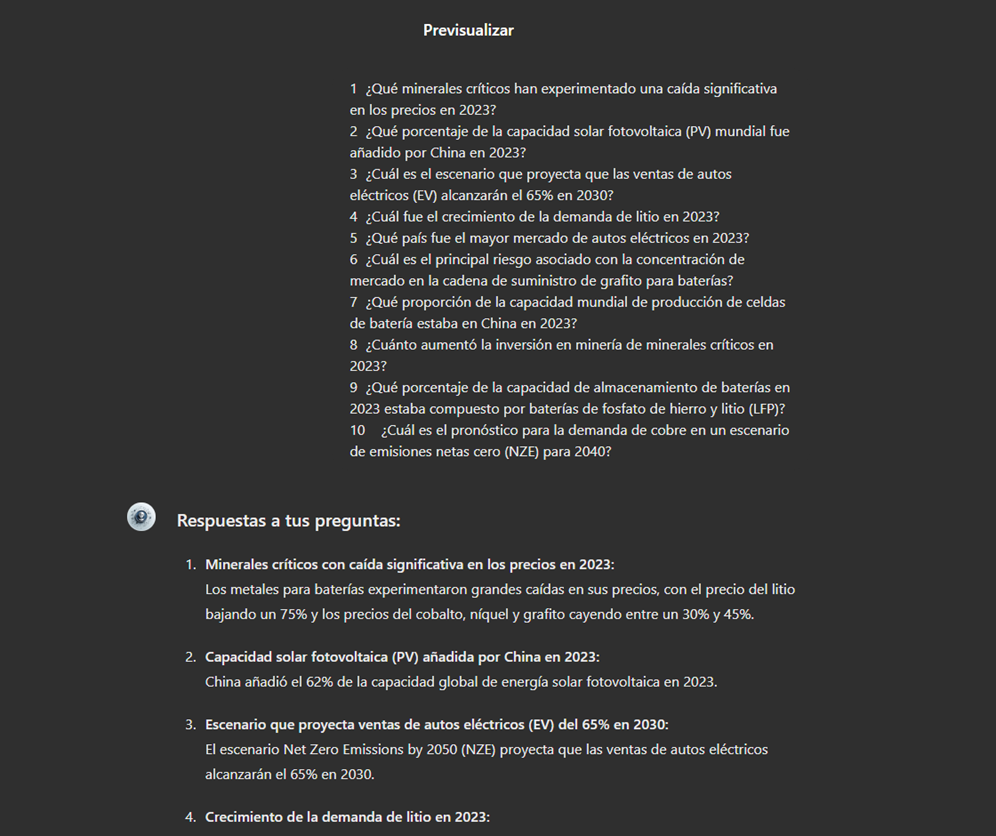
Figure 15: Validation of GPT responses.
Finally, click on the "Create" button to finalise the process. We will be able to select between different alternatives to restrict its use by other users.

Figure 16: Publication of our GPT.
6. Scenarios of use
In this section we show several scenarios in which we can take advantage of MateriaGuru in our daily life. On the GitHub of the project you can find the prompts used to replicate each of them.
6.1. Consultation of critical minerals information
The most typical scenario for the use of this type of GPTs is assistance in resolving doubts related to the topic in question, in this case, critical minerals. As an example, we have prepared a set of questions that the reader can pose to the GPT created to understand in more detail the relevance and current status of a critical material such as graphite from the reports provided to our GPT.

Figure 17: Resolution of critical mineral queries.
We can also ask you specific questions about the tabulated information provided on existing sites and evidence on Spanish territory.
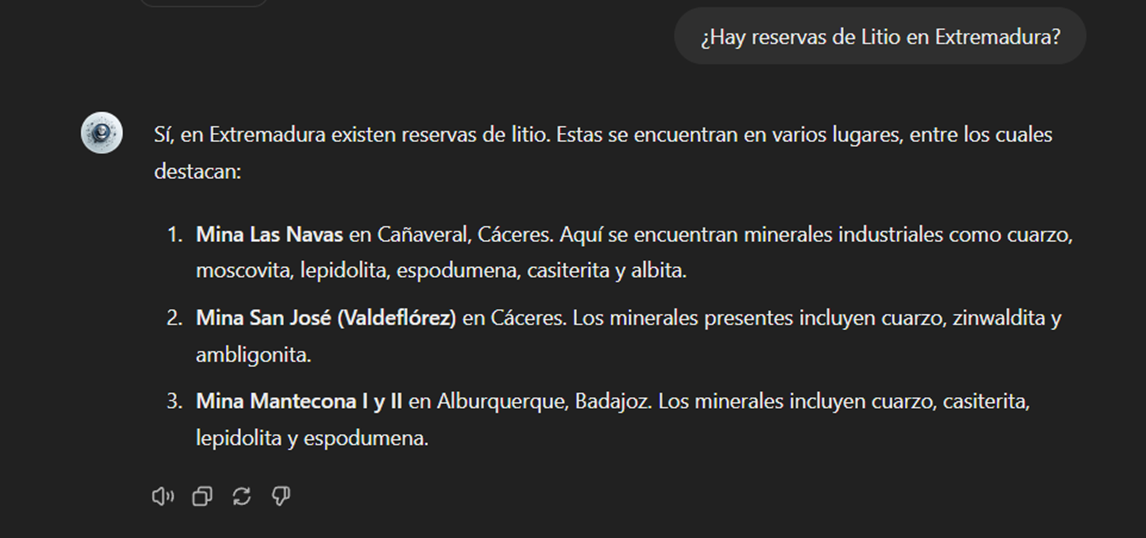
Figure 18: Lithium reserves in Extremadura.
6.2. Representation of quantitative data visualisations
Another common scenario is the need to consult quantitative information and make visual representations for better understanding. In this scenario, we can see how MateriaGuru is able to generate an interactive visualisation of graphite production in tonnes for the main producing countries.

Figure 19: Interactive visualisation generation with our GPT.
6.3. Generating mind maps to facilitate understanding
Finally, in line with the search for alternatives for a better access and understanding of the existing knowledge in our GPT, we will propose to MateriaGuru the construction of a mind map that allows us to understand in a visual way key concepts of critical minerals. For this purpose, we use the open Markmap notation (Markdown Mindmap), which allows us to define mind maps using markdown notation.

Figure 20: Generation of mind maps from our GPT
We will need to copy the generated code and enter it in a markmapviewer in order to generate the desired mind map. We facilitate here a version of this code generated by MateriaGuru.

Figure 21: Visualisation of mind maps.
7. Results and conclusions
In the exercise of building an expert assistant using GPT-4, we have succeeded in creating a specialised model for critical minerals. This wizard provides detailed and up-to-date information on critical minerals, supporting strategic decision making and promoting education in this field. We first gathered information from reliable sources such as the RMIS, the International Energy Agency (IEA), and the Spanish Geological and Mining Institute (BDMIN). We then process and structure the data appropriately for integration into the model. Validations showed that the wizard accurately answers domain-relevant questions, facilitating access to your information.
In this way, the development of the specialised critical minerals assistant has proven to be an effective solution for centralising and facilitating access to complex and dispersed information.
The use of tools such as Google Colab and Markmap has enabled better organisation and visualisation of data, increasing efficiency in knowledge management. This approach not only improves the understanding and use of critical mineral information, but also prepares users to apply this knowledge in real-world contexts.
The practical experience gained in this exercise is directly applicable to other projects that require customisation of language models for specific use cases.
8. Do you want to do the exercise?
If you want to replicate this exercise, access this this repository where you will find more information (the prompts used, the code generated by MateriaGuru, etc.)
Also, remember that you have at your disposal more exercises in the section "Step-by-step visualisations".
Content elaborated by Juan Benavente, industrial engineer and expert in technologies linked to the data economy. The contents and points of view reflected in this publication are the sole responsibility of the author.
Blog
The National Centre for Geographic Information publishes open geospatial data from the National Cartographic System, the National Geographic Institute and other organisations through web applications and mobile applications to facilitate access to and consultation of geographic data by citizens.
Geospatial data is published via web services and APIs for reuse, so in the case of high-value datasets, it can be used in a variety of ways high-value datasets such as geographic names, hydrography or addresses as required by the as required by the EUthe EU has already made these datasets available to the public by June 2024 as they are associated with major benefits for society, the environment and the economy.
But in the applications listed below, the geographic data are visualised and consulted through web services, so that for downloading the data, it is possible to use web services and APIs directly, through a platform accessible to any user with a wide range of geographic information, ranging from topographic maps to satellite images.
But not only data can be reused, also application software is reusable, for example, the Solar Energy Potential of Buildings visualiser which is based on a visualiser API, named API-CNIG and allows the same tool to be used for different thematic areas.
Some examples of applications are:

Solar Energy Potential of Buildings
Provides the photovoltaic capacity of a building according to its location and characteristics. It also provides the average over the year and a point grid to identify the best location for solar panels.
National Geographic Gazetteer
It is a toponym search engine that collects the names, official or standardised by the corresponding competent bodies , with geographical references.
Unified postal address calculator
It is a converter that allows to know the geographical coordinates (latitude and longitude in WGS84) of the postal addresses of a place, and vice versa. In both cases, the input file is a CSV file, supporting both coordinates and postal addresses.
Basic Maps of Spain
It facilitates connection to IGN services and to the CNIG download centre to obtain maps and routes. With this mobile application you can follow the routes of the National Parks or the stages of the Camino de Santiago. It allows you to plan excursions using maps, navigate and take guided tours, without the need for an internet connection after downloading data.
Map a la carte
It allows you to create a customised map using the printed series of the National Topographic Map at scales 1:25.000 and 1:50.000. It offers the possibility of defining its area, incorporating contents, personalising the cover, obtaining a pdf file and even acquiring paper copies by post.
IGN Earthquakes
It allows the reception and visualisation of all seismic events in Spain and its surroundings. It provides the distance to the epicentre of the seismic event and epicentral parameters, as well as the geolocation of the user's position and the epicentre.
Maps of Spain
It is a free mobile viewer ideal for hiking, cycling, running, skiing, etc., which uses as background cartography the services of the National Geographic Institute and another set of services from other Ministries, such as the Cadastral information of the plots provided by the General Directorate of Cadastre.
Camino de Santiago
It includes information of a cultural and practical nature on each of the stages (hostels, monuments, etc.), as well as a complete Pilgrim's Guide detailing what you should know before starting out on any of the routes. This application is based on ESRI software.
National Parks
Displays information on the history, fauna, flora and excursions in Spain's National Parks. It includes hundreds of points of interest such as information centres, accommodation, viewpoints, refuges and even routes through the parks, indicating their duration and difficulty. The app is available for download on Android e iOS. This application is based on ESRI software.
GeoSapiens IGN
It presents interactive maps, free to use and free of charge, to study the physical and political geography of Spain and the world. It consists of different games relating to the whole of Spain or by autonomous communities, the whole world and by continent.
In addition to the applications developed by the CNIG, which are also presented in this video this videothere are many other digital solutions developed by third parties that reuse open geospatial data to offer a service to society. For example, in the list of data reusing applications.gob.es you can find from a map that shows the fires that are active in Spain in real time in Spain in real time to an app that shows where the parking spaces for people with reduced mobility parking spaces for people with reduced mobility in each town.
In short, anyone can make use of the open geographic data of the National Cartographic System, the National Geographic Institute and other bodies published by the CNIG , thus extending the advantages offered by the availability of open geographic data. do you know of any other application resulting from the reuse of open data? You can send it to us at dinamizacion@datos.gob.es
Blog
The promotion of energy efficiency and sustainability is one of the priorities of the European Union and Spain, as reflected in the European Green Pact. The availability of open data related to energy production, distribution and consumption allows governments, businesses and citizens to access essential information to address the challenges of climate change and promote a more sustainable future.
In this post, we explore examples of use cases that show the impact of open data on the energy landscape, as well as sources of interest where to find quality data on the subject.
Open data use cases in the energy sector
EUR 79,600 million. This is the estimated annual savings from open data in the energy sector in the European Union, according to the report "The Economic Impact of Open Data: Opportunities for Value Creation in Europe (2020)". This is possible thanks to multiple projects and applications based on open data that affect various areas.
-
More efficient resource planning
Access to open data on available energy resources makes it possible to identify the most suitable areas to develop projects, ensuring that the use of available natural resources is maximised. For example, in the Baltic Sea, natural gas infrastructure is being expanded to meet the region's growing needs. By taking advantage of Copernicus' advanced data together with its own monitoring and forecasting services (including data on wind, waves, sea water level, currents, sea ice, etc.), the Estonian and Finnish governments were able to carry out more efficient planning for the installation of a new plant.
Likewise, the National Geographic Institute has made available to users a viewer to find out the incidence of the sun and determine the best location for solar panels. Thanks to this viewer, different locations and orientations can be analysed to identify the position that maximises solar energy collection.
-
More responsible and efficient consumption
Open data also includes information on the use and performance of different energies. The Junta de Castilla y León, for example, has a dataHub that collects information from more than 1,500 consumer centres. This dashboard allows the analysis by type of energy (electricity, gas, diesel) and by geographical location (educational centres, health centres, administrative offices, hospitals, etc.). This allows them to compare consumption between the buildings they manage and make efficiency decisions, which has resulted in savings of €2M per year since 2015 on the fixed cost of electricity alone.
The Urban3r viewer allows the visualisation of different indicators on the current state of the building, the energy demand data of residential buildings in their current state and after energy refurbishment, as well as the estimated costs of these interventions, facilitating decision making.
Commercial solutions are also available on the market for this purpose, such as Opower, a tool that uses artificial intelligence to provide personalised information to each customer, identifying and suggesting the replacement of inefficient heating and cooling systems. Another example is uplight, which performs energy efficiency analyses for commercial buildings, utilities and government entities with operational and retrofit recommendations to reduce consumption. These examples highlight the business opportunity in this niche market.
-
Possibility to choose cheaper suppliers
Open data provides detailed information on tariffs and prices of different energy suppliers. This transparency allows consumers to easily compare offers and choose the option that best suits their needs. This is the case of applications for choosing petrol stations, such as Mejorgasolinera.com or Precioil.es, which offer detailed information on the country's petrol stations and allow filtering by brand, location or road and sorted by price and distance. We also find similar solutions for the electricity market, such as Tarifaluzhora.
The National Commission for Markets and Competition (CNMC in Spanish) also has a Energy Offers Comparator (CNMC), which allows you to consult gas and electricity offers.
-
Transparency, accountability and harm minimisation
The publication of open data not only allows citizens and organisations to access detailed information on energy production, distribution and consumption. It also increases transparency in resource management and promotes accountability of energy companies and governments.
To this end, OpenOil was born, which aims to reduce the opacity of the oil industry and thereby increase the accountability of oil companies. It provides an open data framework for natural resource management at the supranational level, as well as consultancy and training services for the creation of natural resource management mechanisms and processes.
In order to minimise the impact of oil spills in the oceans, the Spanish National Research Council (CSIC), in collaboration with Digital Earth Solutions (DES), has developed a unique software, capable of predicting in a few minutes and with great precision the geographic evolution of any oil slick, forecasting its future trajectory in the ocean or studying its movement backwards in time to find its origin.
Where can I find energy data?
If you are thinking of developing such a solution, you are in luck, because there is a wealth of open energy data available on the web.
If you are looking for data from Spain, in addition to datos.gob.es, you can visit the following websites:
- Institute for Energy Diversification and Saving (IDAE). IDAE provides sectorised statistics and energy balances for both primary and final energy, in thousands of tonnes of oil equivalent (ktoe). In total, 69 energy types and 128 energy flows and/or sectors are detailed. The data currently available cover the historical series from 1990 to 2022.
- Red Eléctrica de España. REData is the website of Red eléctrica where we can find national statistical series related to the Spanish electricity system, updated month by month. In this space you can also access information on demand, generation, balancing, exchange, transmission and electricity markets, whose data are available through a REST API. Depending on the nature of the dataset, we can find data that are updated annually, quarterly or even daily. Another useful tool of Red Eléctrica is ESIOS, with updated data on generation, consumption, market, prices, etc.
- National Commission for Markets and Competition (CNMC): The CNMC Data open data portal provides direct access to data and indicators relating to the energy markets overseen by the CNMC: electricity, natural gas and oil products. We can find statistics on market prices, the number of users benefiting from the social bonus or the percentage of renewable energy in the total amount, among other values. Data are updated regularly, on a monthly, quarterly or annual basis.
A wealth of information is also available worldwide:
- European Union. On the EU's energy policy website, we find various data and analyses ranging from oil price developments in individual member states to possible energy market scenarios for 2030 and 2050, among many others. In addition, the European Commission's Directorate-General for Energy produces energy statistical fact sheets every two years, based on data from Eurostat and EU greenhouse gas monitoring. The data is broken down by country, which allows for easy comparisons. Also available is the ENSPRESO database, which focuses on the wind, solar and biomass sectors.
- International Energy Agency (IEA). IEA is an international organisation created in 1974 by the Organisation for Economic Co-operation and Development (OECD) to secure energy supplies. Although some of the datasets offered are paid for, open data can also be found on the website and can be downloaded upon registration.
- Other countries: At the international level, we can find detailed portals by country, such as the US Open Energy Data Initiative (OEDI) or the UK.
These are just a few examples of solutions and data sources that highlight the impact that opening up energy data can have on our environment, both in terms of cost savings and efficiency gains. We invite you to share other open data solutions and portals in comments.
Blog
The carbon footprint is a key indicator for understanding the environmental impact of our actions. It measures the amount of greenhouse gas emissions released into the atmosphere as a result of human activities, most notably the burning of fossil fuels such as oil, natural gas and coal. These gases, which include carbon dioxide (CO2), methane (CH4) and nitrous oxide (N2O), contribute to global warming by trapping heat in the earth's atmosphere.
Many actions are being carried out by different organisations to try to reduce the carbon footprint. These include those included in the European Green Pact or the Sustainable Development Goals. But this is an area where every small action counts and, as citizens, we can also contribute to this goal through small changes in our lifestyles.
Moreover, this is an area where open data can have a major impact. In particular, the report "The economic impact of open data: opportunities for value creation in Europe (2020)" highlights how open data has saved the equivalent of 5.8 million tonnes of oil every year in the European Union by promoting greener energy sources. This include 79.6 billion in cost savings on energy bills.
This article reviews some solutions that help us measure our carbon footprint to raise awareness of the situation, as well as useful open data sources .
Calculators to know your carbon footprint
The European Union has a web application where everyone can analyse the life cycle of products and energy consumed in five specific areas (food, mobility, housing, household appliances and household goods), based on 16 environmental impact indicators. The user enters certain data, such as his energy expenditure or the details of his vehicle, and the solution calculates the level of impact. The website also offers recommendations for improving consumption patterns. It was compiled using data from Ecoinvent y Agrifoot-print, as well as different public reports detailed in its methodology.
The UN also launched a similar solution, but with a focus on consumer goods. It allows the creation of product value chains by mapping the materials, processes and transports that have been used for their manufacture and distribution, using a combination of company-specific activity data and secondary data. The emission factors and datasets for materials and processes come from a combination of data sources such as Ecoinvent, the Swedish Environment Institute, DEFRA (UK Department for Environment, Food and Rural Affairs), academic papers, etc. The calculator is also linked to the the Platform for carbon footprint offsetting of the United Nations. This allows users of the application to take immediate climate action by contributing to UN green projects.
Looking at Spain, the Ministry for Ecological Transition and the Demographic Challenge has several tools to facilitate the calculation of the carbon footprint aimed at different audiences: organisations, municipalities and farms. They take into account both direct emissions and indirect emissions from electricity consumption. Among other data sources, it uses information from National Greenhouse Gas Inventory. It also provides an estimate of the carbon dioxide removals generated by an emission reduction project.
Another tool linked to this ministry is ComidaAPrueba, launched by the Fundación Vida Sostenible and aimed at finding out the sustainability of citizens' diets. The mobile application, available for both iOs and Android, allows us to calculate the environmental footprint of our meals to make us aware of the impact of our actions. It also proposes healthy recipes that help us to reduce food waste.
But not all actions of this kind are driven by public bodies or non-profit associations. The fight against the deterioration of our environment is also a niche market offering business opportunities. Private companies also offer solutions for calculating the carbon footprint, such as climate Hero, which is based on multiple data sources.
Data sources to feed carbon footprint calculators
As we have seen, in order to make these calculations, these solutions need to be based on data that allow them to calculate the relationship between certain consumption habits and the emissions generated. To do this, they draw on a variety of data sources, many of which are open. In Spain, for example, we find:
- National Statistics Institute (INE). The INE provides data on atmospheric emissions by branch of activity, as well as for households. It can be filtered by gas type and its equivalence in thousands of tonnes of CO2. It also provides data on the historical evolution of the achievement of carbon footprint reduction targets, which are based on the National Inventories of Emissions to the Atmosphere, prepared by the Ministry for Ecological Transition and the Demographic Challenge.
- Autonomous Communities. Several regional governments carry out inventories of pollutant emissions into the atmosphere. This is the case of the Basque Country and the Community of Madrid. Some regions also publish open forecast data, such as the Canary Islands, which provides projections of climate change in tourism or drought situations.
Other international data services to consider are:
- EarthData. This service provides full and open access to NASA' s collection of Earth science data to understand and protect our planet. This web provides links to commonly used data on greenhouse gases, including carbon dioxide, methane, nitrous oxide, ozone, chlorofluorocarbons and water vapour, as well as information on their environmental impact.
- Eurostat. The Statistical Office of the European Commission regularly publishes estimates of quarterly greenhouse gas emissions in the European Union, broken down by economic activity. The estimates cover all quarters from 2010 to the present.
- Life Cycle Assessment (LCA). This platform is the EU's knowledge base on sustainable production and consumption. It provides a product life cycle inventory for supply chain analysis. Data from business associations and other sources related to energy carriers, transport and waste management are used.
- Our World in Data. One of the most widely used datasets of this portal contains information on CO2 and greenhouse gas emissions through key metrics. Various primary data sources such as the US Energy Information Agency and The Global Carbon Project have been used for its elaboration. All raw data and scripts are available in their GitHub repository.
These repositories are just a sample, but there are many more sources whit valuable data to help us become more aware of the climate situation we live in and the impact our small day-to-day actions have on our planet. Reducing our carbon footprint is crucial to preserving our environment and ensuring a sustainable future. And only together will we be able to achieve our goals.
Documentación
1. Introduction
Visualisations are graphical representations of data that allow to communicate, in a simple and effective way, the information linked to the data. The visualisation possibilities are very wide ranging, from basic representations such as line graphs, bar charts or relevant metrics, to interactive dashboards.
In this section of "Step-by-Step Visualisations we are regularly presenting practical exercises making use of open data available at datos.gob.es or other similar catalogues. They address and describe in a simple way the steps necessary to obtain the data, carry out the relevant transformations and analyses, and finally draw conclusions, summarizing the information.
Documented code developments and free-to-use tools are used in each practical exercise. All the material generated is available for reuse in the GitHub repository of datos.gob.es.
In this particular exercise, we will explore the current state of electric vehicle penetration in Spain and the future prospects for this disruptive technology in transport.
Access the data lab repository on Github.
Run the data pre-processing code on Google Colab.
In this video (available with English subtitles), the author explains what you will find both on Github and Google Colab.
2. Context: why is the electric vehicle important?
The transition towards more sustainable mobility has become a global priority, placing the electric vehicle (EV) at the centre of many discussions on the future of transport. In Spain, this trend towards the electrification of the car fleet not only responds to a growing consumer interest in cleaner and more efficient technologies, but also to a regulatory and incentive framework designed to accelerate the adoption of these vehicles. With a growing range of electric models available on the market, electric vehicles represent a key part of the country's strategy to reduce greenhouse gas emissions, improve urban air quality and foster technological innovation in the automotive sector.
However, the penetration of EVs in the Spanish market faces a number of challenges, from charging infrastructure to consumer perception and knowledge of EVs. Expansion of the freight network, together with supportive policies and fiscal incentives, are key to overcoming existing barriers and stimulating demand. As Spain moves towards its sustainability and energy transition goals, analysing the evolution of the electric vehicle market becomes an essential tool to understand the progress made and the obstacles that still need to be overcome.
3. Objective
This exercise focuses on showing the reader techniques for the processing, visualisation and advanced analysis of open data using Python. We will adopt a "learning-by-doing" approach so that the reader can understand the use of these tools in the context of solving a real and topical challenge such as the study of EV penetration in Spain. This hands-on approach not only enhances understanding of data science tools, but also prepares readers to apply this knowledge to solve real problems, providing a rich learning experience that is directly applicable to their own projects.
The questions we will try to answer through our analysis are:
- Which vehicle brands led the market in 2023?
- Which vehicle models were the best-selling in 2023?
- What market share will electric vehicles absorb in 2023?
- Which electric vehicle models were the best-selling in 2023?
- How have vehicle registrations evolved over time?
- Are we seeing any trends in electric vehicle registrations?
- How do we expect electric vehicle registrations to develop next year?
- How much CO2 emission reduction can we expect from the registrations achieved over the next year?
4. Resources
To complete the development of this exercise we will require the use of two categories of resources: Analytical Tools and Datasets.
4.1. Dataset
To complete this exercise we will use a dataset provided by the Dirección General de Tráfico (DGT) through its statistical portal, also available from the National Open Data catalogue (datos.gob.es). The DGT statistical portal is an online platform aimed at providing public access to a wide range of data and statistics related to traffic and road safety. This portal includes information on traffic accidents, offences, vehicle registrations, driving licences and other relevant data that can be useful for researchers, industry professionals and the general public.
In our case, we will use their dataset of vehicle registrations in Spain available via:
- Open Data Catalogue of the Spanish Government.
- Statistical portal of the DGT.
Although during the development of the exercise we will show the reader the necessary mechanisms for downloading and processing, we include pre-processed data
in the associated GitHub repository, so that the reader can proceed directly to the analysis of the data if desired.
*The data used in this exercise were downloaded on 04 March 2024. The licence applicable to this dataset can be found at https://datos.gob.es/avisolegal.
4.2. Analytical tools
- Programming language: Python - a programming language widely used in data analysis due to its versatility and the wide range of libraries available. These tools allow users to clean, analyse and visualise large datasets efficiently, making Python a popular choice among data scientists and analysts.
- Platform: Jupyter Notebooks - ia web application that allows you to create and share documents containing live code, equations, visualisations and narrative text. It is widely used for data science, data analytics, machine learning and interactive programming education.
-
Main libraries and modules:
- Data manipulation: Pandas - an open source library that provides high-performance, easy-to-use data structures and data analysis tools.
- Data visualisation:
- Matplotlib: a library for creating static, animated and interactive visualisations in Python..
- Seaborn: a library based on Matplotlib. It provides a high-level interface for drawing attractive and informative statistical graphs.
- Statistics and algorithms:
- Statsmodels: a library that provides classes and functions for estimating many different statistical models, as well as for testing and exploring statistical data.
- Pmdarima: a library specialised in automatic time series modelling, facilitating the identification, fitting and validation of models for complex forecasts.
5. Exercise development
It is advisable to run the Notebook with the code at the same time as reading the post, as both didactic resources are complementary in future explanations
The proposed exercise is divided into three main phases.
5.1 Initial configuration
This section can be found in point 1 of the Notebook.
In this short first section, we will configure our Jupyter Notebook and our working environment to be able to work with the selected dataset. We will import the necessary Python libraries and create some directories where we will store the downloaded data.
5.2 Data preparation
This section can be found in point 2 of the Notebookk.
All data analysis requires a phase of accessing and processing to obtain the appropriate data in the desired format. In this phase, we will download the data from the statistical portal and transform it into the format Apache Parquet format before proceeding with the analysis.
Those users who want to go deeper into this task, please read this guide Practical Introductory Guide to Exploratory Data Analysis.
5.3 Data analysis
This section can be found in point 3 of the Notebook.
5.3.1 Análisis descriptivo
In this third phase, we will begin our data analysis. To do so,we will answer the first questions using datavisualisation tools to familiarise ourselves with the data. Some examples of the analysis are shown below:
- Top 10 Vehicles registered in 2023: In this visualisation we show the ten vehicle models with the highest number of registrations in 2023, also indicating their combustion type. The main conclusions are:
- The only European-made vehicles in the Top 10 are the Arona and the Ibiza from Spanish brand SEAT. The rest are Asians.
- Nine of the ten vehicles are powered by gasoline.
- The only vehicle in the Top 10 with a different type of propulsion is the DACIA Sandero LPG (Liquefied Petroleum Gas).
Figure 1. Graph "Top 10 vehicles registered in 2023"
- Market share by propulsion type: In this visualisation we represent the percentage of vehicles registered by each type of propulsion (petrol, diesel, electric or other). We see how the vast majority of the market (>70%) was taken up by petrol vehicles, with diesel being the second choice, and how electric vehicles reached 5.5%.
Figure 2. Graph "Market share by propulsion type".
- Historical development of registrations: This visualisation represents the evolution of vehicle registrations over time. It shows the monthly number of registrations between January 2015 and December 2023 distinguishing between the propulsion types of the registered vehicles, and there are several interesting aspects of this graph:
- We observe an annual seasonal behaviour, i.e. we observe patterns or variations that are repeated at regular time intervals. We see recurring high levels of enrolment in June/July, while in August/September they decrease drastically. This is very relevant, as the analysis of time series with a seasonal factor has certain particularities.
-
The huge drop in registrations during the first months of COVID is also very remarkable.
-
We also see that post-covid enrolment levels are lower than before.
-
Finally, we can see how between 2015 and 2023 the registration of electric vehicles is gradually increasing.
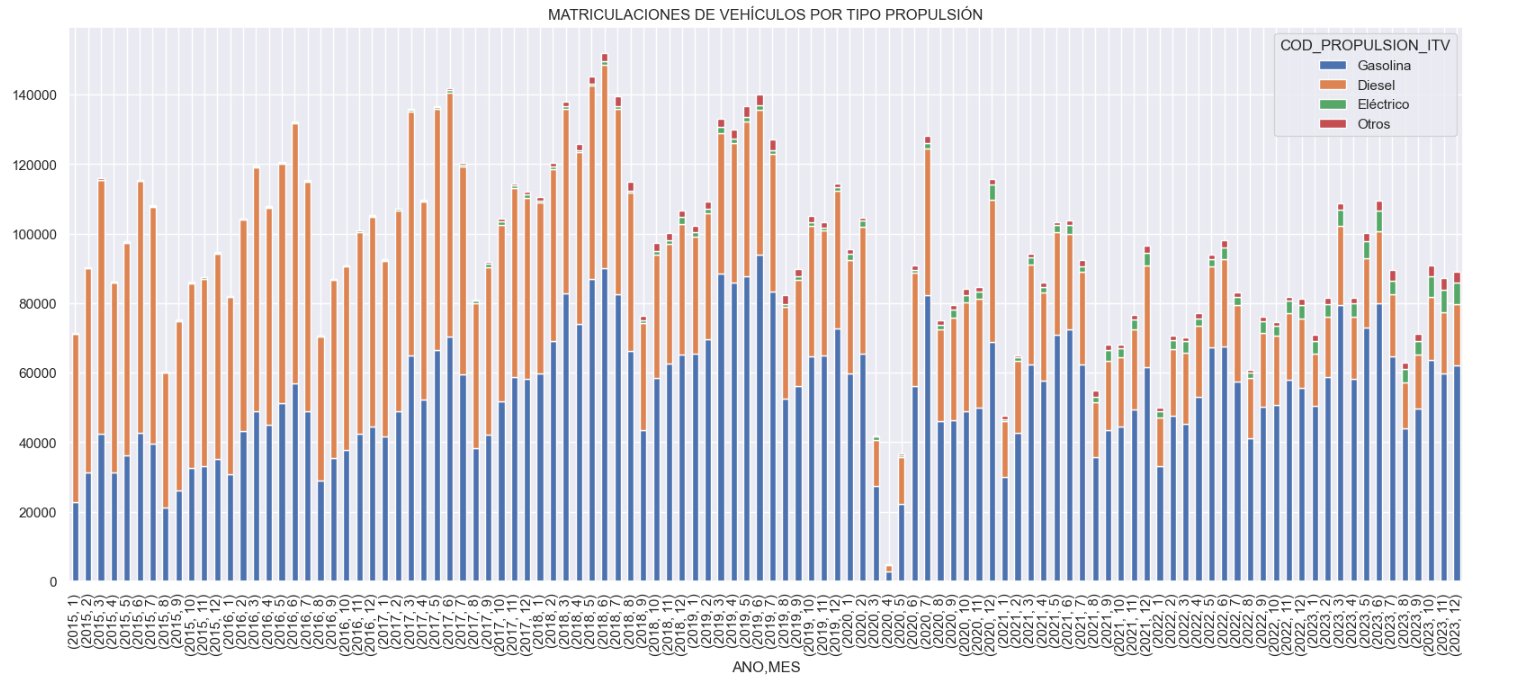
Figure 3. Graph "Vehicle registrations by propulsion type".
- Trend in the registration of electric vehicles: We now analyse the evolution of electric and non-electric vehicles separately using heat maps as a visual tool. We can observe very different behaviours between the two graphs. We observe how the electric vehicle shows a trend of increasing registrations year by year and, despite the COVID being a halt in the registration of vehicles, subsequent years have maintained the upward trend.
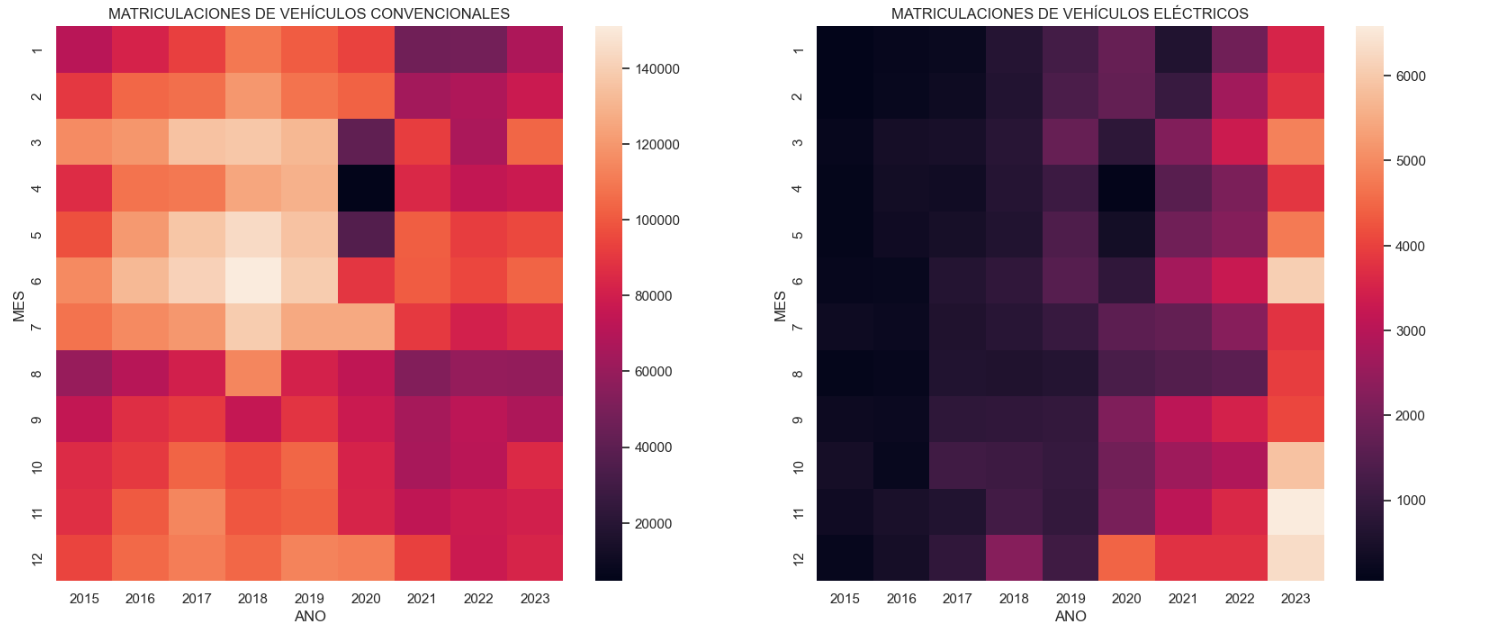
Figure 4. Graph "Trend in registration of conventional vs. electric vehicles".
5.3.2. Predictive analytics
To answer the last question objectively, we will use predictive models that allow us to make estimates regarding the evolution of electric vehicles in Spain. As we can see, the model constructed proposes a continuation of the expected growth in registrations throughout the year of 70,000, reaching values close to 8,000 registrations in the month of December 2024 alone.
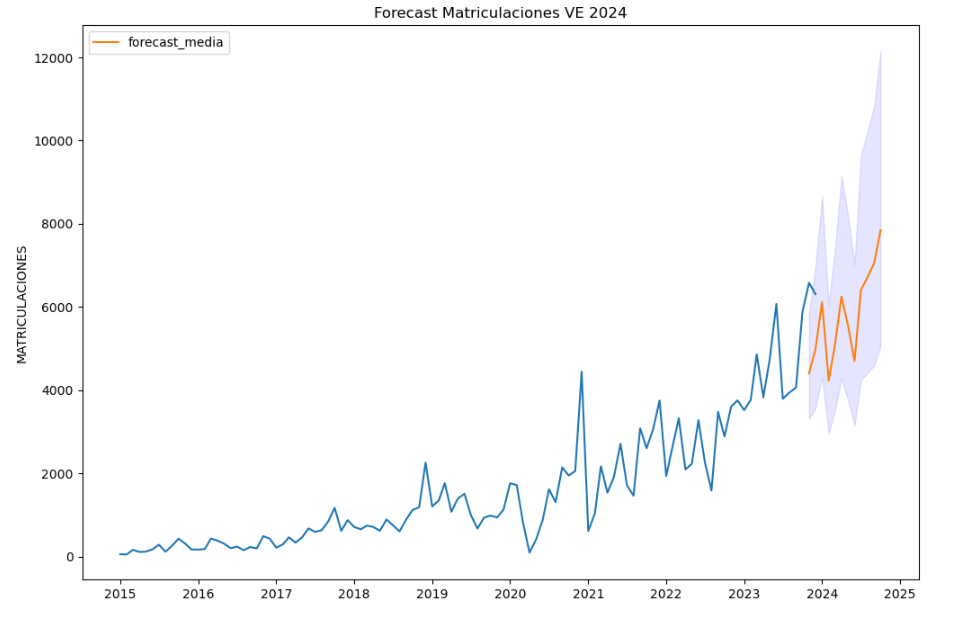
Figure 5. Graph "Predicted electric vehicle registrations".
5. Conclusions
As a conclusion of the exercise, we can observe, thanks to the analysis techniques used, how the electric vehicle is penetrating the Spanish vehicle fleet at an increasing speed, although it is still at a great distance from other alternatives such as diesel or petrol, for now led by the manufacturer Tesla. We will see in the coming years whether the pace grows at the level needed to meet the sustainability targets set and whether Tesla remains the leader despite the strong entry of Asian competitors.
6. Do you want to do the exercise?
If you want to learn more about the Electric Vehicle and test your analytical skills, go to this code repository where you can develop this exercise step by step.
Also, remember that you have at your disposal more exercises in the section "Step by step visualisations" "Step-by-step visualisations" section.
Content elaborated by Juan Benavente, industrial engineer and expert in technologies linked to the data economy. The contents and points of view reflected in this publication are the sole responsibility of the author.
Application
It is a website that reuses open data to report on how green spaces and trees are distributed in the city of Valencia.
The information on the website is divided into three areas:
- Valencia city
- Municipal area of Valencia
- Data on trees in Valencia city
The data shown on Valencia Verde comes from open data catalogs on green spaces and trees available at Ajuntament de València - Dades Obertes, census data from the Oficina d'Estadística de València and information from the Institut Cartogràfric Valencià.
The last date for obtaining the aforementioned data, and for updating this website, is March 2024.
Thanks to this information, visualizations are created in which users can see, for example, the percentage of green area per neighborhood/district and the m2 of green area per inhabitant in each neighborhood/district. This application is a space that allows to know, in a clear and interactive way, the trees, green areas and their relationship with the population and neighborhoods of Valencia.