Application
This application shows the location of charging stations for electric vehicles within the Community of Castilla y León. The user can select the province of interest and access information on the available stations. For each station, various information is provided, such as its location, the supplier company, the number of charging stations and the available connectors.
In addition, within the app the user can also find information on incentive programmes for electric mobility, such as the MOVES III Plan.
The geographical data of these chargers have been obtained from the servers of the public platform of Open Data of Castilla y León.
Translated with DeepL.com (free version)
Documentación
The Sustainable Development Goals (SDGs) are a set of targets adopted by the international community aimed at addressing the most pressing challenges of our time. These goals were born simultaneously with the Global Partnership for Sustainable Development Data and the International Open Data Charter, which provided a coalition of experts willing to harness the benefits of open data for the new development agenda.
In this regard, open data plays a very relevant role within the development agenda as indicators of progress towards the SDGs, as they allow measuring and evaluating their progress, as well as improving accountability through sharing that data with the rest of the community, providing great value in multiple ways:
- Facilitating decision-making when designing policies and strategies to help meet the objectives;
- Identifying inequalities and specific challenges among different regions or population groups;
- Improving efficiency in policy and program implementation;
- As an engine of innovation through research and development.
Today, there are large global databases, both generalist and thematic, that we can use for these purposes, in addition to all the national data sources available in our own country. However, there is still a long way to go in this regard: the proportion of SDG indicators that are conceptually clear and have good national coverage is still 66%, according to the latest SDG progress report published in 2023. This leads us to continue facing data gaps in vital areas such as poverty, hunger, education, equality, sustainability, climate, seas, and justice, among others. Additionally, there is also a fairly general and significant lack of data disaggregated by age and/or sex, making it very difficult to properly monitor the potential progress of the objectives regarding the most vulnerable population groups.
This report takes a journey through the dual role that open data plays in supporting national and global progress in achieving the SDGs. The first part of the report focuses on the better-known role of open data as mere indicators when measuring progress towards the objectives, while the second part addresses its role as a key tool and fundamental raw material for the development of society in general and for the achievement of the objectives themselves in particular. To this end, it explores which datasets could have the greatest potential in each case, showing some practical examples, both national and at the European level, in various specific development objectives.
If you want to learn more about the content of this report, you can watch the interview with its author.
Blog
The energy transition is also a transition of raw materials. When we imagine a sustainable future, we conceive it based on a series of strategic sectors such as renewable energies or electric mobility. Similarly, we imagine a connected and digital future, where new innovations and business models related to the fourth industrial revolution allow us to solve global challenges such as food shortages or access to education. In short, we focus on technologies that help us improve our quality of life.
Why are critical minerals important?
These sectors depend on a series of key technologies, such as energy storage batteries, wind turbines, solar panels, electrolyzers, drones, robots, data transmission networks, electronic devices and space satellites. These are technologies that in recent years have undergone a great technological evolution and an enormous growth in demand worldwide. If we analyze the development forecasts to 2030, we can expect annual growth of at least double digits for many of them, as shown in Figure 1.
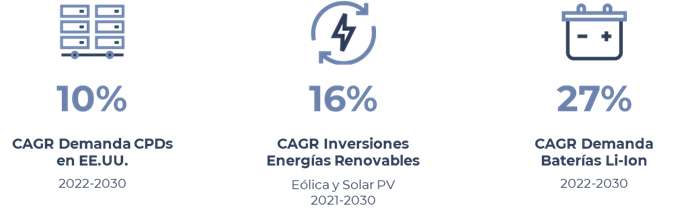
Figure 1: Expected growth up to 2030 of some of the key technologies for strategic sectors. Source: McKinsey (image 1, image 2, image 3)
However, as can be seen in Figure 2, many of these future technologies are highly dependent on a set of critical raw materials necessary for their development. Indium and gallium are key to the manufacture of energy-efficient LED lighting, silicon is indispensable for the manufacture of microchips and semiconductors, and the platinum group of metals (such as iridium, palladium, platinum rhodium or ruthenium) are used in catalysts for hydrogen electrolyzers.
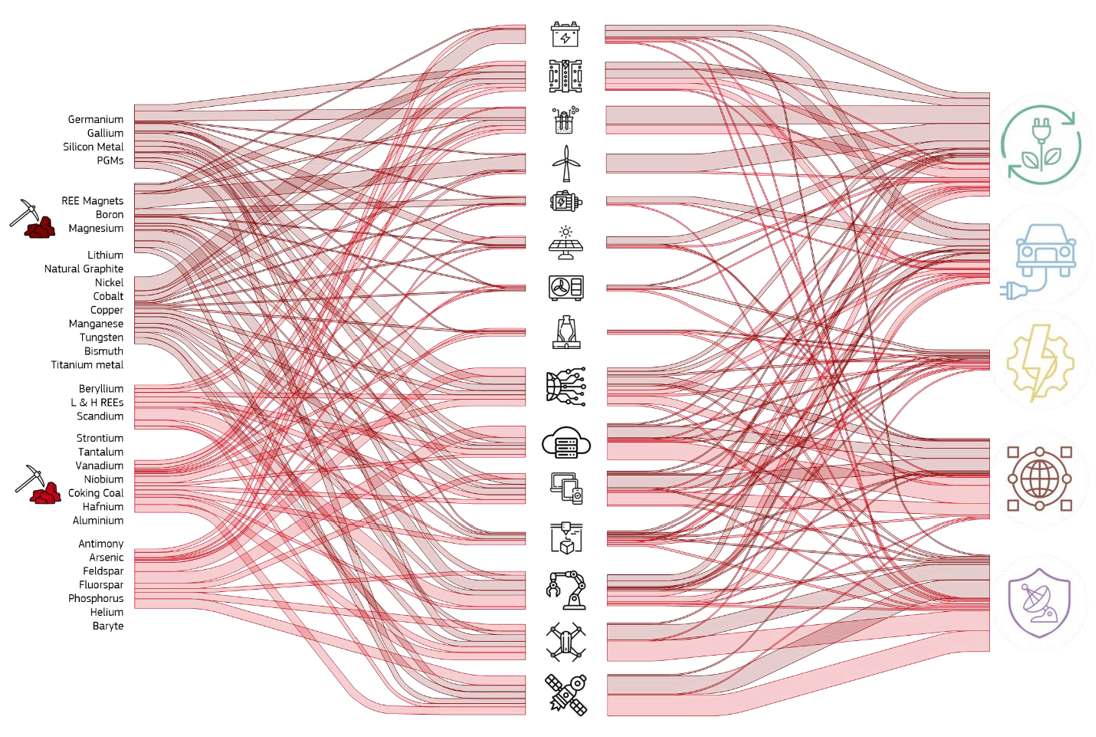
Figure 2: Semi-quantitative representation of raw material flows to the fifteen key technologies and five strategic sectors. Source: JRC Study
So, when does a material become critical? There are several factors that allow us to determine whether a raw material is considered critical:
- Its world reserves are scarce
- There are no alternative materials that can perform their function (their properties are unique or very unique).
- They are indispensable materials for key economic sectors of the future, and/or their supply chain is high-risk.
In the words of Margrethe Vestager, Executive Vice-President of the European Commission, "without a secure and sustainable supply of critical raw materials, there will be no green (sustainable) and industrial transition".
Research into sources of critical minerals data
In order to know in detail the situation of public minerals in Europe, we need to locate quality data. A task for which we will have to look into several sources.
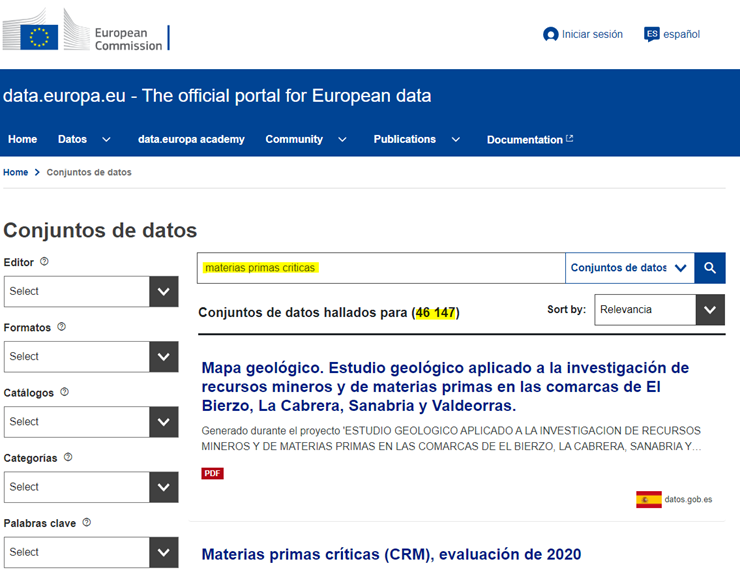
First of all, we go to the European open data portal. From its search engine, in a first iteration, we see that there are more than 46,000 datasets for the query "critical raw materials" (Figure 3).
After a first analysis of the available data categories, we adjusted the filters until we narrowed down the datasets of interest to 190 (Figure 4). Particular attention is drawn to the data published by the JRC (European Commission Joint Research Center) and, in particular, to the dataset entitled Critical Raw Materials (CRM), 2020 assessment.
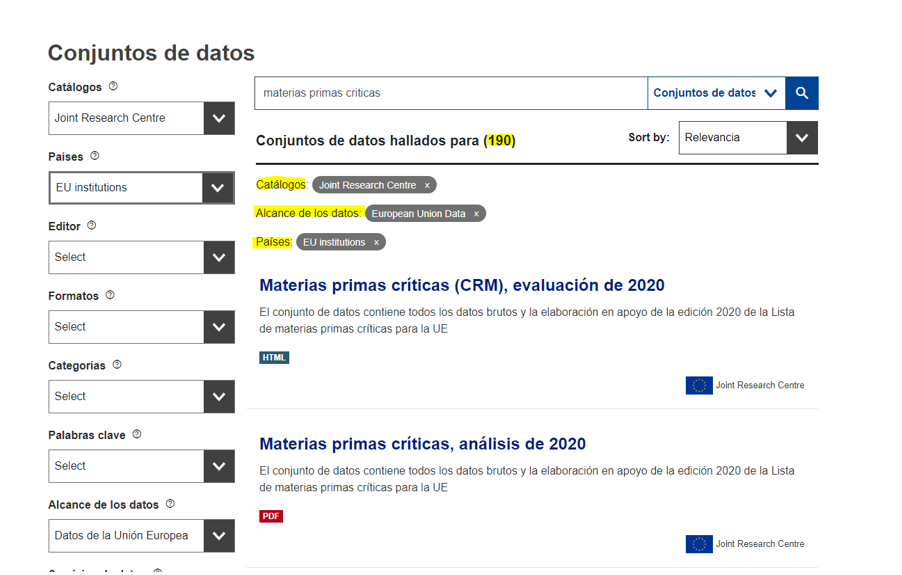
Figure 4: Second search for critical raw materials in the European data portal.
This dataset contains a direct link to a web portal, the RMIS (Raw Material Information System), which is actually the European Commission's reference knowledge base on raw materials through which we can access very relevant data and analysis.
Figure 5: RMIS - European Commission's knowledge base for raw materials
Through the RMIS, we find a very interesting publication for any study on the subject. Although this publication is in PDF format, it allows us to access the list of strategic, critical and non-critical materials identified by the European Commission indicating their level of criticality and their use in different key technologies as shown in Figure 6.
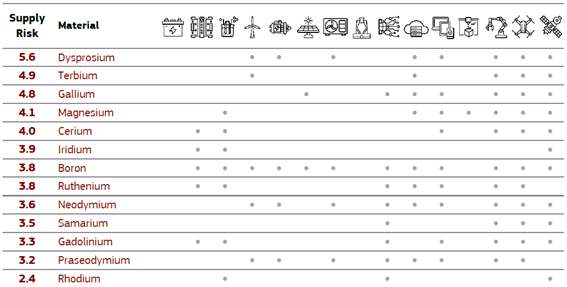
Figure 6: Table of strategic, critical and non-critical raw materials used different key technologies contained in the PDF file. Source: Supply chain analysis and material demand forecast in strategic technologies and sectors in the EU - A foresight study, JRC 2023.
Continuing our exploration, in this case in search of data on mineral reserves in the European continent, we found the European Gelological Data Infrastructure (EDGI) platform, which has an extensive catalog with more than 5,700 datasets and geological services. In our case, after performing a search in its data catalog, we selected three datasets containing interesting information in terms of findings of critical lithium, cobalt and graphite minerals (Figure 7).

Figure 7: Searching for datasets in the EDGI catalog
From the EDGI viewer, we can view the contents of these three datasets before downloading them in GeoJSON format (Figure 8). The three datasets have been originated from the FRAME project (Forecasting And Assessing Europe's Strategic Raw Materials Needs), in which multiple European entities participate, including the Geological and Mining Institute of Spain (IGME).
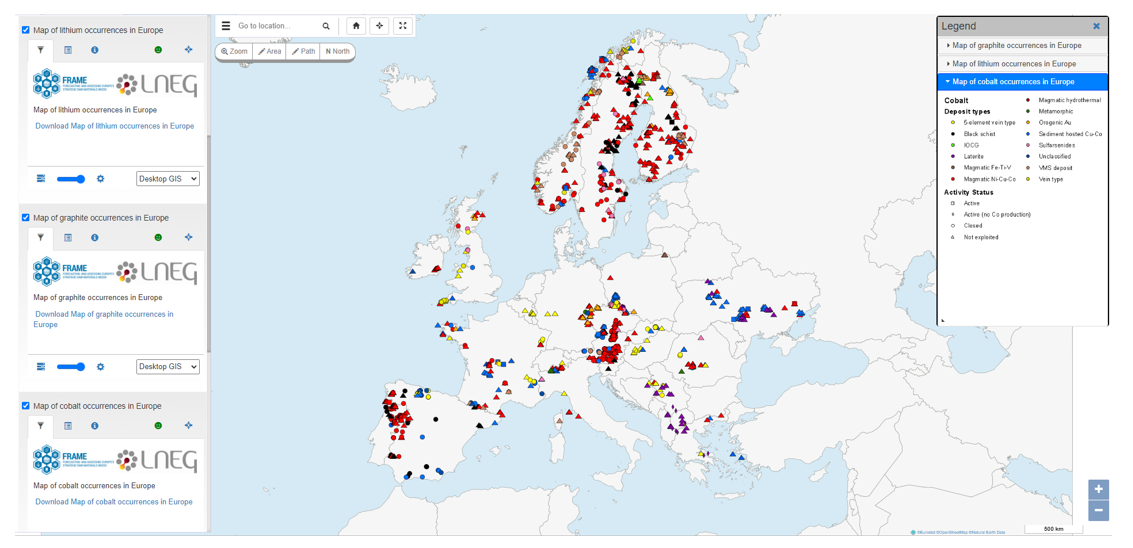
Figure 8: Querying selected datasets through EDGI visualization platform. Source: Map of cobalt occurrences in Europe, Map of graphite occurrences in Europe, Map of lithium occurrences in Europe, FRAME project.
Lastly, we went to the data portal of the International Energy Agency (IEA) (Figure 9). In this case, we found, among its more than 70 datasets, one directly related to our field of research, entitled Critical Minerals Demand Dataset, which we proceeded to download for further analysis in excel format.
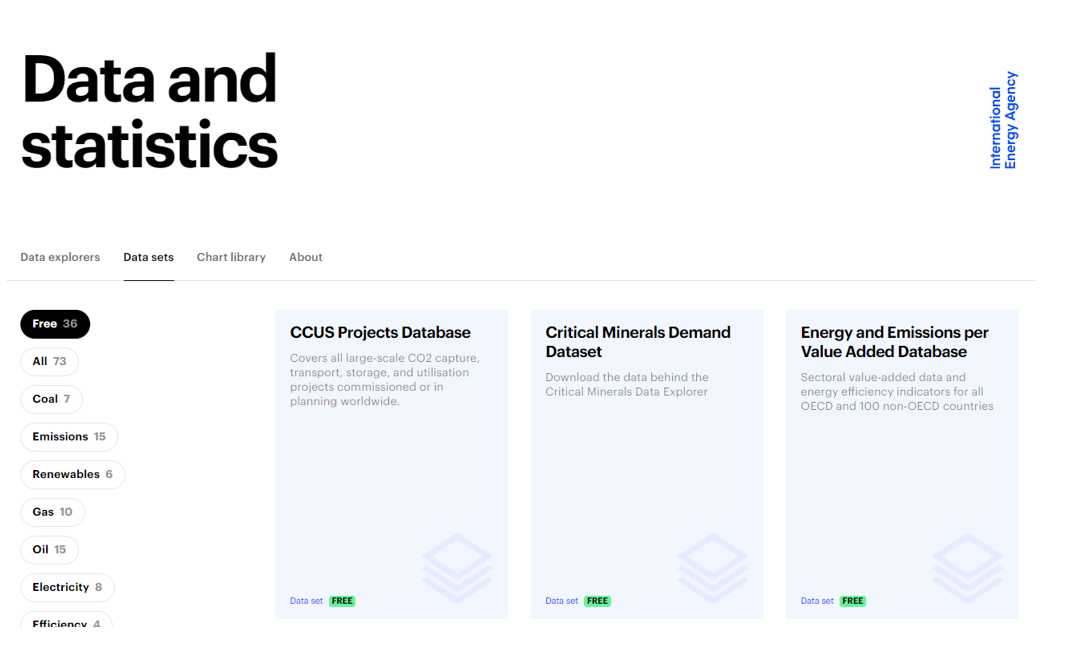
Figure 9: Capture of the International Energy Agency (IEA) data portal.
After this search, we have located some interesting data that can help us to carry out different analyses.
Although this exercise has been carried out under the theme of critical minerals, European open data portals provide a large amount of information and diverse data sets on many areas of interest that can help us understand the challenges we face as a society, from the energy transition to the fight against poverty or food waste. Data that will allow us to carry out analyses aimed at making better decisions to move towards a more prosperous and sustainable future.
Content elaborated by Juan Benavente, industrial engineer and expert in technologies linked to the data economy. The contents and points of view reflected in this publication are the sole responsibility of the author.
Blog
In the vast technological landscape, few tools have made as deep a mark as Google Maps. Since its inception, this application has become the standard for finding and navigating points of interest on maps. But what happens when we look for options beyond the ubiquitous map application? In this post we review possible alternatives to the well-known Google application.
Introduction
At the beginning of 2005, Google's official blog published a brief press release in which they presented their latest creation: Google Maps. To get an idea of what 2005 was like, technologically speaking, it is enough to look at the most groundbreaking mobile terminals that year:

Imagen credits: Cinco móviles que marcaron el año 2005
Some of us still remember what the experience (or lack of experience) of running apps on these terminals was like. Well, in that year the first version of Google Maps was launched, allowing us to search for restaurants, hotels and other elements near our location, as well as to find out the best route to go from point A to point B on a digital version of a map of our city. In addition, that same year, Google Earth was also launched, which represented a real technological milestone by providing access to satellite images for almost all citizens of the world.
Since then, Google's digital mapping and navigation ecosystem, with its intuitive interface and innovative augmented reality features, has been a beacon guiding millions of users on their daily journeys.
But what if we are looking for something different? What alternatives are there for those who want to explore new horizons? Join us on this journey as we venture into the fascinating world of your competitors. From more specialized options to those that prioritize privacy, we will discover together the various routes we can take in the vast landscape of digital navigation.
Alternatives to Google Maps
Almost certainly some of you readers have seen or used some of the open source alternatives to Google Maps, although you may not know it. Just to mention some of the most popular alternatives:
-
OpenStreetMap (OSM): OpenStreetMap is a collaborative project that creates a community-editable map of the world. It offers free and open geospatial data that can be used for a variety of applications, from navigation to urban analysis.
-
uMap: uMap is an online tool that allows users to create custom maps with OpenStreetMap layers. It is easy to use and offers customization options, making it a popular choice for quick creation of interactive maps.
-
GraphHopper: GraphHopper is an open source routing solution that uses OpenStreetMap data. It stands out for its ability to calculate efficient routes for vehicles, bicycles and pedestrians, and can be used as part of custom applications.
-
Leaflet: Leaflet is an open source JavaScript library for interactive maps compatible with mobile devices. It is probably the most widespread library because of its low KB weight and because it includes all the mapping functions that most developers might need.
-
Overture Maps: While the previous four solutions are already widely established in the market, Overture Maps is a new player. It is a collaborative project to create interoperable open maps.
Of all of them, we are going to focus on OpenStreetMap (OSM) and Overture Maps.
Open Street Maps: an open and collaborative tool
Of the aforementioned solutions, probably the most widespread and well-known is Open Street Maps.
OpenStreetMap (OSM) stands out as one of the best open source alternatives to Google Maps for several reasons:
-
First, the fundamental characteristic of OpenStreetMap lies in its collaborative and open nature, where a global community contributes to the creation and constant updating of geospatial data.
-
In addition, OpenStreetMap provides free and accessible data that can be used flexibly in a wide range of applications and projects. To quote verbatim from their website: OpenStreetMap is open data: you are free to use it for any purpose as long as you credit OpenStreetMap and its contributors. If you modify or build upon the data in certain ways, you may distribute the result only under the same license. See the Copyright and License page for more details.
-
The ability to customize maps and the flexibility of OpenStreetMap integration are also outstanding features. Developers can easily tailor maps to the specific needs of their applications by leveraging the OpenStreetMap API. This is the key to the development of an ecosystem of applications around OSM such as uMap, Leaflet or GraphHopper, among many others.
Overture Maps. A unique competitor
Perhaps, one of the most promising projects to have recently appeared on the global technology scene is Overture Maps. As indicated (last July of this year) by its foundation (OMF Overture Maps Foundation), it has released its first open dataset, marking a significant milestone in the collaborative effort to create interoperable open map products. The first Overture release includes four unique data layers:
-
Places of Interest (POIs)
-
Buildings
-
Transportation Network
-
Administrative Boundaries

Example coverage of public places worldwide identified in the initial project dataset. The first version of the overture maps dataset contains, among others, 59 million records of points of interest, 780 million buildings, transport networks and national and regional administrative boundaries worldwide.
These layers, which merge various open map data sources, have been validated and contrasted through quality checks and are released under the Overture Maps data schema, made public in June 2023. Specifically, the Places of Interest layer includes data on more than 59 million places worldwide. This dataset is presented as a fundamental building block for navigation, local search and for various location-based applications. The other three layers include detailed building information (with more than 780 million building footprints worldwide), a global transportation network derived from the OpenStreetMap project, and worldwide administrative boundaries with regional names translated into more than 40 languages.
Perhaps one of the most significant pieces of information in this announcement is the number of collaborators that have come together to realize this project. The Overture collaboration, founded in December 2022 by Amazon Web Services (AWS), Meta, Microsoft and TomTom, now boasts more than a dozen geospatial and technology companies, including new members such as Esri, Cyient, InfraMappa, Nomoko, Precisely, PTV Group, SafeGraph, Sanborn and Sparkgeo. The central premise of this collaboration is the need to share map data as a common asset to support future applications.
As a good open source project, the Overture Foundation has made available to the development community a Github repository where they can contribute to the project.
In short, digital maps, their corresponding geospatial data layers, navigation and photo-geolocation capabilities are vital and strategic assets for social and technological organizations around the world. Now, with the 20th anniversary of the birth of Google Maps just around the corner, there are good open source alternatives and the big players in the international technology landscape are coming together to generate even more valuable spatial assets. Who will win this new race? We don't know, but we will keep a close eye on the current news on this topic.
Noticia
The concept of High-Value data (High-Value datasets) was introduced by the European Parliament and the Council of the European Union 4 years ago, in Directive (EU) 2019/1024. In it, they were defined as a series of datasets with a high potential to generate "benefits for society, the environment and the economy". Therefore, member states were to push for their openness for free, in machine-readable formats, via APIs, in the form of bulk download and comprehensively described by metadata.
Initially, the directive proposed in its annex six thematic categories to be considered as high value: geospatial, earth observation and environmental, meteorological, statistical, business records and transport network data. These categories were subsequently detailed in an implementing regulation published in December 2022. In addition, to facilitate their openness, a document with guidelines on how to use DCAT-AP for publication was published in June 2023.
New categories of data to be considered of high value
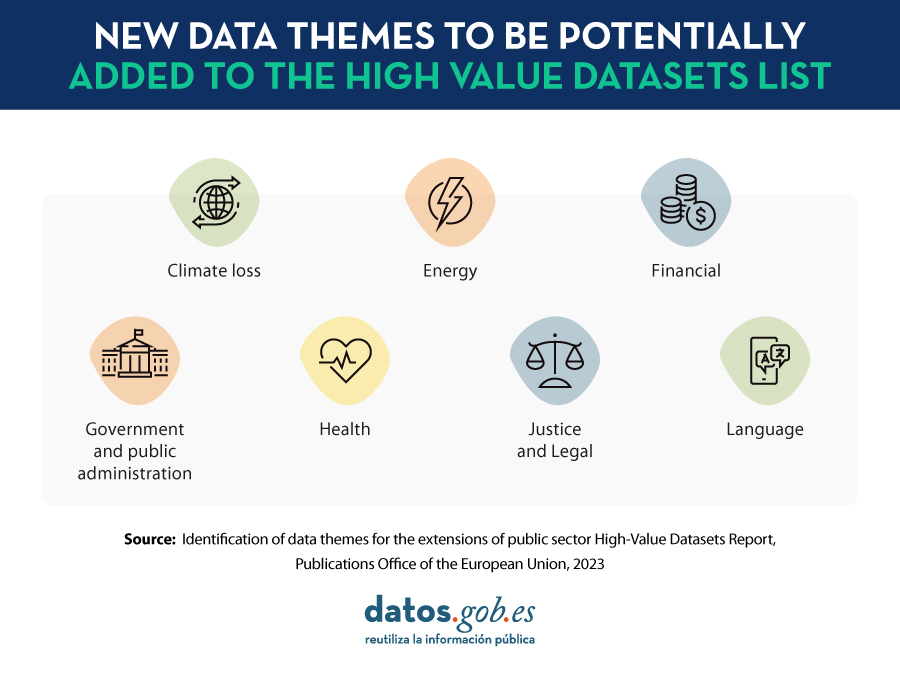
These initial categories were always open to extension. In this sense, the European Commission has just published the report "Identification of data themes for the extensions of public sector High-Value Datasets" which includes seven new categories to be considered as high-value data
-
Climate loss: This refers to data related to approaches and actions needed to avoid, minimize and address damages associated with climate change. Examples of datasets in this category are economic and non-economic losses from extreme weather events or slow-onset changes such as sea level rise or desertification. It also includes data related to early warning systems for natural disasters, the impact of mitigation measures, or research data on the attribution of extreme events to climate change.
-
Energy: This category includes comprehensive statistics on the production, transport, trade and final consumption of primary and secondary energy sources, both renewable and non-renewable. Examples of data sets to consider are price and consumption indicators or information on energy security.
-
Finance: This is information on the situation of private companies and public administrations, which can be used to assess business performance or economic sustainability, as well as to define spending and investment strategies. It includes datasets on company registers, financial statements, mergers and acquisitions, as well as annual financial reports.
-
Government and public administration: This theme includes data that public services and companies collect to inform and improve the governance and administration of a specific territorial unit, be it a state, a region or a municipality. It includes data relating to government (e.g. minutes of meetings), citizens (census or registration in public services) and government infrastructures. These data are then reused to inform policy development, deliver public services, optimize resources and budget allocation, and provide actionable and transparent information to citizens and businesses.
-
Health: This concept identifies data sets covering the physical and mental well-being of the population, referring to both objective and subjective aspects of people's health. It also includes key indicators on the functioning of health care systems and occupational safety. Examples include data relating to Covid-19, health equity or the list of services provided by health centers.
-
Justice and legal affairs: Identifies datasets to strengthen the responsiveness, accountability and interoperability of EU justice systems, covering areas such as the application of justice, the legal system or public security, i.e. that which ensures the protection of citizens. The data sets on justice and legal matters include documentation of national or international jurisprudence, decisions of courts and prosecutors general, as well as legal acts and their content.
-
Linguistic data: Refers to written or spoken expressions that are at the basis of artificial intelligence, natural language processing and the development of related services. The Commission provides a fairly broad definition of this category of data, all of which are grouped under the term "multimodal linguistic data". They may include repositories of text collections, corpora of spoken languages, audio resources, or video recordings.
To make this selection, the authors of the report conducted desk research as well as consultations with public administrations, data experts and private companies through a series of workshops and surveys. In addition to this assessment, the study team mapped and analyzed the regulatory ecosystem around each category, as well as policy initiatives related to their harmonization and sharing, especially in relation to the creation of European Common Data Spaces.
Potential for SMEs and digital platforms
In addition to defining these categories, the study also provides a high-level estimate of the impact of the new categories on small and medium-sized companies, as well as on large digital platforms. One of the conclusions of the study is that the cost-benefit ratio of data openness is similar across all new topics, with those relating to the categories "Finance" and "Government and public administration" standing out in particular.
Based on the publicly available datasets, an estimate was also made of the current degree of maturity of the data belonging to the new categories, according to their territorial coverage and their degree of openness (taking into account whether they were open in machine-readable formats, with adequate metadata, etc.). To maximize the overall cost-benefit ratio, the study suggests selecting a different approach for each thematic category: based on their level of maturity, it is recommended to indicate a higher or lower number of mandatory criteria for publication, thus ensuring to avoid overlaps between new topics and existing high-value data.
You can read the full study at this link.
Noticia
On September 14th, the II National Open Data Meeting took place under the theme "Urgent Call to Action for the Environment" at the Pignatelli building, the headquarters of the Government of Zaragoza. The event, held in person in the Crown Room, allowed attendees to participate and exchange ideas in real-time.
The event continued the tradition started in 2022 in Barcelona, establishing itself as one of the main gatherings in Spain in the field of public sector data reuse. María Ángeles Rincón, Director-General of Electronic Administration and Corporate Applications of the Government of Aragon, inaugurated the event, emphasizing the importance of open data in terms of transparency, reuse, economic development, and social development. She highlighted that high-quality and neutral data available on open data portals are crucial for driving artificial intelligence and understanding our environmental surroundings.
The day continued with a presentation by María Jesús Fernández Ruiz, Head of the Technical Office of Open Government of the City of Zaragoza, titled "Why Implement Data Governance in Our Institutions?" In her presentation, she stressed the need to manage data as a strategic asset and a public good, integrating them into governance and management policies. She also emphasized the importance of interoperability and the reuse of large volumes of data to turn them into knowledge, as well as the formation of interdisciplinary teams for data management and analysis.
The event included three panel discussions with the participation of professionals, experts, and scientists related to the management, publication, and use of open data, focusing on environmental data.
The first panel discussion highlighted the value of open data for understanding the environment we live in. In this video, you can revisit the panel discussion moderated by Borja Carvajal of the Diputación de Castellón: II National Open Data Meeting, Zaragoza, September 14, 2023 (morning session).
Secondly, Magda Lorente from the Diputación de Barcelona moderated the discussion "Open Data, Algorithms, and Artificial Intelligence: How to Combat Environmental Disinformation?" This second panel featured professionals from data journalism, science, and the public sector who discussed the opportunities and challenges of disseminating environmental information through open data.

Conclusions from Challenges 1 and 2 on Open Data: Interadministrative Collaboration and Professional Competencies
After the second panel discussion, the conclusions of Challenges 1 and 2 on open data were presented, two lines of work defined at the I National Open Data Meeting held in 2022.
In last year's conference, several challenges were identified in the field of open data. The first of them (Challenge 1) involved promoting collaboration between administrations to facilitate the opening of data sets and generate valuable exchanges for both parties. To address this challenge, annual work was carried out to establish the appropriate lines of action.
You can download the document summarizing the conclusions of Challenge 1 here: https://opendata.aragon.es/documents/90029301/115623550/Reto_1_encuentro_datos_Reto_1.pptx
On the other hand, Challenge 2 aimed to identify the need to define professional roles, as well as essential knowledge and competencies that public employees who take on tasks related to data opening should have.
To address this second challenge, a working group of professionals with expertise in the sector was also established, all pursuing the same goal: to promote the dissemination of open data and thus improve public policies by involving citizens and businesses throughout the opening process.
To resolve the key issues raised, the group addressed two related lines of work:
- Defining competencies and basic knowledge in the field of open data for different public professional profiles involved in data opening and use.
- Identifying and compiling existing training materials and pathways to provide workers with a starting point.
Key Professional Competencies for Data Opening
To specify the set of actions and attitudes that a worker should have to complete their work with open data, it was considered necessary to identify the main profiles in the administration needed, as well as the specific needs of each position. In this regard, the working group has based its analysis on the following roles:
- Open Data Manager role: responsible for technical leadership in promoting open data policies, data policy definition, and data model activities.
- Technical role in data opening (IT profile): encourages execution activities more related to system management, data extraction processes, data cleaning, etc., among others.
- Functional role in data opening (service technician): carries out execution activities more related to selecting data to be published, quality, promotion of open data, visualization, data analytics, for example.
- Use of data by public workers: performs activities involving data use for decision-making, basic data analytics, among others. Analyzing the functions of each of these roles, the team has established the necessary competencies and knowledge for performing the functions defined in each of these roles.
You can download the document with conclusions about professional capabilities for data opening here: https://opendata.aragon.es/documents/90029301/115623550/reto+2_+trabajadores+p%C3%BAblicos+capacitados+para+el+uso+y+la+apertura+de+datos.docx
Training Materials and Pathways on Open Data
In line with the second line of work, the team of professionals has developed an inventory of online training resources in the field of open data, which can be accessed for free. This list includes courses and materials in Spanish, co-official languages, and English, covering topics such as open data, their processing, analysis, and application.
You can download the document listing training materials, the result of the work of Challenge 2's group, here: [https://opendata.aragon.es/datos/catalogo/dataset/listado-de-materiales-formativos-sobre-datos-abiertos-fruto-del-trabajo-del-grupo-del-reto-2
In conclusion, the working group considered that the progress made during this first year marks a solid start, which will serve as a basis for administrations to design training and development plans aimed at the different roles involved in data opening. This, in turn, will contribute to strengthening and improving data policies in these entities.
Furthermore, it was noted that the effort invested in these months to identify training resources will be key in facilitating the acquisition of essential knowledge by public workers. On the other hand, it has been highlighted that there is a large number of free and open training resources with a basic level of specialization. However, the need to develop more advanced materials to train the professionals that the administration needs today has been identified.
The third panel discussion, moderated by Vicente Rubio from the Diputación de Castellón, focused on public policies based on data to improve the living environment of its inhabitants.
At the end of the meeting, it was emphasized how important it is to continue working on and shaping different challenges related to the functions and services of open data portals and data opening processes. In the III National Open Data Meeting to be held next year in the Province of Castellón, progress in this area will be presented.
Application
This free software application offers a map with all the trees in the city of Barcelona geolocated by GPS. The user can access in-depth information on the subject. For example, the program identifies the number of trees in each street, their condition and even the species.
The application's developer, Pedro López Cabanillas, has used datasets from Barcelona's open data portal (Open Data Barcelona) and states, in his blog, that it can be useful for botany students or "curious users". The Barcelona Trees application is now in its third beta version.
The program uses the framework Qt, C++ and QML languages, and can be built (using a suitable modern compiler) for the most common targets: Windows, macOS, Linux and Android operating systems.
Blog
In recent years, climate change has become one of the most pressing challenges of our time because, according to the main reports of different international institutions, it is accelerating beyond the most pessimistic forecasts. Rising global temperatures, melting glaciers, rising sea levels and the frequency of extreme weather events have been well documented in reports such as that produced by the Intergovernmental Panel on Climate Change (IPCC). Similarly, the report CO2 Emissions in 2022 of the International Energy Agency (IEA) warns of the continuous growth of carbon emissions and their contribution to global warming, while calling for urgent efforts to reduce them.
In this critical context that threatens the stability of our planet, open data becomes a fundamental tool to understand, monitor and combat the phenomenon of global climate change with solutions. Moreover, there are several dimensions in which open data is playing an essential role in the fight against climate change.
Climate Modeling and Prediction: planning for a Sustainable Future
Climate models make it possible to predict how the climate will change in the future and, when properly trained, also help to identify potential impacts in specific regions. This enables governments and communities to take measures to adapt to rapidly changing conditions.
Increasingly, these models are fed by open datasets, and some climate models have even begun to be published freely and openly. In this line, we find the climate models published on the MIT Climate portal or the data and models published by NOAA Climate.gov. In this way, all kinds of institutions, scientists and even citizens can contribute to identifying possibilities for mitigating the effects of climate change.
Carbon emissions monitoring: carbon footprint tracking
Thanks to open data and some paid-for datasets, it is now possible to accurately track the carbon emissions of countries, cities and even companies on an ongoing basis. As exemplified by the International Energy Agency's (IEA) World Energy Outlook 2022 or the U.S. Environmental Protection Agency's Global Greenhouse Gas Emissions Data, these data are essential not only for measuring and analyzing emissions globally, but also for assessing progress towards emission reduction targets.
Adapting Agriculture: cultivating a resilient future
It is clear that climate change has a direct impact on agriculture and that this impact threatens a global food security that in itself is already a global challenge. Open data on weather patterns, rainfall and temperatures, land use and fertilizer and pesticide use, coupled with local data captured in the field, allow farmers to adapt their practices and evolve towards a model of precision agriculture. Choosing crops that are resilient to changing conditions, and managing inputs more efficiently thanks to this data, is crucial to ensure that agriculture remains sustainable and productive in the new scenarios.
Among other organizations, the Food and Agriculture Organization of the United Nations (FAO) highlights the importance of open data in climate-smart agriculture and publishes datasets on pesticide use, inorganic fertilizers, greenhouse gas emissions, agricultural production, etc., which contribute to improved land, water and food security management.
Natural Disaster Response: minimizing Impact
The analysis of data on extreme weather events, such as hurricanes or floods, makes it possible to design strategies that lead to a faster and more effective response when these events occur. In this way, on the one hand, lives are saved and, on the other, the high impact on affected communities is partially mitigated.
Open data such as those published by the US National Hurricane Center (NHC) or the European Environment Agency are valuable tools in natural disaster management as they help streamline disaster preparedness decision-making and provide an objective basis for assessment and prioritization.
Biodiversity and conservation: protecting our natural wealth
While it seems clear that biodiversity is vital to the health of the Earth, human activity continues to put it under great pressure, combining with climate change to threaten its stability. Open data on species populations, deforestation and other ecological indicators such as those published by governments and organizations around the world in the Global Biodiversity Information Facility (GBIF) help us to identify areas at risk more quickly and accurately and thus prioritize conservation efforts.
With the increased availability of open data, governments, institutions, companies and citizens can make informed decisions to mitigate the consequences of climate change and work together towards a more sustainable future.
Content prepared by Jose Luis Marín, Senior Consultant in Data, Strategy, Innovation & Digitalization.
The contents and points of view reflected in this publication are the sole responsibility of its author.
Blog
The "Stories of Use Cases" series, organized by the European Open Data portal (data.europe.eu), is a collection of online events focused on the use of open data to contribute to common European Union objectives such as consolidating democracy, boosting the economy, combating climate change, and driving digital transformation. The series comprises four events, and all recordings are available on the European Open Data portal's YouTube channel. The presentations used to showcase each case are also published.
In a previous post on datos.gob.es, we explained the applications presented in two of the series' events, specifically those related to the economy and democracy. Now, we focus on use cases related to climate and technology, as well as the open datasets used for their development.
Open data has enabled the development of applications offering diverse information and services. In terms of climate, some examples can trace waste management processes or visualize relevant data about organic agriculture. Meanwhile, the application of open data in the technological sphere facilitates process management. Discover the highlighted examples by the European Open Data portal!
Open Data for Fulfilling the European Green Deal
The European Green Deal is a strategy by the European Commission aiming to achieve climate neutrality in Europe by 2050 and promote sustainable economic growth. To reach this objective, the European Commission is working on various actions, including reducing greenhouse gas emissions, transitioning to a circular economy, and improving energy efficiency. Under this common goal and utilizing open datasets, three applications have been developed and presented in one of the webinars of the series on data.europe.eu use cases: Eviron Mate, Geofluxus, and MyBioEuBuddy.
- Eviron Mate: It's an educational project aimed at raising awareness among young people about climate change and related data. To achieve this goal, Eviron Mate utilizes open data from Eurostat, the Copernicus Program and data.europa.eu.
- Geofluxus: This initiative tracks waste from its origin to its final destination to promote material reuse and reduce waste volume. Its main objective is to extend material lifespan and provide businesses with tools for better waste management decisions. Geofluxus uses open data from Eurostat and various national open data portals.
- MyBioEuBuddy is a project offering information and visualizations about sustainable agriculture in Europe, using open data from Eurostat and various regional open data portals.
The Role of Open Data in Digital Transformation
In addition to contributing to the fight against climate change by monitoring environment-related processes, open data can yield interesting outcomes in other digitally-operating domains. The combination of open data with innovative technologies provides valuable results, such as natural language processing, artificial intelligence, or augmented reality.
Another online seminar from the series, presented by the European Data Portal, delved into this theme: driving digital transformation in Europe through open data. During the event, three applications that combine cutting-edge technology and open data were presented: Big Data Test Infrastructure, Lobium, and 100 Europeans.
- "Big Data Test Infrastructure (BDTI)": This is a European Commission tool featuring a cloud platform to facilitate the analysis of open data for public sector administrations, offering a free and ready-to-use solution. BDTI provides open-source tools that promote the reuse of public sector data. Any public administration can request the free advisory service by filling out a form. BDTI has already aided some public sector entities in optimizing procurement processes, obtaining mobility information for service redesign, and assisting doctors in extracting knowledge from articles.
- Lobium: A website assisting public affairs managers in addressing the complexities of their tasks. Its aim is to provide tools for campaign management, internal reporting, KPI measurement, and government affairs dashboards. Ultimately, its solution leverages digital tools' advantages to enhance and optimize public management.
- 100 Europeans: An application that simplifies European statistics, dividing the European population into 100 individuals. Through scrolling navigation, it presents data visualizations with figures related to healthy habits and consumption in Europe.
These six applications are examples of how open data can be used to develop solutions of societal interest. Discover more use cases created with open data in this article we have published on datos.gob.es

Learn more about these applications in their seminars -> Recordings here
Noticia
Public administrations (PAs) have the obligation to publish their open datasets in reusable formats, as dictated by European Directive 2019/1024 which amends Law 37/2007 of November 16, regarding the reuse of public sector information. This regulation, aligned with the European Union's Data Strategy, stipulates that PAs must have their own catalogs of open data to promote the use and reuse of public information.
One of these catalogs is the Canary Islands Open Data Portal, which contains over 7,450 open, free, and reusable datasets from up to 15 organizations within the autonomous community. The Ministry of Agriculture, Livestock, Fisheries, and Food Sovereignty (CAGPSA) of the Government of the Canary Islands is part of this list. As part of its Open Government initiative, CAGPSA has strongly promoted the opening of its data.
Through a process of analysis, refinement, and normalization of the data, CAGPSA has successfully published over 20 datasets on the portal, thus ensuring the quality of information reuse by any interested party.
Analysis, data normalization, and data opening protocol for the Government of the Canary Islands
To achieve this milestone in data management, the Ministry of Agriculture, Livestock, Fisheries, and Food Sovereignty of the Government of the Canary Islands has developed and implemented a data opening protocol, which includes tasks such as:
- Inventory creation and prioritization of data sources for publication.
- Analysis, refinement, and normalization of prioritized datasets.
- Requesting the upload of datasets to the Canary Islands Open Data Portal.
- Addressing requests related to the published datasets.
- Updating published datasets.
Data normalization has been a key factor for the Ministry, taking into account international semantic assets (including United Nations classifications and various agencies or Eurostat) and applying guidelines defined in international standards such as SDMX or those set by datos.gob.es, to ensure the quality of the published data.
CAGPSA has not only put efforts into data normalization and publication but has also provided support to the ministry's personnel in the management and maintenance of the data, offering training and awareness sessions. Furthermore, they have created a manual for data reuse, outlining guidelines based on European and national directives regarding open data and the reuse of public sector information. This manual helps address concerns of the ministry's staff regarding the publication of personal or commercial data.
As a result of this work, the Ministry has actively collaborated with the Canary Islands Open Data Portal in publishing datasets and defining the data opening protocol established for the entire Government of the Canary Islands.
Commitment to Quality and Information Reuse
CAGPSA has been particularly recognized for the publication of the Agricultural Transformation Societies (SAT) dataset, which ranked among the top 3 datasets by the Multisectorial Information Association (ASEDIE) in 2021. This initiative has been praised by the association on multiple occasions for its focus on data quality and management.
Their efforts in data normalization, support to the ministry's staff, collaboration with the open data portal, and the extensive array of datasets, position CAGPSA as a reference in this field within the Canary Islands autonomous community.
At datos.gob.es, we applaud these kinds of examples and highlight the good practices in data opening by public administrations. The initiative of the Ministry of Agriculture, Livestock, Fisheries, and Food Sovereignty of the Government of the Canary Islands is a significant step that brings us closer to the advantages that open data and its reuse offer to the citizens. The Ministry's commitment to data openness contributes to the European and national goal of achieving a data-driven administration.