Blog
The value of open satellite data in Europe
Satellites have become essential tools for understanding the planet and managing resources efficiently. The European Union (EU) has developed an advanced space infrastructure with the aim of providing real-time data on the environment, navigation and meteorology.
This satellite network is driven by four key programmes:.
- Copernicus: Earth observation, environmental monitoring and climate change.
- Galileo: high-precision satellite navigation, alternative to GPS.
- EGNOS: improved positioning accuracy, key to aviation and navigation.
- Meteosat: padvanced meteorological prediction and atmospheric monitoring.
Through these programmes, Europe not only ensures its technological independence, but also obtains data that is made available to citizens to drive strategic applications in agriculture, security, disaster management and urban planning.
In this article we will explore each programme, its satellites and their impact on society, including Spain''s role in each of them.
Copernicus: Europe''s Earth observation network
Copernicus is the EU Earth observation programme, managed by the European Commission with the technical support of the European Space Agency (ESA) and the European Organisation for the Exploitation of Meteorological Satellites (EUMETSAT).. It aims to provide free and open data about the planet to monitor climate change, manage natural resources and respond to emergencies.
The programme is structured into three main components:
- Space component: consists of a series of satellites called Sentinel, developed specifically for the needs of Copernicus. These satellites provide high quality data for various applications, such as land, sea and atmospheric monitoring.
- Component in situ: includes data collected through ground, air and sea stations. These data are essential to calibrate and validate the information obtained by the satellites, ensuring its accuracy and reliability.
- Operational Services: offers six thematic services that transform collected data into useful information for users:
- Atmospheric monitoring
- Marine monitoring
- Terrestrial monitoring
- Climate change
- Emergency management
- Safety
These services provide information in areas such as air quality, ocean status, land use, climate trends, disaster response and security, supporting informed decision-making in Europe.
Spain has played a key role in the manufacture of components for the Sentinel satellites. Spanish companies have developed critical structures and sensors, and have contributed to the development of data processing software. Spain is also leading projects such as the Atlantic Constellation, which will develop small satellites for climate and oceanic monitoring.
Sentinel satellite
| Satellite | Technical characteristics | Resolution | Coverage (capture frequency) | Uses |
|---|---|---|---|---|
| Sentinel-1 | C-band SAR radar, resolution up to 5m | Up to 5m | Every 6 days | Land and ocean monitoring, natural disasters |
| Sentinel-2 | Multispectral camera (13 bands), resolution up to 10m | 10m, 20m, 60m | Every 5 days | Agricultural management, forestry monitoring, water quality |
| Sentinel-3 | Radiometer SLSTR, Spectrometer OLCI, Altimeter SRAL | 300m (OLCI), 500m (SLSTR) | Every 1-2 days | Oceanic, climatic and terrestrial observation |
| Sentinel-5P | Tropomi spectrometer, resolution 7x3.5 km². | 7x3.5 km² | Daily global coverage | Air quality monitoring, trace gases |
| Sentinel-6 | Altimeter Poseidon-4, vertical resolution 1 cm | 1cm | Every 10 days | Sea level measurement, climate change |
Figure 1. Table satellites Sentinel. Source: own elaboration
Galileo: the european GPS
Galileo is the global navigation satellite system developed by the European Union, managed by the European Space Agency (ESA) and operated by the European Union Space Programme Agency (EUSPA). It aims to provide a reliable and highly accurate global positioning service, independent of other systems such as the US GPS, China''s Beidou or Russia''s GLONASS. Galileo is designed for civilian use and offers free and paid services for various sectors, including transport, telecommunications, energy and finance.
Spain has played a leading role in the Galileo programme. The European GNSS Service Centre (GSC), located in Torrejón de Ardoz, Madrid, acts as the main contact point for users of the Galileo system. In addition, Spanish industry has contributed to the development and manufacture of components for satellites and ground infrastructure, strengthening Spain''s position in the European aerospace sector.
| Satellite | Technical characteristics | Resolution | Coverage (capture frequency) | Uses |
|---|---|---|---|---|
| Galileo FOC | Medium Earth Orbit (MEO), 24 operatives | N/A | Continuous | Precise positioning, land and maritime navigation |
| Galileo IOV | First test satellites of the Galileo system | N/A | Continuous | Initial testing of Galileo before FOC |
Figure 2. Satellite Galileo. Source: own elaboration
EGNOS: improving the accuracy of GPS and Galileo
The European Geostationary Navigation Overlay Service (EGNOS) is the European satellite-based augmentation system (Satellite Based Augmentation System or SBAS) designed to improve the accuracy and reliability of global navigation satellite systems ( Global Navigation Satellite System, GNSS), such as GPS and, in the future, Galileo. EGNOS provides corrections and integrity data that allow users in Europe to determine their position with an accuracy of up to 1.5 metres, making it suitable for safety-critical applications such as aviation and maritime navigation.
Spain has played a leading role in the development and operation of EGNOS. Through ENAIRE, Spain hosts five RIMS Reference Stations located in Santiago, Palma, Malaga, Gran Canaria and La Palma. In addition, the Madrid Air Traffic Control Centre, located in Torrejón de Ardoz, hosts one of the EGNOS Mission Control Centres (MCC), operated by ENAIRE. The Spanish space industry has contributed significantly to the development of the system, with companies participating in studies for the next generation of EGNOS.
| Satellite | Technical characteristics | Resolution | Coverage (capture frequency) | Uses |
|---|---|---|---|---|
| EGNOS Geo | Geostationary GNSS correction satellites | N/A | Real-time GNSS correction | GNSS signal correction for aviation and transportation |
Figure 3. Table satellite EGNOS. Source: own elaboration
Meteosat: high precision weather forecasting
The Meteosat programme consists of a series of geostationary meteorological satellites initially developed by the European Space Agency (ESA) and currently operated by the European Organisation for the Exploitation of Meteorological Satellites (EUMETSAT). These satellites are positioned in geostationary orbit above the Earth''s equator, allowing continuous monitoring of weather conditions over Europe, Africa and the Atlantic Ocean. Its main function is to provide images and data to facilitate weather prediction and climate monitoring.
Spain has been an active participant in the Meteosat programme since its inception. Through the Agencia Estatal de Meteorología (AEMET), Spain contributes financially to EUMETSAT and participates in the programme''s decision-making and operations. In addition, the Spanish space industry has played a key role in the development of the Meteosat satellites. Spanish companies have been responsible for the design and supply of critical components for third-generation satellites, including scanning and calibration mechanisms.
| Satellite | Technical characteristics | Resolution | Cobertura (frecuencia de captura) | Usos |
|---|---|---|---|---|
| Meteosat Primera Gen. | Initial weather satellites, low resolution | Low resolution | Every 30min | Basic weather forecast, images every 30 min. |
| Meteosat Segunda Gen. | Higher spectral and temporal resolution, data every 15 min. | High resolution | Every 15min | Improved accuracy, early detection of weather events |
| Meteosat Tercera Gen. | High-precision weather imaging, lightning detection | High resolution | High frequency | High-precision weather imaging, lightning detection |
Figure 4. Metosat satellite. Source: own elaboration
Access to the data of each programme
Each programme has different conditions and distribution platforms in terms of access to data:
- Copernicus: provides free and open data through various platforms. Users can access satellite imagery and products through the Copernicus Data Space Ecosystem, which offers search, download and processing tools. Data can also be obtained through APIs for integration into automated systems.
- Galileo: its open service (Open Service - OS) allows free use of the navigation signals for any user with a compatible receiver, free of charge. However, direct access to raw satellite data is not provided. For information on services and documentation, access is via the European GNSS Services Centre (GSC):
- Galileo Portal.
- Registration for access to the High Accuracy Service (HAS) (registration required).
- EGNOS: This system improves navigation accuracy with GNSS correction signals. Data on service availability and status can be found on the EGNOS User Support platform..
- Meteosat: Meteosat satellite data are available through the EUMETSAT platform. There are different levels of access, including some free data and some subject to registration or payment. For imagery and meteorological products you can access the EUMETSAT Data Centre..
In terms of open access, Copernicus is the only programme that offers open and unrestricted data. In contrast, Galileo and EGNOS provide free services, but not access to raw satellite data, while Meteosat requires registration and in some cases payment for access to specific data.
Conclusions
The Copernicus, Galileo, EGNOS and Meteosat programmes not only reinforce Europe''s space sovereignty, but also ensure access to strategic data essential for the management of the planet. Through them, Europe can monitor climate change, optimise global navigation, improve the accuracy of its positioning systems and strengthen its weather predictioncapabilities, ensuring more effective responses to environmental crises and emergencies.
Spain plays a fundamental role in this space infrastructure, not only with its aerospace industry, but also with its control centres and reference stations, consolidating itself as a key player in the development and operation of these systems.
Satellite imagery and data have evolved from scientific tools to become essential resources for security, environmental management and sustainable growth. In a world increasingly dependent on real-time information, access to this data is critical for climate resilience, spatial planning, sustainable agriculture and ecosystem protection.
The future of Earth observation and satellite navigation is constantly evolving, and Europe, with its advanced space programmes, is positioning itself as a leader in the exploration, analysis and management of the planet from space.
Access to this data allows researchers, businesses and governments to make more informed and effective decisions. With these systems, Europe and Spain guarantee their technological independence and strengthen their leadership in the space sector.
Ready to explore more? Access the links for each programme and discover how this data can transform our world.
| Copernicus | https://dataspace.copernicus.eu/ | Download centre |
|---|---|---|
| Meteosat | https://user.eumetsat.int/data-access/data-centre/ | Download centre |
| Galileo | https://www.gsc-europa.eu/galileo/services/galileo-high-accuracy-servic…/ | Download centre, after registration |
| EGNOS | https://egnos-user-support.essp-sas.eu/ | Project |
Figure 5. Source: own elaboration
Content prepared by Mayte Toscano, Senior Consultant in Data Economy Technologies. The contents and points of view reflected in this publication are the sole responsibility of the author.
Evento
March is approaching and with it a new edition of the Open Data Day. It is an annual worldwide celebration that has been organised for 12 years, promoted by the Open Knowledge Foundation through the Open Knowledge Network. It aims to promote the use of open data in all countries and cultures.
This year's central theme is "Open data to address the polycrisis". The term polycrisis refers to a situation where different risks exist in the same time period. This theme aims to focus on open data as a tool to address, through its reuse, global challenges such as poverty and multiple inequalities, violence and conflict, climate risks and natural disasters.
If several years ago the activities were limited to a single day, from 2023 we have a week to enjoy various conferences, seminars, workshops, etc. centred on this theme. Specifically, in 2025, Open Data Day activities will take place from 1 to 7 March.
Through its website you can see the various activities that will take place throughout the week all over the world. In this article we review some of those that you can follow from Spain, either because they take place in Spain or because they can be followed online.
Open Data Day 2025: Women Leading Open Data for Equality
Iniciativa Barcelona Open Data is organising a session on the afternoon of 6 March focusing on how open data can help address equality challenges. The event will bring together women experts in data technologies and open data, to share knowledge, experiences and best practices in both the publication and reuse of open data in this field.
The event will start at 17:30 with a welcome and introduction. This will be followed by two panel discussions and an interview:
- Round Table 1. Publishing institutions. Gender-sensitive data strategy to address the feminist agenda.
- DIALOGUE Data lab. Building feminist Tech Data practice.
- Round Table 2. Re-users. Projects based on the use of open data to address the feminist agenda.
The day will end at 19:40 with a cocktail and the opportunity for attendees to discuss the topics discussed and expand their network through networking.
How can you follow the event? This is an in-person event, which will be held at Ca l'Alier, Carrer de Pere IV, 362 (Barcelona).
Open access scientific and scholarly publishing as a tool to face the 21st century polycrisis: the key role of publishers
Organised by a private individual, Professor Damián Molgaray, this conference looks at the key role of editors in open access scientific and scholarly publishing. The idea is for participants to reflect on how open knowledge is positioned as a fundamental tool to face the challenges of the 21st century polycrisis, with a focus on Latin America.
The event will take place on 4 March at 11:00 in Argentina (15:00 in mainland Spain).
How can you follow the event? This is an online event through Google Meet.
WhoFundsThem
The organisation mySociety will show the results of its latest project. Over the last few months, a team of volunteers has collected data on the financial interests of the 650 MPs in the UK House of Commons, using sources such as the official Register of Interests, Companies House, MPs' attendance at debates etc. This data, checked and verified with MPs themselves through a 'right of reply' system, has been transformed into an easily accessible format, so that anyone can easily understand it, and will be published on the parliamentary tracking website TheyWorkForYou.
At this event, the project will be presented and the conclusions will be discussed. It takes place on Tuesday 4 at 14:00 London time (15:00 in Spain peninsular).
How can you follow the event? The session can be followed online, but registration is required. The event will be in English.
Science on the 7th: A conversation on Open Data & Air Quality
El viernes 7 a las 9:00 EST – (15:00 en España peninsular) se podrá seguir online una conferencia sobre datos abiertos y calidad del aire. La sesión reunirá a diversos expertos para debatir los temas de actualidad en materia de calidad del aire y salud mundial, y se examinará la contaminación atmosférica procedente de fuentes clave, como las partículas, el ozono y la contaminación relacionada con el tráfico.
Esta iniciativa está organizada por Health Effects Institute, una corporación sin ánimo de lucro que proporciona datos científicos sobre los efectos de la contaminación atmosférica en la salud.
A conference on open data and air quality will be available online on Friday 7 at 9:00 EST (15:00 in mainland Spain). The session will bring together a range of experts to discuss topical issues in air quality and global health, and will examine air pollution from key sources such as particulate matter, ozone and traffic-related pollution.
This initiative is organised by Health Effects Institute, a non-profit corporation that provides scientific data on the health effects of air pollution.
How can you follow the event? The conference, which will be in English, can be viewed on YouTube. No registration is required.
Deadline open for new event proposals
The above events are just a few examples of the activities that are part of this global celebration, but, as mentioned above, you can see all the actions on the initiative's website.
In addition, the deadline for registering new events is still open. If you have a proposal, you can register it via this link.
From datos.gob.es we invite you to join this week of celebration, which serves to vindicate the power of open data to generate positive changes in our society. Don't miss it!
Blog
The European Green Deal (Green Deal) is the European Union's (EU) sustainable growth strategy, designed to drive a green transition that transforms Europe into a just and prosperous society with a modern and competitive economy. Within this strategy, initiatives such as Target 55 (Fit for 55), which aims to reduce EU emissions by at least 55% by 2030, stand out, and the Nature Restoration Regulation(, which sets binding targets to restore ecosystems, habitats and species.
The European Data Strategy positions the EU as a leader in data-driven economies, promoting fundamental values such as privacy and sustainability. This strategy envisages the creation of data spaces sectoral spaces to encourage the availability and sharing of data, promoting its re-use for the benefit of society and various sectors, including the environment.
This article looks at how environmental data spaces, driven by the European Data Strategy, play a key role in achieving the goals of the European Green Pact by fostering the innovative and collaborative use of data.
Green Pact data space from the European Data Strategy
In this context, the EU is promoting the Green Deal Data Space, designed to support the objectives of the Green Deal through the use of data. This data space will allow sharing data and using its full potential to address key environmental challenges in several areas: preservation of biodiversity, sustainable water management, the fight against climate change and the efficient use of natural resources, among others.
In this regard, the European Data Strategy highlights two initiatives:
- On the one hand, the GreenData4all initiative which carries out an update of the INSPIRE directive to enable greater exchange of environmental geospatial data between the public and private sectors, and their effective re-use, including open access to the general public.
- On the other hand, the Destination Earth project proposes the creation of a digital twin of the Earth, using, among others, satellite data, which will allow the simulation of scenarios related to climate change, the management of natural resources and the prevention of natural disasters.
Preparatory actions for the development of the Green Pact data space
As part of its strategy for funding preparatory actions for the development of data spaces, the EU is funding the GREAT project (The Green Deal Data Space Foundation and its Community of Practice). This project focuses on laying the foundations for the development of the Green Deal data space through three strategic use cases: climate change mitigation and adaptation, zero pollution and biodiversity. A key aspect of GREAT is the identification and definition of a prioritised set of high-value environmental data (minimum but scalable set). This approach directly connects this project to the concept of high-value data defined in the European Open Data Directive (i.e. data whose re-use generates not only a positive economic impact, but also social and environmental benefits).. The high-value data defined in the Implementing Regulation include data related to Earth observation and the environment, including data obtained from satellites, ground sensors and in situ data.. These packages cover issues such as air quality, climate, emissions, biodiversity, noise, waste and water, all of which are related to the European Green Pact.
Differentiating aspects of the Green Pact data space
At this point, three differentiating aspects of the Green Pact data space can be highlighted.
- Firstly, its clearly multi-sectoral nature requires consideration of data from a wide variety of domains, each with their own specific regulatory frameworks and models.
- Secondly, its development is deeply linked to the territory, which implies the need to adopt a bottom-up approach (bottom-up) starting from concrete and local scenarios.
- Finally, it includes high-value data, which highlights the importance of active involvement of public administrations, as well as the collaboration of the private and third sectors to ensure its success and sustainability.
Therefore, the potential of environmental data will be significantly increased through European data spaces that are multi-sectoral, territorialised and with strong public sector involvement.
Development of environmental data spaces in HORIZON programme
In order to develop environmental data spaces taking into account the above considerations of both the European Data Strategy and the preparatory actions under the Horizon Europe (HORIZON) programme, the EU is funding four projects:
- Urban Data Spaces for Green dEal (USAGE).. This project develops solutions to ensure that environmental data at the local level is useful for mitigating the effects of climate change. This includes the development of mechanisms to enable cities to generate data that meets the FAIR principles (Findable, Accessible, Interoperable, Reusable) enabling its use for environmentally informed decision-making.
- All Data for Green Deal (AD4GD).. This project aims to propose a set of mechanisms to ensure that biodiversity, water quality and air quality data comply with the FAIR principles. They consider data from a variety of sources (satellite remote sensing, observation networks in situ, IoT-connected sensors, citizen science or socio-economic data).
- F.A.I.R. information cube (FAIRiCUBE). The purpose of this project is to create a platform that enables the reuse of biodiversity and climate data through the use of machine learning techniques. The aim is to enable public institutions that currently do not have easy access to these resources to improve their environmental policies and evidence-based decision-making (e.g. for the adaptation of cities to climate change).
- Biodiversity Building Blocks for Policy (B-Cubed).. This project aims to transform biodiversity monitoring into an agile process that generates more interoperable data. Biodiversity data from different sources, such as citizen science, museums, herbaria or research, are considered; as well as their consumption through business intelligence models, such as OLAP cubes, for informed decision-making in the generation of adequate public policies to counteract the global biodiversity crisis.
Environmental data spaces and research data
Finally, one source of data that can play a crucial role in achieving the objectives of the European Green Pact is scientific data emanating from research results. In this context, the European Union's European Open Science Cloud (EOSC) initiativeis an essential tool. EOSC is an open, federated digital infrastructure designed to provide the European scientific community with access to high quality scientific data and services, i.e. a true research data space. This initiative aims to facilitate interoperability and data exchange in all fields of research by promoting the adoption of FAIR principles, and its federation with the Green Pact data space is therefore essential.
Conclusions
Environmental data is key to meeting the objectives of the European Green Pact. To encourage the availability and sharing of this data, promoting its re-use, the EU is developing a series of environmental data space projects. Once in place, these data spaces will facilitate more efficient and sustainable management of natural resources, through active collaboration between all stakeholders (both public and private), driving Europe's ecological transition.
Jose Norberto Mazón, Professor of Computer Languages and Systems at the University of Alicante. The contents and views reflected in this publication are the sole responsibility of the author.
Blog
Geospatial data capture is essential for understanding our environment, making informed decisions and designing effective policies in areas such as urban planning, natural resource management or emergency response. In the past, this process was mainly manual and labour-intensive, based on ground measurements made with tools such as total stations and levels. Although these traditional techniques have evolved significantly and are still widely used, they have been complemented by automated and versatile methods that allow more efficient and detailed data collection.
The novelty in the current context lies not only in technological advances, which have improved the accuracy and efficiency of geospatial data collection, but also because it coincides with a widespread shift in mindset towards transparency and accessibility. This approach has encouraged the publication of the data obtained as open resources, facilitating their reuse in applications such as urban planning, energy management and environmental assessment. The combination of advanced technology and an increased awareness of the importance of information sharing marks a significant departure from traditional techniques.
In this article, we will explore some of the new methods of data capture, from photogrammetric flights with helicopters and drones, to ground-based systems such as mobile mapping, which use advanced sensors to generate highly accurate three-dimensional models and maps. In addition, we will learn how these technologies have empowered the generation of open data, democratising access to key geospatial information for innovation, sustainability and public-private collaboration.
Aerial photogrammetry: helicopters with advanced sensors
In the past, capturing geospatial data from the air involved long and complex processes. Analogue cameras mounted on aircraft generated aerial photographs that had to be processed manually to create two-dimensional maps. While this approach was innovative at the time, it also had limitations, such as lower resolution, long processing times and greater dependence on weather and daylight. However, technological advances have reduced these restrictions, even allowing operations at night or in adverse weather conditions.
Today, aerial photogrammetry has taken a qualitative leap forward thanks to the use of helicopters equipped with state-of-the-art sensors. The high-resolution digital cameras allow images to be captured at multiple angles, including oblique views that provide a more complete perspective of the terrain. In addition, the incorporation of thermal sensors and LiDAR (Light Detection and Ranging) technologies adds an unprecedented layer of detail and accuracy. These systems generate point clouds and three-dimensional models that can be integrated directly into geospatial analysis software, eliminating much of the manual processing.
| Features | Advantages | Disadvantages |
|---|---|---|
| Coverage and flexibility | It allows coverage of large areas and access to complex terrain. | May be limited for use in areas with airspace restrictions. Inaccessible to undergrouns or difficult to access areas such as tunnels. |
| Data type | Capture visual, thermal and topographic data in a single flight. | - |
| Precision | Generates point clouds and 3D models with high accuracy. | - |
| Efficiency in large projects | It allows coverage of large areas where drones do not have sufficient autonomy. | High operational cost compared to other technologies. |
|
Environmental impact and noise
|
- | Generates noise and greater environmental impact, limiting its use in sensitive areas. |
| Weather conditions | - | It depends on the weather; adverse conditions such as wind or rain affect its operation. |
| Amortised | - | High cost compared to drones or ground-based methods. |
Figure 1. Table with advantages and disadvantages of aerial photogrammetry with helicopters.
Mobile mapping: from backpacks to BIM integration
The mobile mapping is a geospatial data capture technique using vehicles equipped with cameras, LiDAR scanners, GPS and other advanced sensors. This technology allows detailed information to be collected as the vehicle moves, making it ideal for mapping urban areas, road networks and dynamic environments.
In the past, topographic surveys required stationary measurements, which meant traffic disruptions and considerable time to cover large areas. In contrast, mobile mapping has revolutionised this process, allowing data to be captured quickly, efficiently and with less impact on the environment. In addition, there are portable versions of this technology, such as backpacks with robotic scanners, which allow access to pedestrian or hard-to-reach areas.
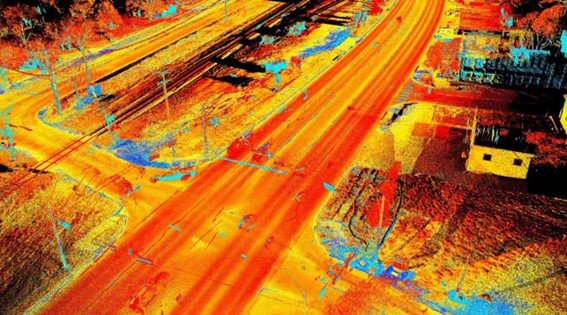
Figure 2. Image captured with mobile mapping techniques.
| Features | Advantages | Disadvantages |
|---|---|---|
| Speed | Captures data while the vehicle is on the move, reducing operating times. | Lower accuracy in areas with poor visibility for sensors (e.g. tunnels). |
| Urban coverage | Ideal for urban environments and complex road networks. | It is efficient in areas where vehicles can circulate, but its range is limited such as in rural or inaccessible terrain. |
| Flexibility of implementation | Available in portable (backpack) versions for pedestrian or hard-to-reach areas. | Portable equipment tends to have a shorter range than vehicular systems. |
| GIS and BIM implementation | It facilitates the generation of digital models and their use in planning and analysis. | Requires advanced software to process large volumes of data. |
| Impact on the environment | It does not require traffic interruptions or exclusive access to work areas. | Dependence on optimal environmental conditions, such as adequate light and climate. |
| Accessibility | Accessible to underground or hard-to-reach areas such as tunnels |
Figure 3. Table with advantages and disadvantages of mobile mopping.
The mobile mapping is presented as a versatile and efficient solution for capturing geospatial data on the move, becoming a key tool for the modernisation of urban and territorial management systems.
HAPS and ballons: new heights for information capture
HAPS (High-Altitude Platform Stations) and hot-air balloons represent an innovative and efficient alternative for capturing geospatial data from high altitudes. These platforms, located in the stratosphere or at controlled altitudes, combine features of drones and satellites, offering an intermediate solution that stands out for its versatility and sustainability:
- HAPS, like zeppelins and similar aircraft, operate in the stratosphere, at altitudes between 18 and 20 kilometres, allowing a wide and detailed view of the terrain.
- The aerostatic balloons, on the other hand, are ideal for local or temporary studies, thanks to their easiness of deployment and operation at lower altitudes.
Both technologies can be equipped with high-resolution cameras, LiDAR sensors, thermal instruments and other advanced technologies for data capture.
| Features | Advantages | Disadvantages |
|---|---|---|
| Useful | Large capture area, especially with HAPS in the stratosphere. | Limited coverage compared to satellites in orbit. |
| Sustainability | Lower environmental impact and energy footprint compared to helicopters or aeroplanes. | Dependence on weather conditions for deployment and stability. |
| Amortised | Lower operating costs than traditional satellites. | Higher initial investment than drones or ground equipment. |
| Versatility | Ideal for temporary or emergency projects. | Limited range in hot air balloons. |
| Duration of operation | HAPS can operate for long periods (days or weeks). | Hot air balloons have a shorter operating time. |
Figure 4. Table with advantages and disadvantages of HAPS and ballons
HAPS and balloons are presented as key tools to complement existing technologies such as drones and satellites, offering new possibilities in geospatial data collection in a sustainable, flexible and efficient way. As these technologies evolve, their adoption will expand access to crucial data for smarter land and resource management.
Satellite technology: PAZ satellite and its future with PAZ-2
Satellite technology is a fundamental tool for capturing geospatial data globally. Spain has taken significant steps in this field with the development and launch of the PAZ satellite. This satellite, initially designed for security and defence purposes, has shown enormous potential for civilian applications such as environmental monitoring, natural resource management and urban planning.
PAZ is an Earth observation satellite equipped with a synthetic aperture radar (SAR), which allows high-resolution imaging, regardless of weather or light conditions.
The upcoming launch of PAZ-2 (planned for 2030) promises to further expand Spain''s observation capabilities. This new satellite, designed with technological improvements, aims to complement the functions of PAZ and increase the availability of data for civil and scientific applications. Planned improvements include:
- Higher image resolution.
- Ability to monitor larger areas in less time.
- Increased frequency of captures for more dynamic analysis.
| Feature | Advantages | Disadvantages |
|---|---|---|
| Global coverage | Ability to capture data from anywhere on the planet. | Limitations in resolution compared to more detailed terrestrial technologies. |
| Climate independance | SAR sensors allow captures even in adverse weather conditions. | |
| Data frequency | PAZ-2 will improve the frequency of captures, ideal for continuous monitoring. | Limited time in the lifetime of the satellite. |
| Access to open data | It encourages re-use in civil and scientific projects. | Requires advanced infrastructure to process large volumes of data. |
Figure 5. Table with advantages and disadvantages of PAZ and PAZ-2 satellite technology
With PAZ and the forthcoming PAZ-2, Spain strengthens its position in the field of satellite observation, opening up new opportunities for efficient land management, environmental analysis and the development of innovative solutions based on geospatial datas. These satellites are not only a technological breakthrough, but also a strategic tool to promote sustainability and international cooperation in data access.
Conclusion: challenges and opportunities in data management
The evolution of geospatial data capture techniques offers a unique opportunity to improve the accuracy, accessibility and quality of data, and in the specific case of open data, it is essential to foster transparency and re-use of public information. However, this progress cannot be understood without analysing the role played by technological tools in this process.
Innovations such as LiDAR in helicopters, Mobile Mapping, SAM, HAPS and satellites such as PAZ and PAZ-2 not only optimise data collection, but also have a direct impact on data quality and availability.
In short, these technological tools generate high quality information that can be made available to citizens as open data, a situation that is being driven by the shift in mindset towards transparency and accessibility. This balance makes open data and technological tools complementary, essential to maximise the social, economic and environmental value of geospatial data.
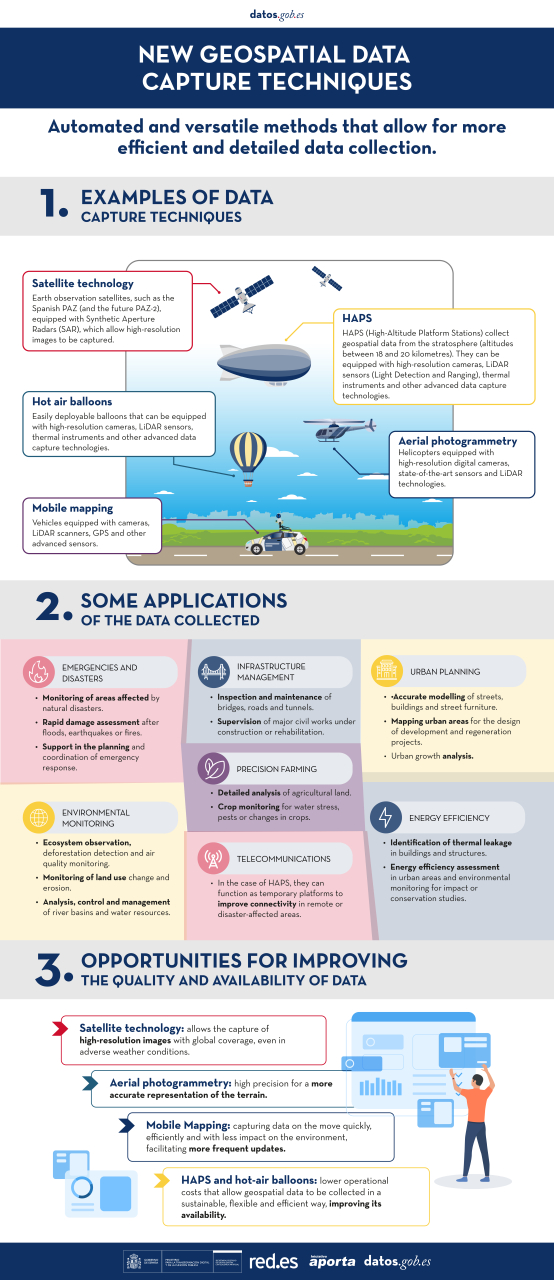
You can see a summary of these techniques and their applications in the following infographic:
Content prepared by Mayte Toscano, Senior Consultant in Data Economy Technologies. The contents and points of view reflected in this publication are the sole responsibility of the author.
Noticia
Promoting the data culture is a key objective at the national level that is also shared by the regional administrations. One of the ways to achieve this purpose is to award those solutions that have been developed with open datasets, an initiative that enhances their reuse and impact on society.
On this mission, the Junta de Castilla y León and the Basque Government have been organising open data competitions for years, a subject we talked about in our first episode of the datos.gob.es podcast that you can listen to here.
In this post, we take a look at the winning projects in the latest editions of the open data competitions in the Basque Country and Castilla y León.
Winners of the 8th Castile and Leon Open Data Competition
In the eighth edition of this annual competition, which usually opens at the end of summer, 35 entries were submitted, from which 8 winners were chosen in different categories.
Ideas category: participants had to describe an idea to create studies, services, websites or applications for mobile devices. A first prize of 1,500€ and a second prize of 500€ were awarded.
- First prize: Green Guardians of Castilla y León presented by Sergio José Ruiz Sainz. This is a proposal to develop a mobile application to guide visitors to the natural parks of Castilla y León. Users can access information (such as interactive maps with points of interest) as well as contribute useful data from their visit, which enriches the application.
- Second prize: ParkNature: intelligent parking management system in natural spaces presented by Víctor Manuel Gutiérrez Martín. It consists of an idea to create an application that optimises the experience of visitors to the natural areas of Castilla y León, by integrating real-time data on parking and connecting with nearby cultural and tourist events.
Products and Services Category: Awarded studies, services, websites or applications for mobile devices, which must be accessible to all citizens via the web through a URL. In this category, first, second and third prizes of €2,500, €1,500 and €500 respectively were awarded, as well as a specific prize of €1,500 for students.
- First prize: AquaCyL from Pablo Varela Vázquez. It is an application that provides information about the bathing areas in the autonomous community.
- Second prize: ConquistaCyL presented by Markel Juaristi Mendarozketa and Maite del Corte Sanz. It is an interactive game designed for tourism in Castilla y León and learning through a gamified process.
- Third prize: All the sport of Castilla y León presented by Laura Folgado Galache. It is an app that presents all the information of interest associated with a sport according to the province.
- Student prize: Otto Wunderlich en Segovia by Jorge Martín Arévalo. It is a photographic repository sorted according to type of monuments and location of Otto Wunderlich's photographs.
Didactic Resource Category: consisted of the creation of new and innovative open didactic resources to support classroom teaching. These resources were to be published under Creative Commons licences. A single first prize of €1,500 was awarded in this category.
- First prize: StartUp CyL: Business creation through Artificial Intelligence and Open Data presented by José María Pérez Ramos. It is a chatbot that uses the ChatGPT API to assist in setting up a business using open data.
Data Journalism category: awarded for published or updated (in a relevant way) journalistic pieces, both in written and audiovisual media, and offered a prize of €1,500.
- First prize: Codorniz, perdiz y paloma torcaz son las especies más cazadas en Burgos, presented by Sara Sendino Cantera, which analyses data on hunting in Burgos.
Winners of the 5th edition of the Open Data Euskadi Open Data Competition
As in previous editions, the Basque open data portal opened two prize categories: an ideas competition and an applications competition, each of which was divided into several categories. On this occasion, 41 applications were submitted for the ideas competition and 30 for the applications competition.
Idea competition: In this category, two prizes of €3,000 and €1,500 have been awarded in each category.
Health and Social Category
- First prize: Development of a Model for Predicting the Volume of Patients attending the Emergency Department of Osakidetza by Miren Bacete Martínez. It proposes the development of a predictive model using time series capable of anticipating both the volume of people attending the emergency department and the level of severity of cases.
- Second prize: Euskoeduca by Sandra García Arias. It is a proposed digital solution designed to provide personalised academic and career guidance to students, parents and guardians.
Category Environment and Sustainability
- First prize: Baratzapp by Leire Zubizarreta Barrenetxea. The idea consists of the development of a software that facilitates and assists in the planning of a vegetable garden by means of algorithms that seek to enhance the knowledge related to the self-consumption vegetable garden, while integrating, among others, climatological, environmental and plot information in a personalised way for the user.
- Second prize: Euskal Advice by Javier Carpintero Ordoñez. The aim of this proposal is to define a tourism recommender based on artificial intelligence.
General Category
- First prize: Lanbila by Hodei Gonçalves Barkaiztegi. It is a proposed app that uses generative AI and open data to match curriculum vitae with job offers in a semantic way.. It provides personalised recommendations, proactive employment and training alerts, and enables informed decisions through labour and territorial indicators.
- Second prize: Development of an LLM for the interactive consultation of Open Data of the Basque Government by Ibai Alberdi Martín. The proposal consists in the development of a Large Scale Language Model (LLM) similar to ChatGPT, specifically trained with open data, focused on providing a conversational and graphical interface that allows users to get accurate answers and dynamic visualisations.
Applications competition: this modality has selected one project in the web services category, awarded with €8,000, and two more in the General Category, which have received a first prize of €8,000 and a second prize of €5,000.
Category Web Services
- First prize: Bizidata: Plataforma de visualización del uso de bicicletas en Vitoria-Gasteiz by Igor Díaz de Guereñu de los Ríos. It is a platform that visualises, analyses and downloads data on bicycle use in Vitoria-Gasteiz, and explores how external factors, such as the weather and traffic, influence bicycle use.
General Category
- First prize: Garbiñe AI by Beatriz Arenal Redondo. It is an intelligent assistant that combines Artificial Intelligence (AI) with open data from Open Data Euskadi to promote the circular economy and improve recycling rates in the Basque Country.
- Second prize: Vitoria-Gasteiz Businessmap by Zaira Gil Ozaeta. It is an interactive visualisation tool based on open data, designed to improve strategic decisions in the field of entrepreneurship and economic activity in Vitoria-Gasteiz.
All these award-winning solutions reuse open datasets from the regional portal of Castilla y León or Euskadi, as the case may be. We encourage you to take a look at the proposals that may inspire you to participate in the next edition of these competitions. Follow us on social media so you don't miss out on this year's calls!
Application
Tupreciodeluz.com offers daily information on the price of electricity, showing the cheapest price of the day, as well as the average price of the last 24 hours and the most expensive time slot. The aim is to allow consumers adhering to the regulated market tariff (PVPC) to modulate their consumption in order to save on their electricity bill.
The website also features an artificial intelligence assistant for energy advice, and measures to promote efficiency and responsible energy consumption.
In addition, consumers can use a solar sizer to find out the feasibility of installing solar energy in their home or business.
The website also has a blog where the most relevant news for consumers is published in a summarised and entertaining way.
Entrevista
In this episode we will delve into the importance of three related categories of high-value datasets. These are Earth observation and environmental data, geospatial data and mobility data. To tell us about them, we have interviewed two experts in the field:
- Paloma Abad Power, deputy director of the National Centre for Geographic Information (CNIG).
- Rafael Martínez Cebolla, geographer of the Government of Aragón.
With them we have explored how these high-value datasets are transforming our environment, contributing to sustainable development and technological innovation.
Listen to the full podcast (only available in Spanish)
Summary / Transcript of the interview
1. What are high-value datasets and why are their important?
Paloma Abad Power: According to the regulation, high-value datasets are those that ensure highest socio-economic potential and, for this, they must be easy to find, i.e. they must be accessible, interoperable and usable. And what does this mean? That means that the datasets must have their descriptions, i.e. the online metadata, which report the statistics and their properties, and which can be easily downloaded or used.
In many cases, these data are often reference data, i.e. data that serve to generate other types of data, such as thematic data, or can generate added value.
Rafael Martínez Cebolla: They could be defined as those datasets that represent phenomena that are useful for decision making, for any public policy or for any action that a natural or legal person may undertake.
In this sense, there are already some directives, which are not so recent, such as the Water Framework Directive or the INSPIRE Directive, which motivated this need to provide shared data under standards that drive the sustainable development of our society.
2. These high-value data are defined by a European Directive and an Implementing Regulation which dictated six categories of high-value datasets. On this occasion we will focus on three of them: Earth observation and environmental data, geospatial data and mobility data. What do these three categories of data have in common and what specific datasets do they cover?
Paloma Abad Power: In my opinion, these data have in common the geographical component, i.e. they are data located on the ground and therefore serve to solve problems of different nature and linked to society.
Thus, for example, we have, with national coverage, the National Aerial Orthophotography Plan (PNOA), which are the aerial images, the System of Land Occupation Information (SIOSE), cadastral parcels, boundary lines, geographical names, roads, postal addresses, protected sites - which can be both environmental and also castles, i.e. historical heritage- etc. And these categories cover almost all the themes defined by the annexes of the INSPIRE directive.
Rafael Martínez Cebolla: It is necessary to know what is pure geographic information, with a direct geographic reference, as opposed to other types of phenomena that have indirect geographic references. In today's world, 90% of information can be located, either directly or indirectly. Today more than ever, geographic tagging is mandatory for any corporation that wants to implement a certain activity, be it social, cultural, environmental or economic: the implementation of renewable energies, where I am going to eat today, etc. These high-value datasets enhance these geographical references, especially of an indirect nature, which help us to make a decision.
3. Which agencies publish these high-value datasets? In other words, where could a user locate datasets in these categories?
Paloma Abad Power: It is necessary to highlight the role of the National Cartographic System, which is an action model in which the organisations of the NSA (National State Administration) and the autonomous communities participate. It is coordinating the co-production of many unique products, funded by these organisations.
These products are published through interoperable web services. They are published, in this case, by the National Center for Geographic Information (CNIG), which is also responsible for much of the metadata for these products.
They could be located through the Catalogues of the IDEE (Spatial Data Infrastructure of Spain) or the Official Catalogue of INSPIRE Data and Services, which is also included in datos.gob.es and the European Data Portal.
And who can publish? All bodies that have a legal mandate for a product classified under the Regulation. Examples: all the mapping bodies of the Autonomous Communities, the General Directorate of Cadastre, Historical Heritage, the National Statistics Institute, the Geological and Mining Institute (IGME), the Hydrographic Institute of the Navy, the Ministry of Agriculture, Fisheries and Food (MAPA), the Ministry for Ecological Transition and the Demographic Challenge, etc. There are a multitude of organisations and many of them, as I have mentioned, participate in the National Cartographic System, provide the data and generate a single service for the citizen.
Rafael Martínez Cebolla: The National Cartographic System defines very well the degree of competences assumed by the administrations. In other words, the public administration at all levels provides official data, assisted by private enterprise, sometimes through public procurement.
The General State Administration goes up to scales of 1:25,000 in the case of the National Geographic Institute (IGN) and then the distribution of competencies for the rest of the scales is for the autonomous or local administrations. In addition, there are a number of actors, such as hydrographic confederations, state departments or the Cadastre, which have under their competences the legal obligation to generate these datasets.
For me it is an example of how it should be distributed, although it is true that it is then necessary to coordinate very well, through collegiate bodies, so that the cartographic production is well integrated.
Paloma Abad Power: There are also collaborative projects, such as, for example, a citizen map, technically known as an X, Y, Z map, which consists of capturing the mapping of all organisations at national and local level. That is, from small scales 1:1,000,000 or 1:50,000,000 to very large scales, such as 1:1000, to provide the citizen with a single multi-scale map that can be served through interoperable and standardised web services.
4. Do you have any other examples of direct application of this type of data?
Rafael Martínez Cebolla: A clear example was seen with the pandemic, with the mobility data published by the National Institute of Statistics. These were very useful data for the administration, for decision making, and from which we have to learn much more for the management of future pandemics and crises, including economic crises. We need to learn and develop our early warning systems.
I believe that this is the line of work: data that is useful for the general public. That is why I say that mobility has been a clear example, because it was the citizen himself who was informing the administration about how he was moving.
Paloma Abad Power: I am going to contribute some data. For example, according to statistics from the National Cartographic System services, the most demanded data are aerial images and digital terrain models. In 2022 there were 8 million requests and in 2023 there were 19 million requests for orthoimages alone.
Rafael Martínez Cebolla: I would like to add that this increase is also because things are being done well. On the one hand, discovery systems are improved. My general feeling is that there are many successful example projects, both from the administration itself and from companies that need this basic information to generate their products.
There was an application that was generated very quickly with de-escalation - you went to a website and it told you how far you could walk through your municipality - because people wanted to get out and walk. This example arises from spatial data that have moved out of the public administration. I believe that this is the importance of successful examples, which come from people who see a compelling need.
5. And how do you incentivise such re-use?
Rafael Martínez Cebolla: I have countless examples. Incentivisation also involves promotion and marketing, something that has sometimes failed us in the public administration. You stick to certain competences and it seems that just putting it on a website is enough. And that is not all.
We are incentivising re-use in two ways. On the one hand, internally, within the administration itself, teaching them that geographic information is useful for planning and evaluating public policies. And I give you the example of the Public Health Atlas of the Government of Aragon, awarded by an Iberian society of epidemiology the year before the pandemic. It was useful for them to know what the health of the Aragonese was like and what preventive measures they had to take.
As for the external incentives, in the case of the Geographic Institute of Aragon, it was seen that the profile entering the geoportal was very technical. The formats used were also very technical, which meant that the general public was not reached. To solve this problem, we promoted portals such as the IDE didactica, a portal for teaching geography, which reaches any citizen who wants to learn about the territory of Aragon.
Paloma Abad Power: I would like to highlight the economic benefit of this, as was shown, for example, in the economic study carried out by the National Centre for Graphic Information with the University of Leuven to measure the economic benefit of the Spatial Data Infrastructure of Spain. It measure the benefit of private companies using free and open services, rather than using, for example, Google Maps or other non-open sources..
Rafael Martínez Cebolla: For better and for worse, because the quality of the official data sometimes we wish it were better. Both Paloma in the General State Administration and I in the regional administration sometimes know that there are official data where more money needs to be invested so that the quality of the data would be better and could be reusable.
But it is true that these studies are key to know in which dimension high-value datasets move. That is to say, having studies that report on the real benefit of having a spatial data infrastructure at state or regional level is, for me, key for two things: for the citizen to understand its importance and, above all, for the politician who arrives every N years to understand the evolution of these platforms and the revolution in geospatial information that we have experienced in the last 20 years.
6. The Geographic Institute of Aragon has also produced a report on the advantages of reusing this type of data, is that right?
Rafael Martínez Cebolla: Yes, it was published earlier this year. We have been doing this report internally for three or four years, because we knew we were going to make the leap to a spatial knowledge infrastructure and we wanted to see the impact of implementing a knowledge graph within the data infrastructure. The Geographic Institute of Aragon has made an effort in recent years to analyse the economic benefit of having this infrastructure available for the citizens themselves, not for the administration. In other words, how much money Aragonese citizens save in their taxes by having this infrastructure. Today we know that having a geographic information platform saves approximately 2 million euros a year for the citizens of Aragon.
I would like to see the report for the next January or February, because I think the leap will be significant. The knowledge graph was implemented in April last year and this gap will be felt in the year ahead. We have noticed a significant increase in requests, both for viewing and downloading.
Basically from one year to the next, we have almost doubled both the number of accesses and downloads. This affects the technological component: you have to redesign it. More people are discovering you, more people are accessing your data and, therefore, you have to dedicate more investment to the technological component, because it is being the bottleneck.
7. What do you see as the challenges to be faced in the coming years?
Paloma Abad Power: In my opinion, the first challenge is to get to know the user in order to provide a better service. The technical user, the university students, the users on the street, etc. We are thinking of doing a survey when the user is going to use our geographic information. But of course, such surveys sometimes slow down the use of geographic information. That is the great challenge: to know the user in order to make services more user-friendly, applications, etc. and to know how to get to what they want and give it to them better.
There is also another technical challenge. When the spatial infrastructures began, the technical level was very high, you had to know what a visualisation service was, the metadata, know the parameters, etc. This has to be eliminated, the user can simply say I want, for example, to consult and visualise the length of the Ebro river, in a more user-friendly way. Or for example the word LiDAR, which was the Italian digital model with high accuracy. All these terms need to be made much more user-friendly.
Rafael Martínez Cebolla: Above all, let them be discovered. My perception is that we must continue to promote the discovery of spatial data without having to explain to the untrained user, or even to some technicians, that we must have a data, a metadata, a service..... No, no. Basically it is that generalist search engines know how to find high-value datasets without knowing that there is such a thing as spatial data infrastructure.
It is a matter of publishing the data under friendly standards, under accessible versions and, above all, publishing them in permanent URIs, which are not going to change. In other words, the data will improve in quality, but will never change.
And above all, from a technical point of view, both spatial data infrastructures and geoportals and knowledge infrastructures have to ensure that high-value information nodes are related to each other from a semantic and geographical point of view. I understand that knowledge networks will help in this regard. In other words, mobility has to be related to the observation of the territory, to public health data or to statistical data, which also have a geographical component. This geographical semantic relationship is key for me.
Interview clips
1. What are high-value datasets and why are their important?
2. Where can a user locate geographic data?
3. How is the reuse of data with a geographic component being encouraged?
Blog
A digital twin is a virtual, interactive representation of a real-world object, system or process. We are talking, for example, about a digital replica of a factory, a city or even a human body. These virtual models allow simulating, analysing and predicting the behaviour of the original element, which is key for optimisation and maintenance in real time.
Due to their functionalities, digital twins are being used in various sectors such as health, transport or agriculture. In this article, we review the benefits of their use and show two examples related to open data.
Advantages of digital twins
Digital twins use real data sources from the environment, obtained through sensors and open platforms, among others. As a result, the digital twins are updated in real time to reflect reality, which brings a number of advantages:
- Increased performance: one of the main differences with traditional simulations is that digital twins use real-time data for modelling, allowing better decisions to be made to optimise equipment and system performance according to the needs of the moment.
- Improved planning: using technologies based on artificial intelligence (AI) and machine learning, the digital twin can analyse performance issues or perform virtual "what-if" simulations. In this way, failures and problems can be predicted before they occur, enabling proactive maintenance.
- Cost reduction: improved data management thanks to a digital twin generates benefits equivalent to 25% of total infrastructure expenditure. In addition, by avoiding costly failures and optimizing processes, operating costs can be significantly reduced. They also enable remote monitoring and control of systems from anywhere, improving efficiency by centralizing operations.
- Customization and flexibility: by creating detailed virtual models of products or processes, organizations can quickly adapt their operations to meet changing environmental demands and individual customer/citizen preferences. For example, in manufacturing, digital twins enable customized mass production, adjusting production lines in real time to create unique products according to customer specifications. On the other hand, in healthcare, digital twins can model the human body to customize medical treatments, thereby improving efficacy and reducing side effects.
- Boosting experimentation and innovation: digital twins provide a safe and controlled environment for testing new ideas and solutions, without the risks and costs associated with physical experiments. Among other issues, they allow experimentation with large objects or projects that, due to their size, do not usually lend themselves to real-life experimentation.
- Improved sustainability: by enabling simulation and detailed analysis of processes and systems, organizations can identify areas of inefficiency and waste, thus optimizing the use of resources. For example, digital twins can model energy consumption and production in real time, enabling precise adjustments that reduce consumption and carbon emissions.
Examples of digital twins in Spain
The following three examples illustrate these advantages.
GeDIA project: artificial intelligence to predict changes in territories
GeDIA is a tool for strategic planning of smart cities, which allows scenario simulations. It uses artificial intelligence models based on existing data sources and tools in the territory.
The scope of the tool is very broad, but its creators highlight two use cases:
- Future infrastructure needs: the platform performs detailed analyses considering trends, thanks to artificial intelligence models. In this way, growth projections can be made and the needs for infrastructures and services, such as energy and water, can be planned in specific areas of a territory, guaranteeing their availability.
- Growth and tourism: GeDIA is also used to study and analyse urban and tourism growth in specific areas. The tool identifies patterns of gentrification and assesses their impact on the local population, using census data. In this way, demographic changes and their impact, such as housing needs, can be better understood and decisions can be made to facilitate equitable and sustainable growth.
This initiative has the participation of various companies and the University of Malaga (UMA), as well as the financial backing of Red.es and the European Union.
Digital twin of the Mar Menor: data to protect the environment
The Mar Menor, the salt lagoon of the Region of Murcia, has suffered serious ecological problems in recent years, influenced by agricultural pressure, tourism and urbanisation.
To better understand the causes and assess possible solutions, TRAGSATEC, a state-owned environmental protection agency, developed a digital twin. It mapped a surrounding area of more than 1,600 square kilometres, known as the Campo de Cartagena Region. In total, 51,000 nadir images, 200,000 oblique images and more than four terabytes of LiDAR data were obtained.
Thanks to this digital twin, TRAGSATEC has been able to simulate various flooding scenarios and the impact of installing containment elements or obstacles, such as a wall, to redirect the flow of water. They have also been able to study the distance between the soil and the groundwater, to determine the impact of fertiliser seepage, among other issues.
Challenges and the way forward
These are just two examples, but they highlight the potential of an increasingly popular technology. However, for its implementation to be even greater, some challenges need to be addressed, such as initial costs, both in technology and training, or security, by increasing the attack surface. Another challenge is the interoperability problems that arise when different public administrations establish digital twins and local data spaces. To address this issue further, the European Commission has published a guide that helps to identify the main organisational and cultural challenges to interoperability, offering good practices to overcome them.
In short, digital twins offer numerous advantages, such as improved performance or cost reduction. These benefits are driving their adoption in various industries and it is likely that, as current challenges are overcome, digital twins will become an essential tool for optimising processes and improving operational efficiency in an increasingly digitised world.
Blog
Many people use apps to get around in their daily lives. Apps such as Google Maps, Moovit or CityMapper provide the fastest and most efficient route to a destination. However, what many users are unaware of is that behind these platforms lies a valuable source of information: open data. By reusing public datasets, such as those related to air quality, traffic or public transport, these applications can provide a better service.
In this post, we will explore how the reuse of open data by these platforms empowers a smarter and more sustainable urban ecosystem .
Google Maps: aggregates air quality information and transport data into GTFS.
More than a billion people use Google Maps every month around the world. The tech giant offers a free, up-to-date world map that draws its data from a variety of sources, some of them open.
One of the functions provided by the app is information about the air quality in the user's location. The Air Quality Index (AQI) is a parameter that is determined by each country or region. The European benchmark can be consulted on this map which shows air quality by geolocated zones in real time.
To display the air quality of the user's location, Google Maps applies a model based on a multi-layered approach known as the "fusion approach". This method combines data from several input sources and weights the layers with a sophisticated procedure. The input layers are:
- Government reference monitoring stations
- Commercial sensor networks
- Global and regional dispersion models
- Dust and smoke fire models
- Satellite information
- Traffic data
- Ancillary information such as surface area
- Meteorology
In the case of Spain, this information is obtained from open data sources such as the Ministry of Ecological Transition and Demographic Challenge, the Regional Ministry of Environment, Territory and Housing of the Xunta de Galicia or the Community of Madrid. Open data sources used in other countries around the worldcan be found here .
Another functionality offered by Google Maps to plan the best routes to reach a destination is the information on public transport. These data are provided on a voluntary basis by the public companies providing transport services in each city. In order to make this open data available to the user, it is first dumped into Google Transit and must comply with the open public transport standard GTFS (General Transit Feed Specification).
Moovit: reusing open data to deliver real-time information
Moovit is another urban mobility app most used by Spaniards, which uses open and collaborative data to make it easier for users to plan their journeys by public transport.
Since its launch in 2012, the free-to-download app offers real-time information on the different transport options, suggests the best routes to reach the indicated destination, guides users during their journey (how long they have to wait, how many stops are left, when they have to get off, etc.) and provides constant updates in the event of any alteration in the service.
Like other mobility apps , it is also available in offline mode and allows you to save routes and frequent lines in "Favourites". It is also an inclusive solution as it integrates VoiceOver (iOs) or TalkBack (Android) for blind people.
The platform not only leverages open data provided by governments and local authorities, but also collects information from its users, allowing it to offer a dynamic and constantly updated service.
CityMapper: born as a reuser of open mobility data
The CityMapper development team recognises that the application was born with an open DNA that still remains. They reuse open datasets from, for example, OpenStreetMap at global level or RENFE and Cercanías Bilbao at national level. As the application becomes available in more cities, the list of open data reference sources from which it draws information grows.
The platform offers real-time information on public transport routes, including bus, train, metro and bike sharing. It also adds options for walking, cycling and ridesharing. It is designed to provide the most efficient and fastest route to a destinationby integrating data from different modes of transport into a single interface.
As we published in the monographic report "Municipal Innovation through Open Data" CityMapper mainly uses open data from local transport authorities, typically using the GTFS (General Transit Feed Specification) standard . However, when this data is not sufficient or accurate enough, CityMapper combines it with datasets generated by the application's own users who voluntarily collaborate. It also uses data enhanced and managed by the work of the company's own local employees. All this data is combined with artificial intelligence algorithms developed to optimise routes and provide recommendations tailored to users' needs.
In conclusion, the use of open data in transport is driving a significant transformation in the mobility sector in cities. Through their contribution to applications, users can access up-to-date and accurate data, plan their journeys efficiently and make informed decisions. Governments, for their part, have taken on the role of facilitators by enabling the dissemination of data through open platforms, optimising resources and fostering collaboration across sectors. In addition, open data has created new opportunities for developers and the private sector, who have contributed with technological solutions such as Google Maps, Moovit or CityMapper. Ultimately, the potential of open data to transform the future of urban mobility is undeniable.