


visualizaciones de datos
-
 Data visualization: the best charts for representing comparisons
22-02-2023
Data visualization: the best charts for representing comparisons
22-02-2023
Data is a valuable source of knowledge for society. Public commitment to achieving data openness, public-private collaboration on data, and the development of applications with open data are actions that are part of the data economy, which seeks the...
-
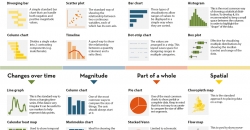 How to choose the right chart to visualise open data
05-01-2023
How to choose the right chart to visualise open data
05-01-2023
A statistical graph is a visual representation designed to contain a series of data whose objective is to highlight a specific part of the reality. However, organising a set of data in an informative way is not an easy task, especially, if we want to...
-
 11 libraries for creating data visualisations
03-05-2022
11 libraries for creating data visualisations
03-05-2022
Programming libraries are sets of code files that are used to develop software. Their purpose is to facilitate programming by providing common functionalities that have already been solved by other programmers. Libraries are an essential component for...
-
 The most popular data visualization APIs and libraries
03-06-2021
The most popular data visualization APIs and libraries
03-06-2021
A couple of weeks ago, we commented in this article the importance of data analysis tools to generate representations that allow a better understanding of the information and make better decisions. In this article we divide these tools into 2 categories...


