6 posts found
What can we find in the CRUE report "Data Analytics at the University"?
Last November 2023, Crue Spanish Universities published the report TIC360 "Data Analytics in the University". The report is an initiative of the Crue-Digitalisation IT Management working group and aims to show how the optimisation of data extraction and processing processes is key to the generation…
Artificial Intelligence applied to the identification and classification of diseases detected by radiodiagnosis
In this post we have described step-by-step a data science exercise in which we try to train a deep learning model with a view to automatically classifying medical images of healthy and sick people.
Diagnostic imaging has been around for many years in the hospitals of develo…
The role of universities in the dissemination of open data
Spanish universities have numerous quality data that have great economic and social potential. For this reason, for some time now we have been witnessing a data opening movement by universities in our country, with the aim of promoting the use and reuse of the information they generate, as well as i…
Google as a reuse of open data
The bet of the technological giant Google with open data it has been evident in various initiatives carried out in recent years. On the one hand, they launched the search engine Google Dataset Search, that facilitates the location of open data published in hundreds of repositories of international i…
Low coding tools for data analysis
The democratisation of technology in all areas is an unstoppable trend. With the spread of smartphones and Internet access, an increasing number of people can access high-tech products and services without having to resort to advanced knowledge or specialists. The world of data is no stranger to thi…
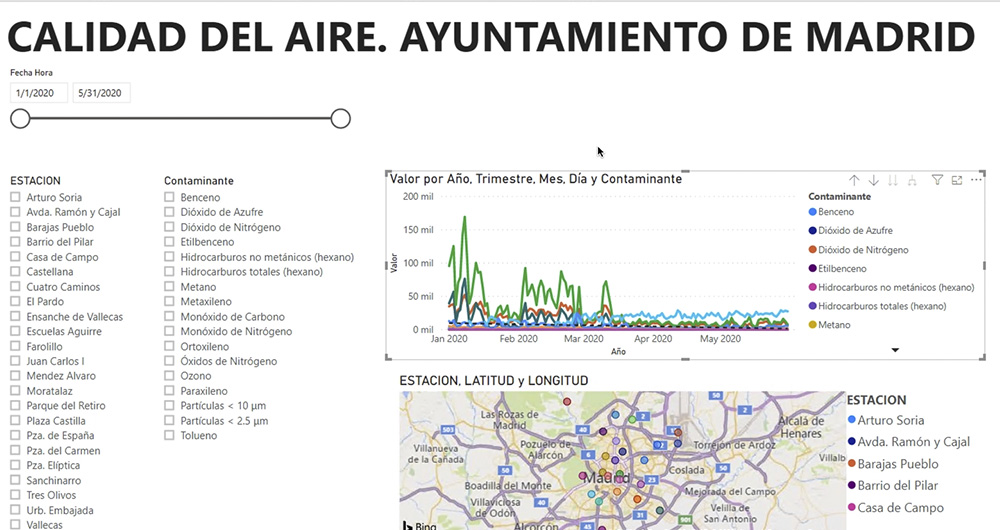
What is an interactive display? Here is an example
The visual representation of data helps our brain to digest large amounts of information quickly and easily. Interactive visualizations make it easier for non-experts to analyze complex situations represented as data.
As we introduced in our last post on this topic, graphical data visualization is a…


