7 posts found
Open Data Editor: discover the free and open source tool for processing data
How many times have you had a dataset in your hands that you needed to analyze, but you've run into errors, inconsistencies, or formatting issues that have caused you to lose hours of work? The reality is that, although we have more data available every day, we do not always have the necessary tools…
Hot OSM: Collaborative mapping to coordinate emergency response
The humanitarian crisis following the earthquake in Haiti in 2010 was the starting point for a voluntary initiative to create maps to identify the level of damage and vulnerability by areas, and thus to coordinate emergency teams. Since then, the collaborative mapping project known as Hot OSM (OpenS…
Artificial Intelligence applied to the identification and classification of diseases detected by radiodiagnosis
In this post we have described step-by-step a data science exercise in which we try to train a deep learning model with a view to automatically classifying medical images of healthy and sick people.
Diagnostic imaging has been around for many years in the hospitals of develo…
Formulas for accelerating data collaboration
After a period in which efforts were focused on releasing data, mainly from the public sector, in conditions in which it could be reused to create value in its different forms (economic, social, cultural, etc.), we are finding increasing activity around collaboration between organizations to solve b…
Low coding tools for data analysis
The democratisation of technology in all areas is an unstoppable trend. With the spread of smartphones and Internet access, an increasing number of people can access high-tech products and services without having to resort to advanced knowledge or specialists. The world of data is no stranger to thi…
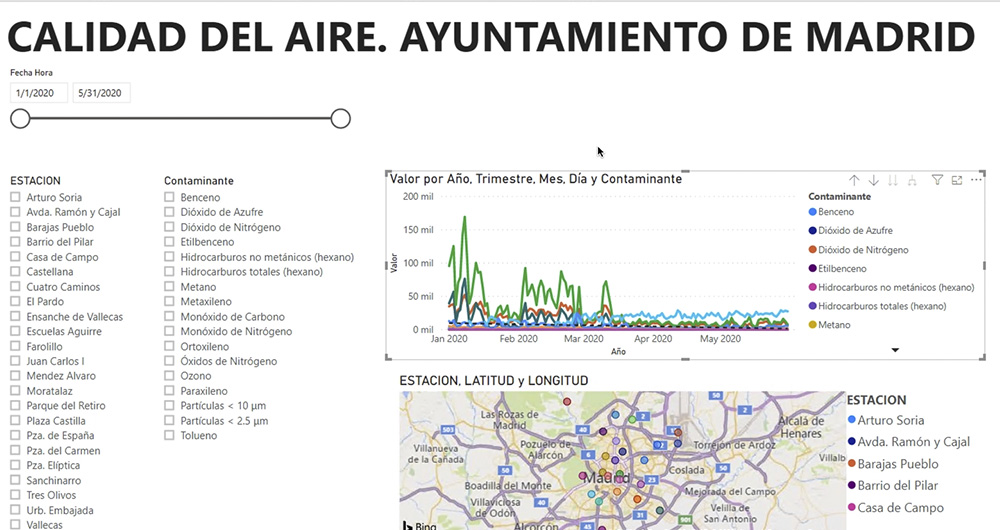
What is an interactive display? Here is an example
The visual representation of data helps our brain to digest large amounts of information quickly and easily. Interactive visualizations make it easier for non-experts to analyze complex situations represented as data.
As we introduced in our last post on this topic, graphical data visualization is a…
The ecosystem that nourishes open data
On too many occasions, open data initiatives are born in governments as purely technical projects whose purpose is simply creating a data catalog, when, in reality, they should be seen as collaborative transformation projects that take place within complex and variable environments, in which th…


