5 posts found
Discovering the Digital Product Passport (DPP) and CIRPASS: A Look into the Future of the Circular Economy
Digital transformation has reached almost every aspect and sector of our lives, and the world of products and services is no exception. In this context, the Digital Product Passport (DPP) concept is emerging as a revolutionary tool to foster sustainability and the circular economy. Accompanied by in…
Data visualization: the best charts for representing comparisons
Data is a valuable source of knowledge for society. Public commitment to achieving data openness, public-private collaboration on data, and the development of applications with open data are actions that are part of the data economy, which seeks the innovative, ethical, and practical use of data to…
How to choose the right chart to visualise open data
A statistical graph is a visual representation designed to contain a series of data whose objective is to highlight a specific part of the reality. However, organising a set of data in an informative way is not an easy task, especially, if we want to capture the viewer’s attention and to present the…
The role of open data and artificial intelligence in the European Green Deal
Just a few months ago, in November 2019, Ursula von der Leyen, still as a candidate for the new European Commission 2019-2024, presented the development of a European Green Deal as the first of the six guidelines that would shape the ambitions of her mandate.
The global situation has changed radical…
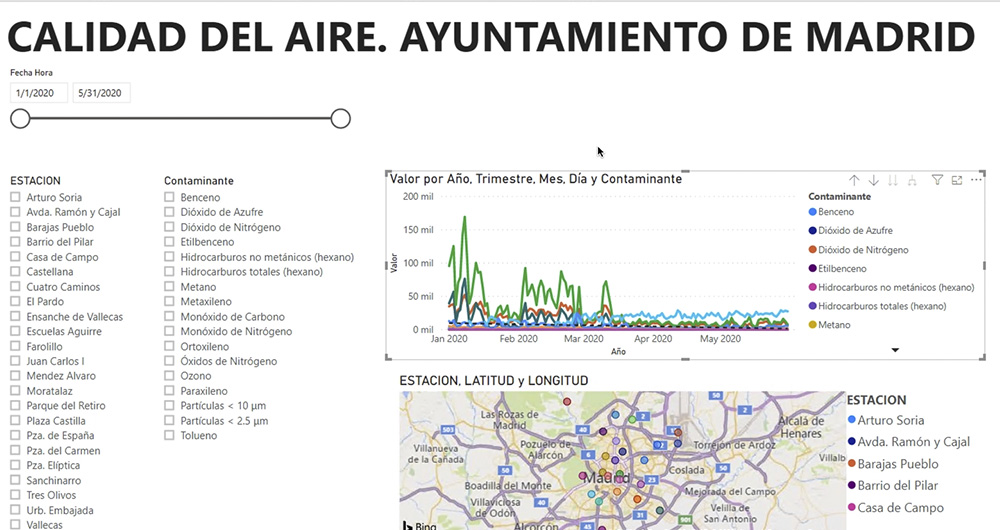
What is an interactive display? Here is an example
The visual representation of data helps our brain to digest large amounts of information quickly and easily. Interactive visualizations make it easier for non-experts to analyze complex situations represented as data.
As we introduced in our last post on this topic, graphical data visualization is a…


