5 posts found
OGP's assessment and challenges ahead of the forthcoming Global Summit in Spain
The international open government community is preparing for the 9th Global Summit of the Open Government Partnership (OGP), which will take place in Vitoria-Gasteiz next October.. For three days, government representatives, civil society leaders and policy makers from around the world will exchange…

Data visualization: the best charts for representing comparisons
Data is a valuable source of knowledge for society. Public commitment to achieving data openness, public-private collaboration on data, and the development of applications with open data are actions that are part of the data economy, which seeks the innovative, ethical, and practical use of data to…

How to choose the right chart to visualise open data
A statistical graph is a visual representation designed to contain a series of data whose objective is to highlight a specific part of the reality. However, organising a set of data in an informative way is not an easy task, especially, if we want to capture the viewer’s attention and to present the…

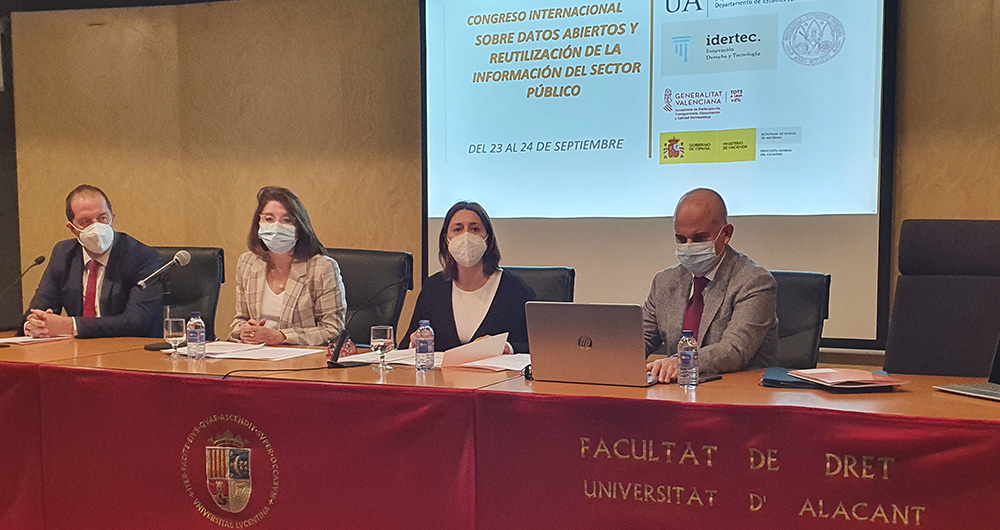
Conclusions of the Congress on open data and reuse of public sector information
Last September, an international congress was held at the University of Alicante, which addressed some of the main challenges posed by open data and the reuse of public sector information from a legal perspective.
The inaugural conference was given by Kiko Llaneras, who made, from his own journalist…
The use of open data in the tourism sector
When planning our vacations, we all look for the perfect destination that meets our expectations: beach, mountain, city... But once we have decided where to go, we still have to make many decisions: how am I going to organize my trip so that everything goes perfect? Luckily, we have hundreds of appl…
