5 posts found
A common language to enable interoperability between open dataset catalogs
Open data plays a relevant role in technological development for many reasons. For example, it is a fundamental component in informed decision making, in process evaluation or even in driving technological innovation. Provided they are of the highest quality, up-to-date and ethically sound, data can…
MAMD Methodology: The Alarcos Model of Data Improvement
There is such a close relationship between data management, data quality management and data governance that the terms are often used interchangeably or confused. However, there are important nuances.
The overall objective of data management is to ensure that data meets the business requirements tha…
Data visualization: the best charts for representing comparisons
Data is a valuable source of knowledge for society. Public commitment to achieving data openness, public-private collaboration on data, and the development of applications with open data are actions that are part of the data economy, which seeks the innovative, ethical, and practical use of data to…
How to choose the right chart to visualise open data
A statistical graph is a visual representation designed to contain a series of data whose objective is to highlight a specific part of the reality. However, organising a set of data in an informative way is not an easy task, especially, if we want to capture the viewer’s attention and to present the…
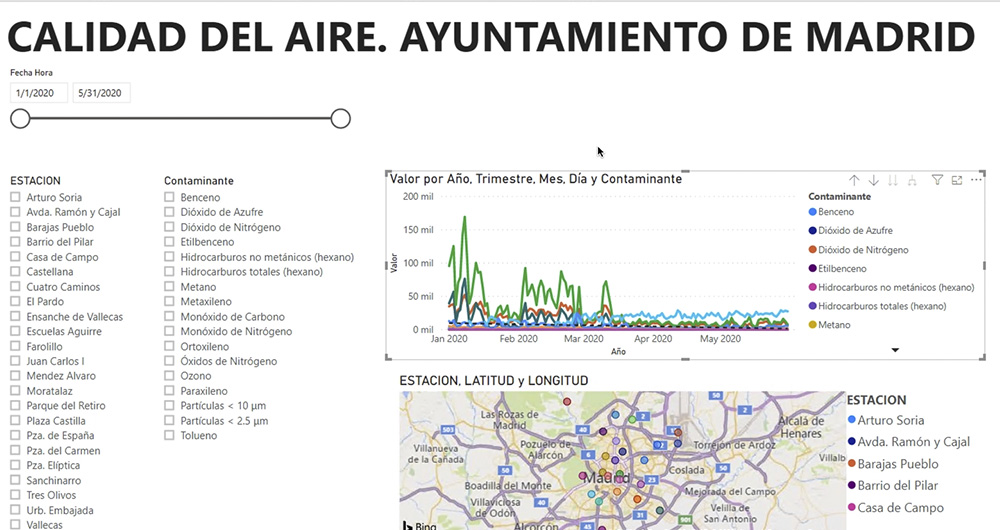
What is an interactive display? Here is an example
The visual representation of data helps our brain to digest large amounts of information quickly and easily. Interactive visualizations make it easier for non-experts to analyze complex situations represented as data.
As we introduced in our last post on this topic, graphical data visualization is a…


