5 posts found
Data visualization: the best charts for representing comparisons
Data is a valuable source of knowledge for society. Public commitment to achieving data openness, public-private collaboration on data, and the development of applications with open data are actions that are part of the data economy, which seeks the innovative, ethical, and practical use of data to…

From the legal perspective of open data to the importance of its re-use: 15 data.europa.eu webinars to broaden your knowledge
Over the past year, the academic section of data.europa.eu expanded its open data training offer by publishing new conferences, courses and workshops. Thus, data.europa.academy shared a total of 15 webinars related to open data, data spaces and other topics and technical issues around the data econo…
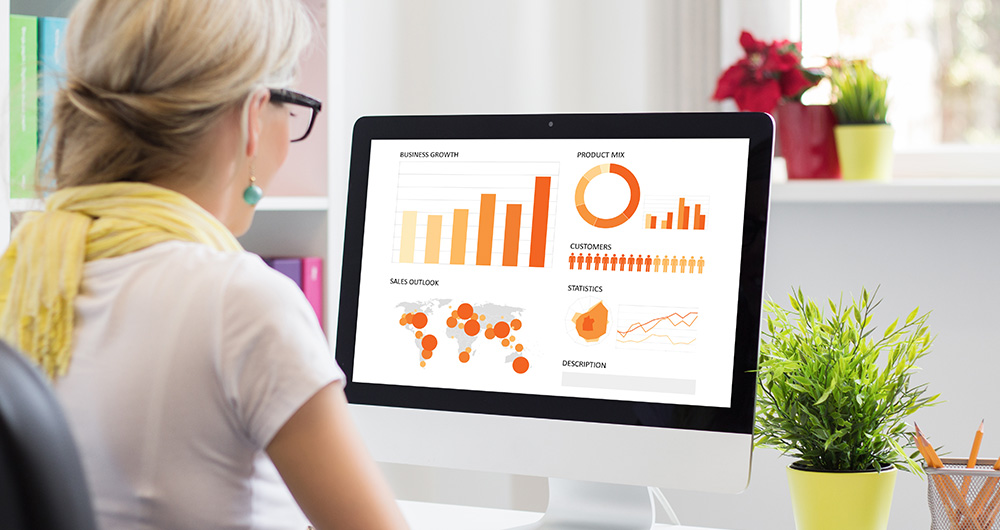
How to choose the right chart to visualise open data
A statistical graph is a visual representation designed to contain a series of data whose objective is to highlight a specific part of the reality. However, organising a set of data in an informative way is not an easy task, especially, if we want to capture the viewer’s attention and to present the…

The value of real-time data through a practical example
Life happens in real time and much of our life, today, takes place in the digital world. Data, our data, is the representation of how we live hybrid experiences between the physical and the virtual. If we want to know what is happening around us, we must analyze the data in real time. In this post,…
Low coding tools for data analysis
The democratisation of technology in all areas is an unstoppable trend. With the spread of smartphones and Internet access, an increasing number of people can access high-tech products and services without having to resort to advanced knowledge or specialists. The world of data is no stranger to thi…