


Documentation
Type
Audience
Document date
Tag
-
Analysis of meteorological data using the "ggplot2" library
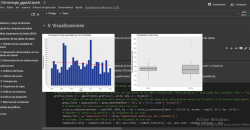
1. Introduction Visualizations are graphical representations of data that allow the information linked to them to be communicated in a simple and effective way. The visualization possibilities are very wide, from basic representations, such as a line...
-
Characteristics of the Spanish University students and most demanded degrees

1. Introduction 2. Objetives 3. Resources 3.1. Datasets 3.2. Tools 4. Data pre-processing 5. Visualizations 6. Conclusions 1. Introduction Visualizations are graphical representations of data that allow to transmit in a...
-
How many accidents occur in the city of Madrid?
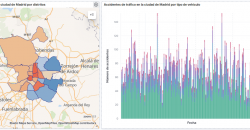
1. Introduction 2. Objetives 3. Resources 3.1. Datasets 3.2. Tools 4. Data processing 5. Visualizations 6. Conclusions 1. Introduction Data visualization is a task linked to data analysis that aims to...
-
Characterization of the employment demand and registered contracting in Spain

1. Introductiontion 2. Objetiveses 3. Resources 3.1. Datasets 3.2. Tools 4. Data processing 5. Visualizations 6. Conclusionss 1. Introduction Data visualization is a task linked to data analysis...
-
How to generate value from data: formats, techniques and tools to analyse open data

In the digital world, data becomes a fundamental asset for companies. Thanks to them, they can better understand their environment, business and competition, and make convenient decisions at the right time. In this context, it is not surprising that...


