Blog
Today, data quality plays a key role in today's world, where information is a valuable asset. Ensuring that data is accurate, complete and reliable has become essential to the success of organisations, and guarantees the success of informed decision making.
Data quality has a direct impact not only on the exchange and use within each organisation, but also on the sharing of data between different entities, being a key variable in the success of the new paradigm of data spaces. When data is of high quality, it creates an environment conducive to the exchange of accurate and consistent information, enabling organisations to collaborate more effectively, fostering innovation and the joint development of solutions.
Good data quality facilitates the reuse of information in different contexts, generating value beyond the system that creates it. High-quality data are more reliable and accessible, and can be used by multiple systems and applications, which increases their value and usefulness. By significantly reducing the need for constant corrections and adjustments, time and resources are saved, allowing for greater efficiency in the implementation of projects and the creation of new products and services.
Data quality also plays a key role in the advancement of artificial intelligence and machine learning. AI models rely on large volumes of data to produce accurate and reliable results. If the data used is contaminated or of poor quality, the results of AI algorithms will be unreliable or even erroneous. Ensuring data quality is therefore essential to maximise the performance of AI applications, reduce or eliminate biases and realise their full potential.
With the aim of offering a process based on international standards that can help organisations to use a quality model and to define appropriate quality characteristics and metrics, the Data Office has sponsored, promoted and participated in the generation of the specification UNE 0081 Data Quality Assessment that complements the already existing specification UNE 0079 Data Quality Management, focused more on the definition of data quality management processes than on data quality as such.
UNE Specification - Guide to Data Quality Assessment
The UNE 0081 specification, a family of international standards ISO/IEC 25000, makes it possible to know and evaluate the quality of the data of any organisation, making it possible to establish a future plan for its improvement, and even to formally certify its quality. The target audience for this specification, applicable to any type of organisation regardless of size or dedication, will be data quality officers, as well as consultants and auditors who need to carry out an assessment of data sets as part of their functions.
The specification first sets out the data quality model, detailing the quality characteristics that data can have, as well as some applicable metrics, and once this framework is defined, goes on to define the process to be followed to assess the quality of a dataset. Finally, the specification ends by detailing how to interpret the results obtained from the evaluation by showing some concrete examples of application.
Data quality model
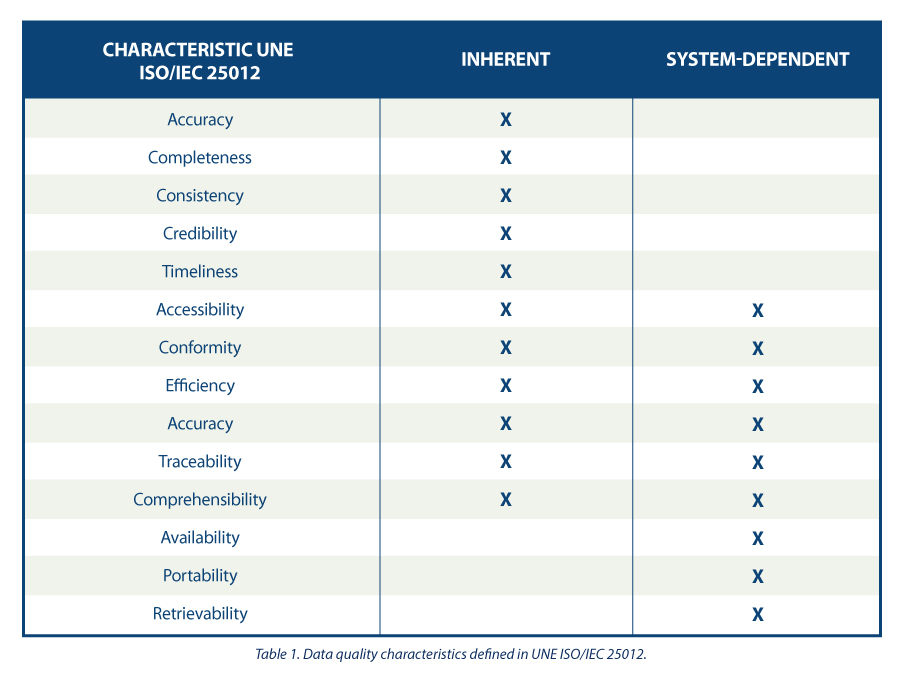
The guide proposes a series of quality characteristics following those present in the ISO/IEC 25012 standard , classifying them between those inherent to the data, those dependent on the system where the data is hosted, or those dependent on both circumstances. The choice of these characteristics is justified as they encompass those present in other frameworks such as DAMA, FAIR, EHDS, IA Act and GDPR.
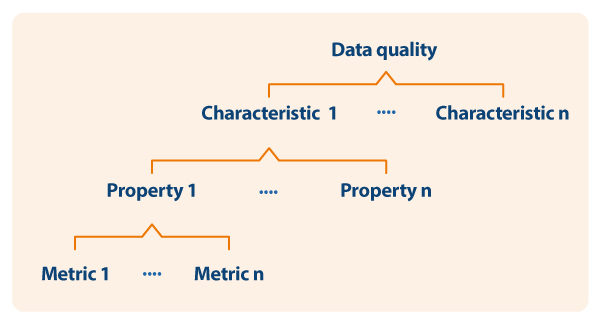
Based on the defined characteristics, the guide uses ISO/IEC 25024 to propose a set of metrics to measure the properties of the characteristics, understanding these properties as "sub-characteristics" of the characteristics.
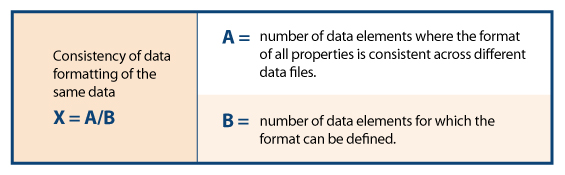
Thus, as an example, following the dependency scheme, for the specific characteristic of "consistency of data format" its properties and metrics are shown, one of them being detailed

Process for assessing the quality of a data set
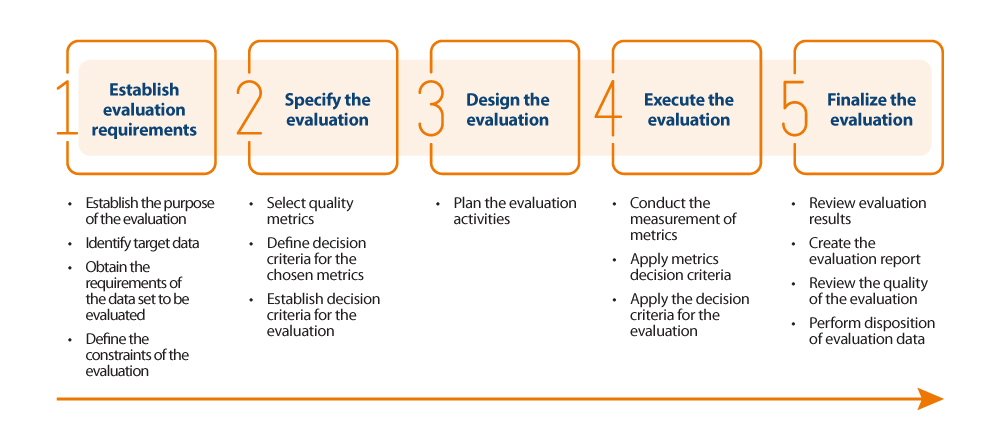
For the actual assessment of data quality, the guide proposes to follow the ISO/IEC 25040 standard, which establishes an assessment model that takes into account both the requirements and constraints defined by the organisation, as well as the necessary resources, both material and human. With these requirements, an evaluation plan is established through specific metrics and decision criteria based on business requirements, which allows the correct measurement of properties and characteristics and interpretation of the results.
Below is an outline of the steps in the process and its main activities:
Results of the quality assesment
The outcome of the assessment will depend directly on the requirements set by the organisation and the criteria for compliance. The properties of the characteristics are usually evaluated from 0 to 100 based on the values obtained in the metrics defined for each of them, and the characteristics in turn are evaluated by aggregating the previous ones also from 0 to 100 or by converting them to a discrete value from 1 to 5 (1 poor quality, 5 excellent quality) depending on the calculation and weighting rules that have been established. In the same way that the measurement of the properties is used to obtain the measurement of their characteristics, the same happens with these characteristics, which by means of their weighted sum based on the rules that have been defined (being able to establish more weight to some characteristics than to others), a final result of the quality of the data can be obtained. For example, if we want to calculate the quality of data based on a weighted sum of their intrinsic characteristics, where, because of the type of business, we are interested in giving more weight to accuracy, then we could define a formula such as the following:
Data quality = 0.4*Accuracy + 0.15*Completeness + 0.15*Consistency + 0.15*Credibility + 0.15*Currentness
Assume that each of the quality characteristics has been similarly calculated on the basis of the weighted sum of their properties, resulting in the following values: Accuracy=50%, Completeness=45%, Consistency=35%, Credibility=100% and Currency=50%. This would result in data quality:
Data quality = 0.4*50% + 0.15*45% + 0.15*35% + 0.15*100% + 0.15*50% = 54.5%
Assuming that the organisation has established requirements as shown in the following table:

It could be concluded that the organisation as a whole has a data score of "3= Good Quality".
In summary, the assessment and improvement of the quality of the dataset may be as thorough and rigorous as necessary, and should be carried out in an iterative and constant manner so that the data is continuously increasing in quality, so that a minimum data quality is ensured or can even be certified. This minimum data quality can refer to improving data sets internal to an organisation, i.e. those that the organisation manages and exploits for the operation of its business processes; or it can be used to support the sharing of data sets through the new paradigm of data spaces generating new market opportunities. In the latter case, when an organisation wants to integrate its data into a data space for future brokering, it is desirable to carry out a quality assessment, labelling the dataset appropriately with reference to its quality (perhaps by metadata). Data of proven quality has a different utility and value than data that lacks it, positioning the former in a preferential position in the competitive market.
The content of this guide, as well as the rest of the UNE specifications mentioned, can be viewed freely and free of charge from the AENOR portal through the link below by accessing the purchase section and marking “read” in the dropdown where “pdf” is pre-selected. Access to this family of UNE data specifications is sponsored by the Secretary of State for Digitalization and Artificial Intelligence, Directorate General for Data. Although viewing requires prior registration, a 100% discount on the total price is applied at the time of finalizing the purchase. After finalizing the purchase, the selected standard or standards can be accessed from the customer area in the my products section.
https://tienda.aenor.com/norma-une-especificacion-une-0080-2023-n0071383
https://tienda.aenor.com/norma-une-especificacion-une-0079-2023-n0071118
https://tienda.aenor.com/norma-une-especificacion-une-0078-2023-n0071117
https://tienda.aenor.com/norma-une-especificacion-une-0077-2023-n0071116
Blog
Open data plays a relevant role in technological development for many reasons. For example, it is a fundamental component in informed decision making, in process evaluation or even in driving technological innovation. Provided they are of the highest quality, up-to-date and ethically sound, data can be the key ingredient for the success of a project.
In order to fully exploit the benefits of open data in society, the European Union has several initiatives to promote the data economy, a single digital model that encourages data sharing, emphasizing data sovereignty and data governance, the ideal and necessary framework for open data.
In the data economy, as stated in current regulations, the privacy of individuals and the interoperability of data are guaranteed. The regulatory framework is responsible for ensuring compliance with this premise. An example of this can be the modification of Law 37/2007 for the reuse of public sector information in compliance with European Directive 2019/1024. This regulation is aligned with the European Union's Data Strategy, which defines a horizon with a single data market in which a mutual, free and secure exchange between the public and private sectors is facilitated.
To achieve this goal, key issues must be addressed, such as preserving certain legal safeguards or agreeing on common metadata description characteristics that datasets must meet to facilitate cross-industry data access and use, i.e. using a common language to enable interoperability between dataset catalogs.
What are metadata standards?
A first step towards data interoperability and reuse is to develop mechanisms that enable a homogeneous description of the data and that, in addition, this description is easily interpretable and processable by both humans and machines. In this sense, different vocabularies have been created that, over time, have been agreed upon until they have become standards.
Standardized vocabularies offer semantics that serve as a basis for the publication of data sets and act as a "legend" to facilitate understanding of the data content. In the end, it can be said that these vocabularies provide a collection of metadata to describe the data being published; and since all users of that data have access to the metadata and understand its meaning, it is easier to interoperate and reuse the data.
W3C: DCAT and DCAT-AP Standards
At the international level, several organizations that create and maintain standards can be highlighted:
- World Wide Web Consortium (W3C): developed the Data Catalog Vocabulary (DCAT): a description standard designed with the aim of facilitating interoperability between catalogs of datasets published on the web.
- Subsequently, taking DCAT as a basis, DCAT-AP was developed, a specification for the exchange of data descriptions published in data portals in Europe that has more specific DCAT-AP extensions such as:
- GeoDCAT-AP which extends DCAT-AP for the publication of spatial data.
- StatDCAT-AP which also extends DCAT-AP to describe statistical content datasets.
- Subsequently, taking DCAT as a basis, DCAT-AP was developed, a specification for the exchange of data descriptions published in data portals in Europe that has more specific DCAT-AP extensions such as:
ISO: Organización de Estandarización Internacional
Además de World Wide Web Consortium, existen otras organizaciones que se dedican a la estandarización, por ejemplo, la Organización de Estandarización Internacional (ISO, por sus siglas en inglés Internacional Standarization Organisation).
- Entre otros muchos tipos de estándares, ISO también ha definido normas de estandarización de metadatos de catálogos de datos:
- ISO 19115 para describir información geográfica. Como ocurre en DCAT, también se han desarrollado extensiones y especificaciones técnicas a partir de ISO 19115, por ejemplo:
- ISO 19115-2 para datos ráster e imágenes.
- ISO 19139 proporciona una implementación en XML del vocabulario.
- ISO 19115 para describir información geográfica. Como ocurre en DCAT, también se han desarrollado extensiones y especificaciones técnicas a partir de ISO 19115, por ejemplo:
The horizon in metadata standards: challenges and opportunities
Both W3C and ISO are working on the development and maintenance of standardized vocabularies adapted to the needs of users. Their work contributes to achieving an interoperable open data ecosystem that facilitates reuse. However, interoperability often encounters obstacles arising from quality weaknesses, such as outdated data, difficulties in accessing and interoperating with it, or incomplete metadata.
However, as has been demonstrated, data sharing is a fundamental mechanism in the data economy. So ensuring the interoperability and reuse of data is a key action to address the development of the data economy in line with the expectations of organizations in terms of innovation.
Among the multiple advantages offered by the reuse of datasets and their interoperability, we can highlight the creation of applications and services that bring value to society or help in the evaluation of policies, for example.
In addition, the reuse and interoperability of datasets favors economic development in general, and the data economy in particular. It is estimated that this industry will reach a value of 829 billion euros by 2025, according to European Union forecasts. In order to reap the benefits of data sharing, common description standards must first be agreed upon and adhered to: the standards for describing dataset catalog metadata.
Blog
As technology and connectivity have advanced in recent years, we have entered a new era in which data never sleeps and the amount of data circulating is greater than ever. Today, we could say that we live enclosed in a sphere surrounded by data and this has made us more and more dependent on it. On the other hand, we have also gradually become both producers and collectors of data.
The term datasphere has historically been used to define the set of all the information existing in digital spaces, also including other related concepts such as data flows and the platforms involved. But this concept has been developing and gaining more and more relevance in parallel with the growing weight of data in our society today, becoming an important concept in defining the future of the relationship between technology and society.
In the early days of the digital era we could consider that we lived in our own data bubbles that we fed little by little throughout our lives until we ended up totally immersed in the data of the online world, where the distinction between the real and the virtual is increasingly irrelevant. Today we live in a society that is interconnected through data and also through algorithms that link us and establish relationships between us. All that data we share more or less consciously no longer affects only ourselves as individuals, but can also have its effect on the rest of society, even in sometimes totally unpredictable ways - like a digital version of the butterfly effect.
Governance models that are based on working with data and its relationship to people, as if it were simply isolated instances that we can work with individually, will therefore no longer serve us well in this new environment.
The need for a systems-based approach to data
Today, that relatively simple concept of the data sphere has evolved into a complete, highly interconnected and complex digital ecosystem - made up of a wide range of data and technologies - that we inhabit and that affects the way we live our lives. It is a system in which data has value only in the context of its relationship with other data, with people and with the rules that govern those relationships.
Effective management of this new ecosystem will therefore require a better understanding of how the different components of the datasphere relate to each other, how data flows through these components, and what the appropriate rules will be needed to make this interconnected system work.
Data as an active component of the system
In a systems-based approach, data is considered as an active component within the ecosystem. This means that data is no longer just static information, but also has the capacity to influence the functioning of the ecosystem itself and will therefore be an additional component to be considered for the effective management of the ecosystem.
For example, data can be used to fine-tune the functioning of algorithms, improving the accuracy and efficiency of artificial intelligence and machine learning systems. Similarly, it could also be used to adjust the way decisions are made and policies implemented in different sectors, such as healthcare, education and security.
The data sphere and the evolution of data governance
It will therefore be necessary to explore new collective data governance frameworks that consider all elements of the ecosystem in their design, controlling how information is accessed, used and protected across the data sphere.
This could ensure that data is used securely, ethically and responsibly for the whole ecosystem and not just in individual or isolated cases. For example, some of the new data governance tools that have been experimented with for some time now and can help us to manage the data sphere collectively are data commons or digital data assets, data trusts, data cooperatives, data collaboratives or data collaborations, among others.
The future of the data sphere
The data sphere will continue to grow and evolve in the coming years, driven once again by new technological advances and the increasing connectivity and ubiquity of systems. It will be important for governments and organisations to keep abreast of these changes and adapt their data governance and management strategies accordingly through robust regulatory frameworks, accompanied by ethical guidelines and responsible practices that ensure that the benefits that data exploitation promises us can finally be realised while minimising risks.
In order to adequately address these challenges, and thus harness the full potential of the data sphere for positive change and for the common good, it will be essential to move away from thinking of data as something we can treat in isolation and to adopt a systems-based approach that recognises the interconnected nature of data and its impact on society as a whole.
Today, we could consider data spaces, which the European Commission has been developing for some time now as a key part of its new data strategy, as precisely a logical evolution of the data sphere concept adapted to the particular needs of our time and acting on all components of the ecosystem simultaneously: technical, functional, operational, legal and business.
Content prepared by Carlos Iglesias, Open data Researcher and consultant, World Wide Web Foundation.
The contents and views reflected in this publication are the sole responsibility of the author.
Blog
In the process of analysing data and training machine learning models, it is essential to have an adequate dataset. Therefore, the questions arise: how should you prepare your datasets for machine learning and analytics, and how can you be confident that the data will lead to robust conclusions and accurate predictions?
The first thing to consider when preparing your data is to know the type of problem you are trying to solve. For example, if your intention is to create a machine learning model capable of recognising someone's emotional state from their facial expressions, you will need a dataset with images or videos of people's faces. Or, perhaps, the goal is to create a model that identifies unwanted emails. For this, you will need data in text format from emails.
Furthermore, the data required also depends on the type of algorithm you want to use. Supervised learning algorithms, such as linear regression or decision trees, require a field containing the true value of an outcome for the model to learn from. In addition to this true value, called the target, they require fields containing information about the observations, known as features. In contrast, unsupervised learning algorithms, such as k-means clustering or recommendation systems based on collaborative filtering, usually only need features.
However, finding the data is only half the job. Real-world datasets can contain all sorts of errors that can render all the work useless if they are not detected and corrected before starting. In this post, we'll introduce some of the main pitfalls that can be found in datasets for machine learning and analytics, as well as some ways in which the collaborative data science platform, Datalore, can help spot them quickly and remedy them.
Is the data representative of what you want to measure?
Most datasets for machine learning projects or analytics are not designed specifically for that purpose. In the absence of a metadata dictionary or an explanation of what the fields in the dataset mean, the user may have to figure out the unknown based on the information available to them.
One way to determine what features in a dataset measure is to check their relationships to other features. If two fields are assumed to measure similar things, one would expect them to be closely related. Conversely, if two domains measure very different things, you would expect them to be unrelated. These ideas are known as convergent and discriminant validity, respectively.
Another important thing to check is whether any of the traits are too closely related to the target audience. If this happens, it may indicate that this feature is accessing the same information as the target to be predicted. This phenomenon is known as feature leakage. If such data is used, there is a risk of artificially inflating the performance of the model.
In this sense, Datalore allows you to quickly scan the relationship between continuous variables by means of the correlation graph in the Visualise tab for a DataFrame. Another way to test these relationships is by using bar charts or cross tabulations, or effect size measures such as the coefficient of determination or Cramer's V.
Is the dataset properly filtered and cleaned?
Datasets can contain all kinds of inconsistencies that can negatively affect our models or analyses. Some of the most important indicators of dirty data are:
- Implausible values: This includes values that are out of range, such as negatives in a count variable or frequencies that are much higher or lower than expected for a particular field.
- Outliers: These are extreme values, which can represent anything from coding errors that occurred at the time the data were written, to rare but real values that lie outside the bulk of the other observations.
- Missing values: The pattern and amount of missing data determines the impact it will have, the most serious being those related to the target or features.
Dirty data can undermine the quality of your analyses and models, largely because it distorts conclusions or leads to poor model performance. Datalore's Statistics tab makes it easy to check for these problems by showing at a glance the distribution, the number of missing values and the presence of outliers for each field. Datalore also facilitates the exploration of the raw data and allows to perform basic filtering, sorting and column selection operations directly in a DataFrame, exporting the Python code corresponding to each action to a new cell.
Are the variables balanced?
Unbalanced data occur when categorical fields have an uneven distribution of observations across all classes. This situation can cause significant problems for models and analyses. When you have a very unbalanced target, you can create lazy models that can still achieve good performance by simply predicting the majority class by default. Let's take an extreme example: we have a dataset where 90% of the observations fall into one of the target classes and 10% fall into the other. If we always predicted the majority class for this dataset, we would still get an accuracy of 90%, which shows that, in these cases, a model that learns nothing from the features can perform excellently.
Features are also affected by class imbalance. Models work by learning patterns, and when classes are too small, it is difficult for models to make predictions for these groups. These effects can be exacerbated when you have several unbalanced features, leading to situations where a particular combination of rare classes can only occur in a handful of observations.
Unbalanced data can be rectified by various sampling techniques. Undersampling involves reducing the number of observations in the larger classes to equalise the distribution of the data, and oversampling involves creating more data in the smaller classes. There are many ways to do this. Examples include using Python packages such as imbalanced-learn or services such as Gretel. Unbalanced features can also be corrected by feature engineering, which aims to combine classes within a field without losing information.
In short, is the dataset representative?
When creating a dataset, you have in mind a target group for which you want your model or analysis to work. For example, a model to predict the likelihood that American men interested in fashion will buy a certain brand. This target group is the population you want to be able to make generalisations about. However, as it is often impractical to collect information on all individuals who constitute this part of the population, a subset called a sample is used instead.
Sometimes problems arise that cause the sample data for the machine learning model and analysis to misrepresent the behaviour of the population. This is called data bias. For example, the sample may not capture all subgroups of the population, a type of bias called selection bias.
One way to check for bias is to inspect the distribution of the fields in your data and check that they make sense based on what you know about that population group. Using Datalore's Statistics tab allows you to scan the distribution of continuous and categorical variables in a DataFrame.
Is the actual performance of the models being measured?
A final issue that can put you in a bind is measuring the performance of your models. Many models are prone to a problem called overfitting which is when the model fits the training data so well that it does not generalise well to new data. The telltale sign of overfitting is a model that performs extremely well on training data and underperforms on new data. The way to account for this is to split the dataset into several sets: a training set to train the model, a validation set to compare the performance of different models, and a final test set to check how the model will perform in the real world.
However, creating a clean training-validation-testing split can be tricky. A major problem is data leakage, whereby information from the other two datasets leaks into the training set. This can lead to problems ranging from the obvious, such as duplicate observations ending up in all three datasets, to more subtle ones, such as using information from the entire dataset to perform feature pre-processing before splitting the data. In addition, it is important that the three datasets have the same distribution of targets and features, so that each is a representative sample of the population.
To avoid any problems, you should split the dataset into training, validation and test sets at the beginning of your work, prior to any exploration or processing. To ensure that each dataset has the same distribution of each field, you can use a method such as scikit-learn's train_test_split, which is specifically designed to create representative splits of the data. Finally, it is advisable to compare the descriptive statistics of each dataset to check for signs of data leakage or uneven splits, which is easily done using the Statistics tab in Datalore.
Ultimately, there are a number of issues that can occur when preparing data for machine learning and analytics and it is important to know how to mitigate them. While this can be a time-consuming part of the work process, there are tools that can make it quicker and easier to spot problems at an early stage.
Content drawn from Jodie Burchell's post How to prepare your dataset for machine learning and analysis published in The JetBrains Datalore Blog
Blog
Motivation
According to the European Data Proposal Law, data is a fundamental component of the digital economy and an essential resource for ensuring ecological and digital transitions. In recent years, the volume of data generated by humans and machines has experienced an exponential increase. It is essential to unlock the potential of this data by creating opportunities for its reuse, removing obstacles to the development of the data economy, and respecting European norms and values. In line with the mission of reducing the digital divide, measures must be promoted that allow everyone to benefit from these opportunities fairly and equitably.
However, a downside of the high availability of data is that as more data accumulates, chaos ensues when it is not managed properly. The increase in volume, velocity, and variety of data also implies a greater difficulty in ensuring its quality. And in situations where data quality levels are inadequate, as analytical techniques used to process datasets become more sophisticated, individuals and communities can be affected in new and unexpected ways.
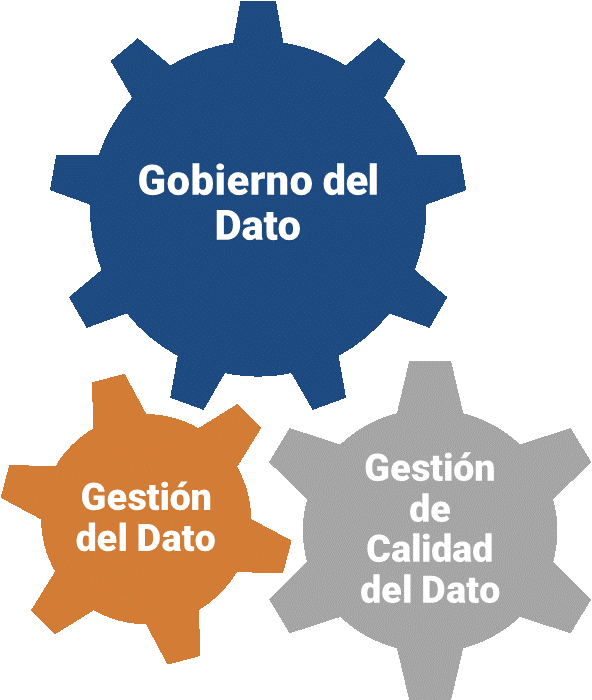
In this changing scenario, it is necessary to establish common processes applicable to data assets throughout an organization's lifecycle, maximizing their value through data governance initiatives that ensure a structured, managed, coherent, and standardized approach to all activities, operations, and services related to data. Ultimately, it must be ensured that the definition, creation, storage, maintenance, access, and use of data (data management) are done following a data strategy aligned with organizational strategies (data governance), and that the data used is suitable for the intended use (data quality).
UNE Specifications for Data Governance, Management, and Quality
The Data Office, a unit responsible for promoting the sharing, management, and use of data across all productive sectors of the Spanish economy and society, in response to the need for a reference framework that supports both public and private organizations in their efforts to ensure adequate data governance, management, and quality, has sponsored, promoted, and participated in the development of national UNE specifications in this regard.
The UNE 0077:2023 Data Governance, UNE 0078:2023 Data Management, and UNE 0079:2023 Data Quality Management specifications are designed to be applied jointly, enabling the creation of a solid and harmonized reference framework that promotes the adoption of sustainable and effective data practices.
Coordination is driven by data governance, which establishes the necessary mechanisms to ensure the proper use and exploitation of data through the implementation and execution of data management processes and data quality management processes, all in accordance with the needs of the relevant business process and taking into account the limitations and possibilities of the organizations that use the data.
Each regulatory specification is presented with a process-oriented approach, and each of the presented processes is described in terms of its contribution to the seven components of a data governance and management system, as introduced in COBIT 2019:
- Process, detailing its purpose, outcome, tasks, and products according to ISO 8000-61.
- Principles, policies, and frameworks.
- Organizational structures, identifying the data governance bodies and decision-making structures.
- Information, required and generated in each process.
- Culture, ethics, and behavior, as a set of individual and collective behaviors of people and the organization.
- People, skills, and competencies needed to complete all activities and make decisions and corrective actions.
- Services, infrastructure, and applications that include technology-related aspects to support data management, data quality management, and data governance processes.
UNE 0077:2023 Specification_Data Governance
The UNE 0077:2023 specification covers aspects related to data governance. It describes the creation of a data governance framework to evaluate, direct, and monitor the use of an organization's data, so that it contributes to its overall performance by obtaining the maximum value from the data while mitigating risks associated with its use. Therefore, data governance has a strategic character, while data management has a more operational focus aimed at achieving the goals set in the strategy.
The implementation of proper data governance involves the correct execution of the following processes:
- Establishment of data strategy
- Establishment of data policies, best practices, and procedures
- Establishment of organizational structures
- Optimization of data risks
- Optimization of data value
UNE 0078:2023 Specification_Data Management
The UNE 0078:2023 specification covers the aspects related to data management. Data management is defined as the set of activities aimed at ensuring the successful delivery of relevant data with adequate levels of quality to the agents involved throughout the data life cycle, supporting the business processes established in the organizational strategy, following the guidelines of data governance, and in accordance with the principles of data quality management.
The implementation of adequate data management involves the development of thirteen processes:
- Data processing
- Management of the technological infrastructure
- Management of data requirements
- Management of data configuration
- Historical data management
- Data security management
- Metadata management
- Management of data architecture and design
- Data sharing, intermediation and integration
- Master data management
- Human resource management
- Data lifecycle management
- Data analysis
UNE 0079:2023 Specification_Data Quality Management
The UNE 0079:2023 specification covers the data quality management processes necessary to establish a framework for improving data quality. Data quality management is defined as the set of activities aimed at ensuring that data has adequate quality levels for use that allows an organization's strategy to be satisfied. Having quality data will allow an organization to achieve the maximum potential of data through its business processes.
According to Deming's continuous improvement PDCA cycle, data quality management involves four processes:
- Data quality planning,
- Data quality control and monitoring,
- Data quality assurance, and
- Data quality improvement.
The data quality management processes are intended to ensure that data meets the data quality requirements expressed in accordance with the ISO/IEC 25012 standard.
Maturity Model
As a joint application framework for the different specifications, a data maturity model is outlined that integrates the processes of governance, management, and data quality management, showing how the progressive implementation of processes and their capabilities can be carried out, defining a path of improvement and excellence across different levels to become a mature data organization.
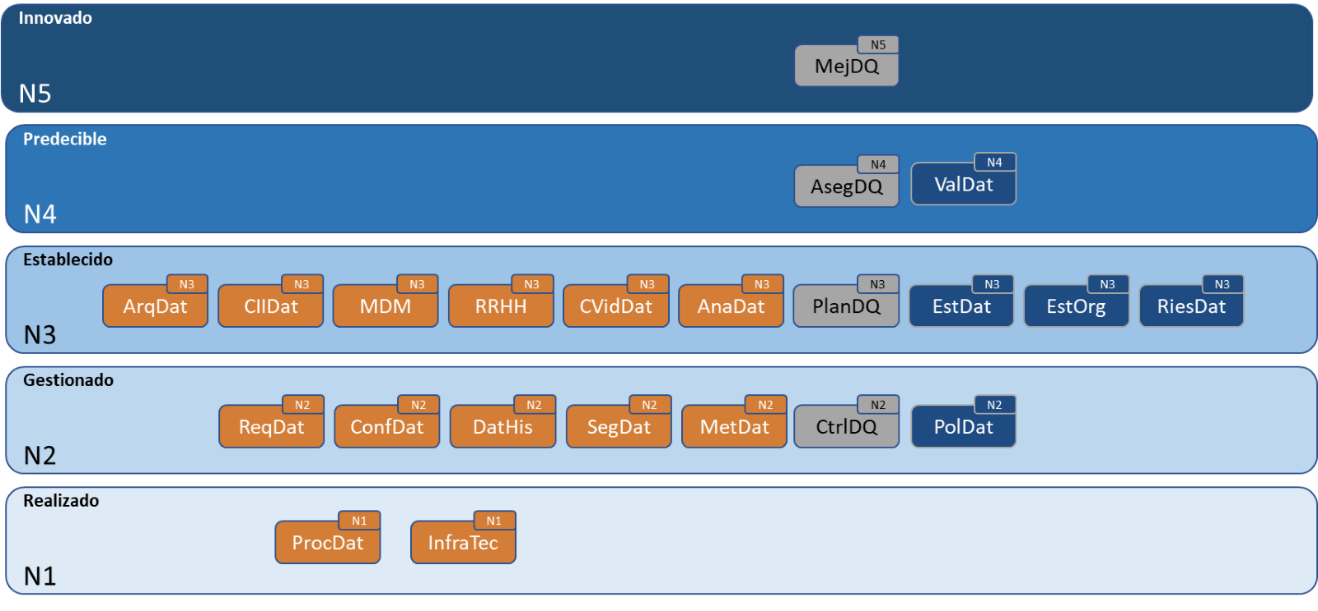
The Data Office will promote the development of the UNE 0080 specification to provide a data maturity assessment model that complies with the content of the governance, management, and data quality management specifications and the aforementioned framework.
The content of this guide, as well as the rest of the UNE specifications mentioned, can be viewed freely and free of charge from the AENOR portal through the link below by accessing the purchase section and marking “read” in the dropdown where “pdf” is pre-selected. Access to this family of UNE data specifications is sponsored by the Secretary of State for Digitalization and Artificial Intelligence, Directorate General for Data. Although viewing requires prior registration, a 100% discount on the total price is applied at the time of finalizing the purchase. After finalizing the purchase, the selected standard or standards can be accessed from the customer area in the my products section.
The content of this guide can be downloaded freely and free of charge from the AENOR portal through the link below by accessing the purchase section. Access to this family of UNE data specifications is sponsored by the Secretary of State for Digitalization and Artificial Intelligence, Directorate General for Data. Although the download requires prior registration, a 100% discount on the total price is applied at the time of finalizing the purchase. After finalizing the purchase, the selected standard or standards can be accessed from the customer area in the my products section.
- UNE 0077:2023 SPECIFICATION: https://tienda.aenor.com/norma-une-especificacion-une-0077-2023-n0071116
- UNE 0078:2023 SPECIFICATION: https://tienda.aenor.com/norma-une-especificacion-une-0078-2023-n0071117
- UNE 0079:2023 SPECIFICATION: https://tienda.aenor.com/norma-une-especificacion-une-0079-2023-n0071118
- UNE 0080:2023 SPECIFICATION: https://tienda.aenor.com/norma-une-especificacion-une-0080-2023-n0071383
Entrevista
The AMETIC association represents companies of all sizes linked to the Spanish digital technology industry, a key sector for the national GDP. Among other issues, AMETIC seeks to promote a favorable environment for the growth of companies in the sector, promoting digital talent and the creation and consolidation of new companies.
At datos.gob.es we spoke with Antonio Cimorra, Director of Digital Transformation and Enabling Technologies at AMETIC, to reflect on the role of open data in innovation and as the basis for new products, services and even business models.
Full interview:
1. How does open data help drive digital transformation? What disruptive technologies are the most benefited by the opening of data?
Open data is one of the pillars of the data economy , which is called to be the basis of our present and future development and the digital transformation of our society. All industries, public administrations and citizens themselves have only just begun to discover and use the enormous potential and usefulness that the use of data brings to improving the competitiveness of companies, to the efficiency and improvement of services. of Public Administrations and to social relations and people's quality of life.
2. One of the areas in which they work from AMETIC is Artificial Intelligence and Big Data, among whose objectives is to promote the creation of public platforms for sharing open data. Could you explain to us what actions you are carrying out or have carried out for this?
At AMETIC we have an Artificial Intelligence and Big Data Commission in which the main companies that provide this technology participate . From this area, we work on the definition of initiatives and proposals that contribute to disseminating their knowledge among potential users, with the consequent advantages that their incorporation in the public and private sectors entails. Outstanding examples of actions in this area are the recent presentation of the AMETIC Artificial Intelligence Observatory, as well as the AMETIC Artificial Intelligence Summit. which in 2022 will celebrate its fifth edition that will focus on showing how Artificial Intelligence can contribute to meeting the Sustainable Development Goals and the Transformation Plans to be executed with European Funds
3. Open data can serve as a basis for developing services and solutions that give rise to new companies . Could you tell us an example of a use case carried out by your partners?
Open data, and very particularly the reuse of public sector information, are the basis for the development of countless applications and entrepreneurial initiatives both in consolidated companies in our technology sector and in many other cases of small companies or startups found in this source of information the motor of development of new businesses and approach to the market.
4. What types of data are most in demand by the companies you represent?
At present, all industrial and social activity data are in great demand by companies , due to their great value in the development of projects and solutions that have been demonstrating their interest and extension in all areas and types of organizations and users. usually.
5. It is also essential to have data sharing initiatives such as GAIA-X , built on the values of digital sovereignty and data availability. How have companies received the creation of a national hub ?
The technology sector has received the creation of the GAIA-X national hub very positively, understanding that our contribution from Spain to this European project will be of enormous value to our companies from very different fields of activity. Data sharing spaces in sectors such as tourism, health, mobility, industry, to give a few examples, have Spanish companies and experiences that are an example and a reference at European and global level .
6. Right now there is a great demand for professionals related to data collection, analysis and visualization. However, the supply of professionals, although it is growing, continues to be limited . What should be done to boost training in skills related to data and digitization?
The supply of technology professionals is one of the biggest problems for the development of our local industry and for the digital transformation of society. It is a difficulty that we can describe as historical, and that far from going less, every day there is a greater number of positions and profiles to cover. It is a worldwide problem that shows that there is no single or simple formula to solve it, but we can mention the importance of all social and professional agents developing joint and collaborative actions that allow the digital training of our population from an early age. and cycles and specialized training and degree programs that are characterized by their proximity to what will be the professional careers for which it is necessary to have the participation of the business sector
7. During the last years, you have been part of the jury of the different editions of the Aporta Challenge. How do you think these types of actions contribute to boosting data-driven businesses?
The Aporta Challenge has been an example of support and encouragement for the definition of many projects around open data and for the development of its own industry that in recent years has been growing very significantly with the availability of data of very different groups, in many cases by the Public Administrations, and their subsequent reuse and incorporation into applications and solutions of interest to very different users.
Open data constitutes one of the pillars of the data economy, which is called to be the basis of our present and future development and of the digital transformation of our society.
8. What are the next actions that are going to be carried out in AMETIC linked to the data economy?
Among the most outstanding actions of AMETIC in relation to the data economy, it is worth mentioning our recent incorporation into the national hub of GAIA-X for which we have been elected members of its board of directors, and where we will represent and incorporate the vision and contributions of the digital technology industry in all the data spaces that are constituted , serving as a channel for the participation of the technology companies that carry out their activity in our country and that have to form the basis of the projects and use cases that integrate into the European network GAIA-X in collaboration with other national hubs.
Blog
The European Commission estimates that the data economy -the one whose business model is based on the exploitation of data to generate products and services-will reach a value of 550,000 million euros in the EU27 in 2025. This figure means that it will go from occupying 2.8% of GDP to 4%. Only in our country, it is aimed what will generate more than 50,000 million euros and 750,000 jobs.
In the same report, the Commission also indicates that, to achieve a high growth scenario, it is necessary to reduce the concentration of data in the hands of a few and to bet on data sharing policies that promote innovation and the advancement of the society. For this reason, among other actions, the Commission launched the Support Center for Data Sharing (SCDS), focused on researching and reporting on data sharing practices and those elements that influence their success.
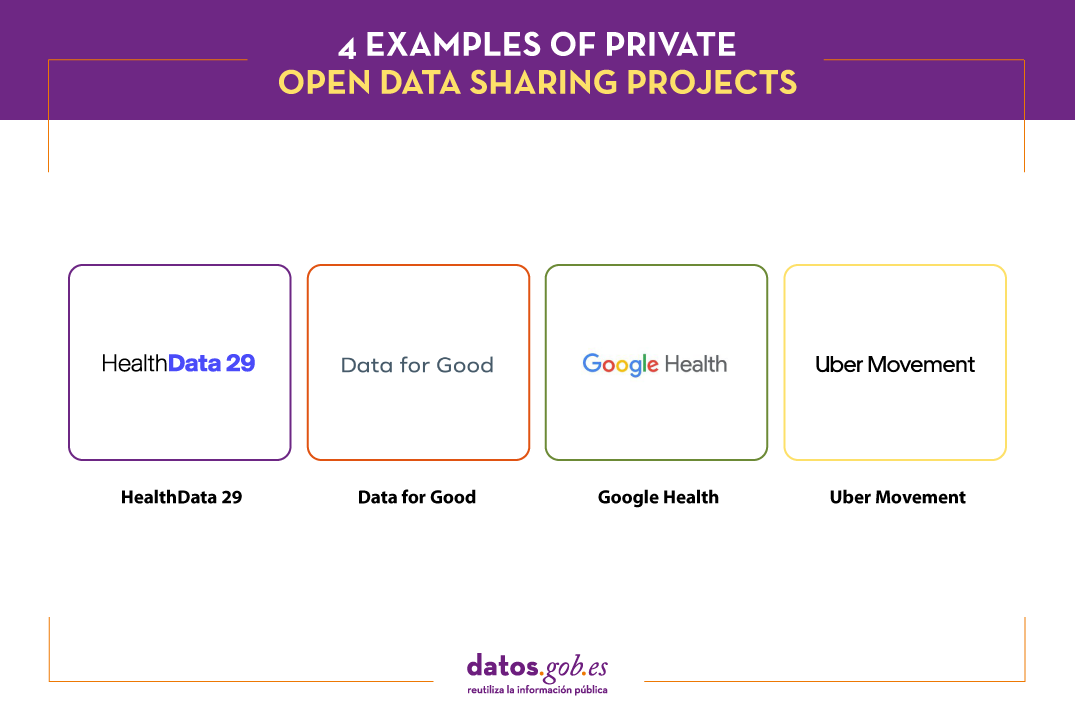
Data sharing drives collaboration among researchers, developers, and creators of products and services, which can lead to important new discoveries, as well as impact the positive reputation of data-sharing companies. Companies are beginning to be aware of this situation, which is leading us to see more and more examples of private exchange initiatives and data sharing. This affects organizations of all kinds, including large companies that run, manage or have access to large volumes of data. Let's look at some examples of sharing:
HealthData 29
The 29 Foundation, together with Microsoft, has launched Health29, a platform for sharing open data sets for research purposes. Garrigues and the Chair of Privacy and Digital Transformation of the University of Valencia have also participated in the project.
Organizations that wish to can register as publishers and start sharing anonymized data, ensuring privacy and security. There are currently 3 publishing organizations. All of them share data related to COVID-19:
- HM Hospitals shares clinical data related to the treatment of COVID-19, including diagnoses, treatments, admissions, ICU visits, diagnostic imaging tests, laboratory results, discharge or death, among others.
- The league provides data related to PCR and antigen tests performed on the players and staff of LaLiga Santander and LaLiga SmartBank clubs.
- Sanitas, as part of your project Data4good, provides researchers with demographic datas and clinical information (medications, vital signs, laboratory information and diagnosis) of patients with COVID-19 who have been admitted to their medical centers.
These data can be used to better understand the behavior of this disease and its treatment, but also to carry out predictive models of the evolution of the disease or epidemiological models. Researchers who want to access this data need to fill out an application, which must be approved by the publisher.
In the context of the project, a guide with the technical and legal framework to create a public repository of data from health systems.
It should be noted that Microsoft includes this action in its initiative to promote data sharing, Open Data Campaign, as Belén Gancedo, Director of Education at Microsoft Ibérica explained to us, in this interview.
Data for Good
Data for Good it is the name of the data sharing initiative of Meta, Mark Zuckerberg's company, formerly called Facebook, just like the social network -which does maintain the name-. Facebook has three billion users. Data for Good intends to use anonymized information about this community to "help organizations provide better services."
The web offers various data and tools, including maps. It also has a section for impact with examples of data usage. While some products require the signing of a data exchange agreement, others are public and open source, such as:
- High Resolution Settlement Layer: It is a population density map that uses census data, satellite images, and machine learning algorithms to detect structures. It has been used, for example, to analyze access to health centers in Spain.
- Movement Range Maps: consists of a map with daily updated mobility data (here is an article about the methodology). They have been used by governments and agencies around the world to measure the effects of mobility restrictions during the COVID-19 pandemic or the level of economic activity.
- Social Connectedness Index: map that measures the levels of friendship on Facebook between countries and regions in the world. This index helps predict economic, migration or health patterns, among others. It has been used by New York University, for example, to predict trade exchanges between geographic units in Europe.
- Commuting Zones: maps the areas where citizens live and work, based on transfers, and using machine learning algorithms. This information is only accessible, at the moment, for academic institutions, think-tanks or NGOs.
In addition, they also offer survey results on the economic impact on SMEs around the world, the climate change, the equality at home waves trends and impact of COVID-19 .
These tools are also available through the Humanitarian Data Exchange Portal of the United Nations Organization.
Google Health
Google Health has the goal organize the world's health information and make it universally accessible and useful. Within the project, both services are offered for all users, as well as specific ones for doctors.
In the general services part, we can find:
- COVID-19 Open Data Repository. Aggregate data from more than 20,000 sources to help better understand the behavior of the virus. Users can download the raw data sets or visualize them through maps and tables.
- Google Health Studies. Users can join studies and answer surveys to help institutions and researchers better understand the specific health problems and needs of a community. The particular data is encrypted for further aggregation and analysis in such a way that neither Google nor the researchers receive any private data.
Google also develops technology solutions aimed at improving healthcare. One of the fields where they are most focused is on jobs with Artificial Intelligence with different purposes such as helping diagnose cancer or prevent blindness.
Uber Movement
The mobility company Uber also provides data and tools, in this case, to understand how and why citizens move. Through the Web Uber Movement you can view, filter and download free, aggregated and anonymized data of trips made through your app. The service is only available and moment for some cities, among which are Madrid and Barcelona.
Specifically, it has 3 data services:
- Travel times. Provides the average travel time between two "zones" in a city for a specified time and date.
- Speed. Provides data on average speed derived from vehicle readings provided by Uber services, aggregated by street segment and with hourly granularity.
- Mobility HeatMap. This is a heat map showing the density of traffic in different areas of each city.
Thanks to this data, travel times can be compared and the impact of various events on the city can be understood. They are very useful for making decisions related to the challenges of urban transport, from reducing traffic jams and emissions to improving road safety.
All data is available through an interactive visualization, although it can also be downloaded in CSV format. This data is licensed Creative Commons, Attribution Non-Commercial.
In short, we are facing 4 different examples of data sharing, but with a common goal: to promote advances in society through the improvement of knowledge. All this data is essential to drive new research, improve decision making and even generate new products and services.
Content elaborated by datos.gob.es team
Blog
Just a few days ago has been officially presented the Digital Charter of Rights. It is an initiative that has had a wide representation of civil society since, on the one hand, a wide and diverse work team has been in charge of its drafting and, on the other, during the procedure of its preparation a public participation procedure so that the appropriate proposals and observations could be made from civil society.
What is the value of the charter?
In recent years, important advances have been made in Spain in regulating the use of technology in various fields. This has happened, for example, with the use of electronic means by Public Administrations, the protection of personal data, electronic trust services, the digital transformation of the financial sector or, without being exhaustive, the conditions for remote work. Numerous regulatory initiatives have also been promoted by the European Union in which the use of data plays a very relevant role. Among them are theDirective (EU) 2019/770 of the European Parliament and of the Council, of May 20, 2019, relating to certain aspects of the contracts for the supply of digital content and services, and the Directive 1024/2019, on open data and reuse of public sector information. Even, in the immediate future, the approval of two European regulations on data governance and Artificial intelligence, projects directly related to EU Digital Strategy which is promoted by the European Commission.
Given this panorama of intense normative production, it could be considered to what extent a new initiative such as the one represented by this Charter. In the first place, it must be emphasized that, unlike those previously mentioned, the Charter is not a legal norm in the strict sense, that is, it does not add new obligations and, therefore, its provisions lack normative value. In fact, as expressly stated in it, its objective is not "to discover digital rights by pretending that they are something different from the fundamental rights already recognized or that new technologies and the digital ecosystem are erected by definition as a source of new rights" but, rather, "outline the most relevant in the environment and digital spaces or describe the instrumental or auxiliary rights of the former."
Beyond the non-existent legal scope of its content, the Charter aims to highlight the impact and consequences that digital scenarios pose for the effectiveness of rights and freedoms, thus suggesting some guidelines in the face of the new challenges that said technological context poses for the interpretation and application of rights today, but also in their more immediate future evolution, which can already be predicted. Taking into account these claims, the call for regulatory compliance from the design in digital environments acquires singular relevance (section I.4),
What is the prominence that the Charter has given to data?
With regard to the digital rights of citizens in their relations with Public Administrations, in Section 3 (Rights of participation and conformation of the public space) some provisions have been established where the protagonism of the data is unquestionable (Section XVIII) :
- Thus, it is established that the principle of transparency and reuse of public sector data will guide the actions of the digital Administration, although its scope is conditioned by what the applicable regulations establish. In any case, this principle is reinforced with the promotion of publicity and accountability. Likewise, the portability of the data and the interoperability of the formats, systems and applications will be ensured, in the terms provided by the current legal system. Specifically (Section 5, Section XXI), the use for the common good of personal and non-personal data, whether they come from the public or private sector, is recognized, including among the purposes the archive in the public interest, research, statistics , as well as innovation and development. In this sense,
- The importance of transparency about the use of artificial intelligence instruments is also emphasized, in particular, about the data used, its margin of error, its scope of application and its decision-making or non-decision-making nature. Beyond its incidence in the public sector, non-discrimination regarding the use of data is generally prohibited (Section 5, Section XXV), and adequate conditions of transparency, auditability, explicability, traceability, supervision must be established. human rights and governance.
- Likewise, the need to carry out an impact assessment on digital rights is established when designing algorithms in the case of automated or semi-automated decision-making. It therefore seems inexcusable that such an evaluation pays special attention to the biases that may occur with regard to the data used and the treatment that may be carried out in the decision-making process. Impact assessment from the perspective of ethical principles and rights related to artificial intelligence is also specifically contemplated for the workplace (Section 4, Section XIX), with special attention to eventual discrimination and conciliation rights.
- Singular importance is given to the need for the Administrations to offer an understandable motivation in natural language for the decisions they adopt using digital means, having to justify especially what criteria for applying the standards have been used and, therefore, the data that have been used. been able to handle to that effect.
- With regard specifically to the health system (Section 5, Section XXIII), on the one hand, it is required to ensure interoperability, access and portability of patient information and, in relation to technological devices developed for therapeutic purposes or care, an attempt is made to prevent its free use from being conditioned on the transfer of the patient's personal data.
Thus, although the Charter of Digital Rights does not incorporate legal obligations by itself, it nevertheless offers interpretive criteria that may be relevant in the process of interpretation and application of the current legislative framework, as well as serve as guidance when promoting future regulatory projects.
On the other hand, even when it does not establish legally enforceable rights, its content establishes relevant measures aimed at the public powers, in particular with regard to the General State Administration and the entities of the state public sector since, ultimately, It is an initiative promoted and formally assumed by the state government.
In short, their forecasts are of particular importance with regard to open data and the reuse of public sector information given that in the coming months important regulations will have to be approved both at the state and European level, so that the content of the Charter can acquire a singular role in the development and application of these norms.
Content written by Julián Valero, professor at the University of Murcia and Coordinator of the Research Group "Innovation, Law and Technology" (iDerTec).
The contents and points of view reflected in this publication are the sole responsibility of its author.
Blog
A couple of weeks ago, we commented in this article the importance of data analysis tools to generate representations that allow a better understanding of the information and make better decisions. In this article we divide these tools into 2 categories: generic data visualization tools - such as Kibana, Tableau Public, SpagoBI (now Knowage) and Grafana - and visualization libraries and APIs. We are going to dedicate this new post to the latter.
Libraries and visualization APIs are more versatile than generic visualization tools, but in order to work with them it is necessary for the user to know the programming language where the library is implemented.
There is a wide range of libraries and APIs for different programming languages or platforms, which implement functionalities related to data visualization. Next, we will show you a selection taking as a fundamental criterion the popularity that the User Community grants them.
Google Chart Tools
Functionality:
Google Chart Tools is Google's API for creating interactive visualizations. It allows the creation of dashboards using different types of widgets, such as category selectors, time ranges or autocompleters, among others.
Main advantages:
It is a very easy-to-use and intuitive tool that allows interaction with data in real time. Furthermore, the generated visualizations can be integrated into web portals using HTML5 / SVG technology.
Do you want to know more?
- Support materials: On Youtube we find various tutorials made by API users.
- Repository: On Github we can access a common library for graphics packages, as well as know the supported chart types and examples of how to customize the components of each graphic, among others.
- User community: Users of Google Chart Tools can raise their questions in the Google community, in the space enabled for it.
JavaScript InfoVis Toolkit
Functionality:
JavaScript InfoVis Toolkit is the JavaScript library that provides functions for creating multiple interactive visualizations such as maps, hierarchical trees or line graphs.
Main advantages:
It is efficient in handling complex data structures and has a wide variety of display options, so it adapts to any developer need.
Do you want to know more?
- Support materials: East user manual explains the main display options and how to work with the library. Also available demos for creating different types of graphics.
- Repository: Users must download the project from http://thejit.org, although they also have available a repository on Github where, among other things, they can download extras.
- User community: Both in the Google user community like in Stackoverflow We found spaces dedicated to JavaScript InfoVis Tookit for users to share doubts and experiences.
Data-Driven Documents (D3.js)
Functionality:
Data-Driven Documents (D3.js) is the Javascript library that allows the creation of interactive graphics and complex visualizations. Thanks to it, data-based documents can be manipulated using open web standards (HTML, SVG and CSS), so that browsers can interpret them to create visualizations independently of proprietary software.
Main advantages:
This library allows the manipulation of a DOM (Object Model for Document Representation) by applying the necessary transformations to the structure based on the data linked to an HTML or XML document. This provides virtually unlimited versatility.
Do you want to know more?
- Support materials: On Github You can find numerous tutorials, although mainly dedicated to the old versions (they are currently in the process of updating this section of the wiki and writing new tutorials on version 4.0 of D3).
- Repository: Also on Github we find up to 53 repositories, which cover different materials to manage thousands of simultaneous animations, group two-dimensional points in hexagonal trays or work with the d3-color module, among others. In this Gallery you can see some of the work done.
- User community:There are spaces for discussion about D3 in the Community of Google,Stackoverflow, Gitter Y Slack.
- Social media: On the Twitter account @ d3js_org experiences, news and use cases are shared. There is also a group in LinkedIn.
Matplotlib
Functionality:
Matplotlib is one of the most popular libraries in Python for creating high-quality graphics and visualizations. It is characterized by presenting a hierarchical organization that goes from the most general level, such as the outline of a 2D matrix, to a very specific level, such as coloring a certain pixel.
Main advantages:
Matplotlib supports text and labels in LaTeX format. In addition, users can customize its functionality through packages designed by third parties (Cartopy, Ridge Map, holoviews, among others).
Do you want to know more?
- Support materials: On its own website we find a user's GuideIt includes information on the installation and use of the various functionalities. Also available tutorials for both beginners, intermediate or advanced users.
- Repository: In this repository Github are the materials you need for installation. On the web you can see a Gallery with examples of works for your inspiration.
- User community: The official website has a community section, although you can also find user groups to help you with your questions in Stackoverflow and Gitter.
- Social media: On Twitter profile @matplotlib Examples of user work and visualizations are also shared, as well as information on the latest news in the tool.
Bokeh
Functionality:
Bokeh is the Python library oriented to the creation of interactive graphs based on HTML / JS. It has the ability to generate interactive visualizations with features such as floating text, zoom, filters or selections, among others.
Main advantages:
Its main advantage is simplicity in implementation: complex interactive visualizations can be created with just a few lines of code. In addition, it allows embedding JavaScript code to implement specific functionalities.
Do you want to know more?
- Support materials: This User's guide provides detailed descriptions and examples that describe many common tasks that can be performed with Bokeh. On the Bokeh website we also find this tutorial and application examples built with this tool.
- Repository: In this repository Github There are the materials and instructions for its installation, as well as examples of use. Examples are also available in this Gallery.
- User community: The official community can be found on the website of Bokeh, although the users of this tool also meet in Stackoverflow.
- Social media:To keep up to date with news, you can follow the Twitter account @bokeh or your profile in LinkedIn.
The following table shows a summary of the tools mentioned above:
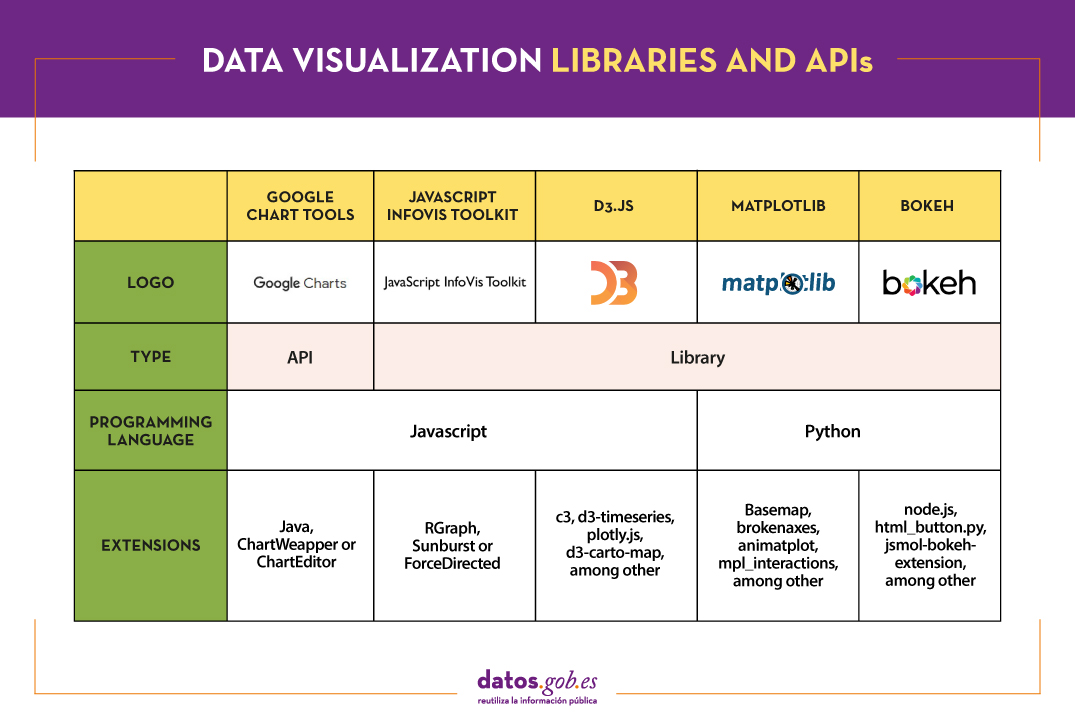
Are you agree with our selection? We invite you to share your experience with these or other tools in the comments section.
If you are looking for tools to help you in data processing, from datos.gob.es we put at your disposal the report "Data processing and visualization tools”, Recently updated, as well as the following monographic articles:
- The most popular data conversion and data cleaning tools
- The most popular data analysis tools
- The most popular data visualisation tools
- The most popular geospatial visualisation tools
- The most popular network analysis tools
Content elaborated by datos.gob.es team.
Blog
More and more media outlets have articles on their pages linked to so-called data journalism. This form of journalism uses the technologies and tools related to to data to provide readers with more documented, easier to understand and more engaging information.
In this article we explain what data journalism consists of and we show you some examples of media that already incorporate this modality within their informational processes.
What is data journalism?
Data journalism or data journalism is a journalistic discipline that incorporates different fields such as computer science, programming, engineering, statistics, design and journalism. to combine in the same space the analysis of data together with the narrative of the press. According to him Data Journalism Handbookdata can be the tool used to tell a story, the source a story is based on, or both.
Data journalism has its origin in Precision Journalism -evolution of investigative journalism-, where disciplines such as sociology and statistics are incorporated into traditional journalism, and Computer Assisted Journalism (Computer Assisted Reporting or CAR), which emerged in 1969 when journalists began to use computer systems to support them when dealing with the information they collected.
Data Journalism goes one step further and is the result of the digital transformation present today in the daily work of many newsrooms throughout the world. Using resources and tools related to data analytics, information is extracted from large databases. In this way, information of greater value and more complete is offered, adapted to the dynamism that digital reading requires.
What products does data journalism offer?
According to the digital magazine Journalists notebooks, there are at least four productions that can derive from this discipline, and that are generally complementary to each other:
- Data-driven articles: These are short articles that are made from large databases. These types of articles are typical of investigative journalism, since their common denominator is based on surveys or statistics.
- Applications news: The services that group information and send notifications to users about news of their interest from different media are becoming more and more common. For example, the main providers. For instance, Google Discover or Samsung Daily.
- Open datasets (datasets): Some media offer open data, the result of their research, in order to democratize information through the accessibility of data and its availability on the Internet in reusable and free formats. As an example, the New York Times offers data on the coronavirus openly.
- Interactive visualizations: such as infographics, graphics or applications that allow the information obtained from the databases to be viewed more clearly, facilitating the understanding of complex topics by readers. Visualizations can complement articles or be a product of their own when accompanied by short explanatory texts.
Data journalism in the media
More and more media have a news production based on data. Here are some examples:
At the national level
Among others, The country,The world or The newspaper They have a specific section within their digital newspapers dedicated to data journalism. Within both, newspapers address current affairs from the perspective offered by the data and through which they generate visualizations.like the following. In it, you can see a map that shows the inequalities in mortality according to the area in which you reside.

For its part, EpData is the platform created by Europa Press to facilitate the use of public data by journalists, with the aim ofboth to enrich the news with graphs and context analysis and to contrast the figures offered by the various sources. EpData also offers tools for creating and editing charts. An example of the activity they carry out is this article, where you can check the status of the dependency waiting lists in Spain.

Another example of data journalism is Newtral. It is an audiovisual content startup founded in 2018 in which data is the basis of all his work, especially in the fight against fake news. For instance, in this article different visualizations of data related to the oscillation of the price of light can be seen during different months.

On an international level
Data journalism is part of some of the most important international newspapers. It is the case of The Guardian, which also has a specific section dedicated to the production of journalistic material through articles, graphics and data-based visualizations. For instance, on this interactive map You can check which areas of Australia suffered the greatest natural disasters in 2020.

Another international media that also has a specific section for data-based journalism is the Argentine newspaper The nation, that through its section The Data Nation offers numerous informative productions in which it combines facts and news. For instance, in this article you can see an indicator of mobility of Argentine citizens.

Masters and studies related to data journalism
The digital transformation has meant that data journalism is here to stay. For this reason, more and more universities and education centers offer studies related to data journalism. For example, him Own Master's Degree in Data and Visualization Journalism from the University of Alcalá; the Master in Digital and Data Journalism taught by Atresmedia and the University of Nebrija or the Data Journalism Course from the UAM-El País School of Journalism.
In short, we are facing a modality with a future, which needs media that continue to bet on this discipline and professional capecesto handle data analysis and treatment tools, but also to tell stories, capable of transmitting what is happening in our environment with the support of data in a truthful and close way.
Therefore, it is not surprising that this form of journalism continues to grow in the coming years and that, in addition to the examples included in this article, the mass media and studies related to data journalism will increase. If you know any more and want to share it, do not hesitate to write to us contacto@datos.gob.es or leave us a message in the comments.
Content prepared by the datos.gob.es team.