Documentación
In order to comply with Directive (EU) 2019/1024 and its subsequent implementing regulation, EU member states are working on making available so-called high-value datasets (HVD). The aim is to enable citizens and businesses to access such data under technical requirements that favour its re-use and its positive impact on society, the economy and the environment.
Opening up these datasets is a major challenge for public administrations in all EU countries. Although much of this data is already available tousers, countries need to identify it in order to be able to report on it and resolve the high heterogeneity in formats, structures and semantics. In particular, from February 2025, Member States will have to report to the Commission every two years on available high-value datasets, including links to licence conditions and APIs.
To assist in this task, the European Data Portal has published the report "Report on Data Homogenisation for High-value Datasets" where it proposes a methodological approach to facilitate the identification and homogenisation of HVD. Among other issues, the report provides examples of standards that help to achieve greater interoperability not only between data, but also between the applications that use them.
A method for identification and homogenisation
The report describes a methodological approach based on three steps:
- The identification of HVDs in existing data portals. Although there are some guidelines for HVD publication, like these for applying DCAT-AP, the naming of already published datasets is not uniform, which makes it difficult to find them. The report proposes a protocol that consists of defining keywords, based on the datasets and their associated attributes, contained in Annex I of the Implementing Regulation. The idea is to use these keywords to search the various existing data portals. The report explains how the identification protocol has been tested with datasets from the categories of business registers, statistical data and transport network data, including tables with the keywords used.
- Localisation or development of data models, ontologies, controlled vocabularies and/or common APIs. In this section, the report describes some useful resources, which are summarised in the following table:
| Resource | DESCRIPTION | Category of data in which they can help the most, according to the report |
|---|---|---|
| Inspire Directive | Characteristics that spatial information and its metadata must have. |
|
|
Inspire Directive data specifications (data specifications) |
Models, schemes and coding rules for different spatial data thematic areas.
|
|
| Inspire network services (network services) | A set of common interfaces for web services that enable the discovery, visualisation, downloading and transformation of spatial data. |
|
|
Technical guidelines for Inspire metadata (Inspire technical guidelines for metadata) |
Technical guidelines for metadata, with the minimum elements to be included as defined in Commission Regulation 1205/2008 . |
|
| Geo-DCATAP | Extension of the DCAT application profile to describe geospatial datasets. |
|
| Core Location Vocabulary | A simplified data model that includes the fundamental characteristics of a location, represented as an address or geographic name, or through geometry. |
|
| General Multilingual Environmental Thesaurus (GEMET). | Controlled vocabulary specialised in environmental information. It has a section on concepts linked to the spatial data categories included in Inspire. |
|
| Semantic Sensor Network | W3C recommendation for describing sensors and their observations. |
|
| Quantity, unit, dimension and type (QUDT). | A set of ontologies defining basic classes, properties and constraints used to model physical quantities, units of measurement and their dimensions in various measurement systems. |
|
| List of Eurostat statistical classifications | Statistical classifications maintained by Eurostat, available as Linked Open Data in XKOS, the SKOS extension for modelling statistical classifications. They are presented by classification family, categorised by statistical domain and sub-domains (e.g. NACE for economic activity, which we will describe below). |
|
| Eurostat standard code lists | Predefined and organised sets of elements presenting statistical concepts using unique codes |
|
| Statistical Data and Metadata eXchange (SDMX) | Global initiative to standardise and harmonise the exchange of statistical data and metadata. It provides technical standards (the SDMX information model), guidelines, an IT architecture, tools and a series of tutorials to assist users. |
|
| RDF Data Cube Vocabulary | Ontology for describing multidimensional data, such as statistics, which is based on the core of the SDMX 2.0 information model. |
|
| Core Business Vocabulary | Referred to by the regulation itself, it consists of a simplified data model that captures the fundamental characteristics of a legal entity, such as its legal name, activity or address. |
|
| NACE Code | Codes for the classification of economic activities in the European Union. Its NACE 2 revision was published by the European Commission in October 2022 |
|
| Organisation ontology | W3C ontology to support the publication of linked data relating to organisational information, i.e. it provides a number of ways to represent the relationship between people and organisations, together with the internal information structure of an organisation. |
|
| Global Legal Entity Identifier Foundation | Centralised database with information on legal entities participating in global financial markets. It assigns each entity a unique Legal Entity Identifier (LEI) code that is recognised worldwide. |
|
| NST Taxonomy | Classification system for goods transported by road, rail, inland waterways and sea. It takes into account the economic activity associated with the origin of the goods. |
|
| Table of authorities of "Transport service" | List of codes for different types of transport services provided by the EU Vocabularies section. |
|
Source: Report on Data Homogenisation for High-value Datasets
The report also mentions some models to be used in the field of smart cities, such as Smart Data Models and the Spanish Open Cities.
- The application of such models. The last step is the actual harmonisation of the data. Once the models to be used have been selected, it is time to apply them. In this phase, the necessary conversion processes will be carried out to provide the data in the appropriate formats and with unified quality metadata. The way in which these transformations are applied will vary depending on the intended end result. For example, it may consist of transforming tabular data (comma-separated values or CSVs, Excel, relational databases, etc.) into other data sources that are also tabular but follow the structure provided in common data models. You can also go further and transform them into tree-based representations (such as JSON) or RDF according to the ontologies and controlled vocabularies you select.
Conclusions of the report
The report ends with a series of conclusions and recommendations. There are still challenges around the identification of HVDs and the implementation of the Implementing Regulation in all European countries, especially in raising awareness and disseminating information about their importance. In HVD categories where there are large data harmonisation initiatives, such as Inspire on geospatial data or Eurostat on statistical HVD, we can find a larger amount of data available in an interoperable and harmonised way. In contrast, in categories where there is no majority initiative, such as companies and company ownership, there is still some way to go to implement the regulation.
The recommendations set out in the European Data Portal report help to shape a roadmap for publishing high-value datasets in each of the categories defined by the European Commission. A challenge that administrations will have to address during 2024 and that will facilitate the re-use of public information.
Blog
Building Europe's digital infrastructure of tomorrow
As a global technology race unfolds, Europe is deploying the regulatory framework and investments needed to foster innovation and technological leadership in areas such as online platforms, artificial intelligence, data, cloud, quantum technologies and virtual worlds. In today's rapidly changing economic context, a state-of-the-art telecommunications infrastructure is a key pillar for growth, innovation and job creation.
For this technological revolution to succeed, says EC Internal Market Commissioner Thierry Breton, it must be ensured that European networks are up to the task in terms of transmission speed, storage capacity, computing power and interoperability. To this end, it will seek to promote a Digital Networks Act that will serve to redefine the DNA of Europe's telecommunications sector.
Exploratory consultation on the future of the electronic communications sector and its infrastructure
From 23 February to 19 May 2023, the European Commission conducted an exploratory consultation on the future of the electronic communications sector and its infrastructure. The aim was to gather views from different stakeholders, in particular on the technological and market changes affecting the sector, as well as the types of infrastructure and investments that Europe is expected to need to lead the digital transformation in the coming years. The consultation was divided into four areas: (i) technological and market developments, (ii) fairness for consumers, (iii) barriers to the single market and (iv) fair contribution of all digital actors.
The Commission received close to 500 responses to the consultation from different interest groups such as companies (including network providers as well as large traffic generators), business associations, citizens, non-governmental organisations, academic institutions, consumer organisations and trade unions, as well as comments from public authorities. Most of the responses came from the EU, although there were also participants from other invited countries such as the United States and the United Kingdom.
From the exploratory consultation on the future of the electronic communications sector and its infrastructure, the following conclusions can be drawn:
- The need for innovation and efficient investment in technologies such as network virtualisation, artificial intelligence, open networks and perimeter cloud (in that order of importance), recognising that these will have a substantial impact on the sector in the coming years by driving cost reductions. Network virtualisation is expected to be the technology with the greatest impact by enabling greater flexibility and improved network efficiency, offering a great opportunity to develop new business models. In terms of investment, most respondents expect that a significant part of their annual revenues in the coming years (up to 50% of revenues) will have to be spent on investments in connectivity infrastructure and replacement of devices from providers considered high risk. Public funding is seen as crucial, but questions remain as to whether it will be enough and how to attract more private investment.
- The second conclusion, relating to consumer equity, is that the majority of respondents indicate that overall broadband access prices will decrease in the coming years, although there is more discrepancy when considering high transmission speeds. There is also no consensus among respondents on the effectiveness/efficiency of the Universal Service Obligation rules to protect consumers with special needs, and there is also disagreement on whether it should continue to be financed by the public budget or by network providers.
- It also points to the importance of harnessing the single market to drive investment and innovation, cooperating on key technology developments, and standardising technologies and platform building, so as to support the deployment of initiatives based on federated, interoperable and open source models. The majority of responses indicate that streamlining and simplifying regulation by harmonising best practices at EUlevel would serve to reduce administrative burdens, supply chain and/or regulatory costs, thereby increasing efficiency and speed of infrastructure deployment.
- The fourth conclusion focuses on the need to protect EU networks. In an interconnected world with growing geopolitical tensions, security is critical. Despite advances in the security of 5G networks, gaps remain in the protection of network infrastructure. A more coordinated European approach, especially with regard to further integration of radio spectrum, and with a better aligned auction model and licensing conditions between regions, could improve coverage in border areas and strengthen the EU against harmful external interference.
- Finally, as regards the contribution of digital players to network roll-out, several telco providers anticipate a negative outlook for the next 5 years, driven by the continued fall in unit prices (in terms of EUR/Mbps), which offset the potential revenues from increased data traffic and, therefore, to the detriment of the investments needed to support such traffic. More than half of the respondents answered in the affirmative on the question of whether large digital players should contribute in a fair and proportionate way to the costs of public goods, services and infrastructure, and on the potential introduction of a mandatory mechanism for direct payments from content application providers.
The role of communications networks in the development of data spaces
The data spaces are ecosystems from which to realise the voluntary sharing of data among their participants, based on the creation of an environment of sovereignty, trust and cybersecurity. In contrast to traditional monolithic models, data spaces are virtual, federated environmentsand are therefore established through integrated governance, organisational, regulatory and technical mechanisms.
Data spaces ensure that a large amount of data and algorithms are available for use in the economy and society, while the companies, organisations and individuals that generate these resources retain control over them. As such, these data sets and algorithms will aspire to maintain their residence in the computer systems of their respective owners, connecting with others on an ad hoc basis according to precise needs, which is why data spaces require a renewed infrastructure of communication networks. Based on 5G (or even 6G) technology, data transmission with lower latency and higher capacity is enabled, and also drives the development of edge computing solutions (edge computing), which allow added flexibility for the emerging European Data Economy.
Likewise, operators, through initiatives such as Open Gateway, will also be able to transform their telecommunication networks into value-added platforms, making their capabilities more flexible and available through standardised APIs, with which to develop new applications and digital solutions of greater complexity and scope. Such developments may encourage the participation, collaboration and interoperability of the different actors in the data spaces, with telecommunications operators also playing an important role as facilitators, not only in the development of use cases, but also in the implementation and operation of these use cases.
Noticia
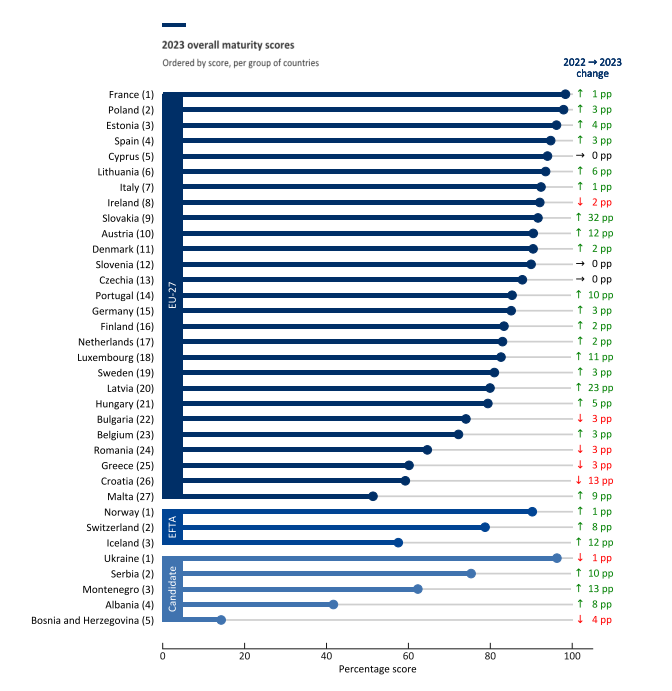
The European Data Portal, data.europa.eu, has just published its Data Maturity Index, an index that assesses the level of maturity of European countries in terms of open data. For its elaboration, an evaluation survey has been carried out and has been completed by 35 countries, including the 27 Member States of the European Union, three countries of the European Free Trade Association (Iceland, Norway and Switzerland) and five candidate countries (Bosnia and Herzegovina, Montenegro, Albania, Serbia and Serbia and Ukraine).
In this year's edition, Spain obtained a score of 95% out of 100%. This places it in fifth place overall and in fourth place if only European Union (EU27) member countries are taken into account. This figure represents an improvement of three percentage points over last year's score and places Spain 12 points above the EU27 average (83%).
The top positions in the ranking are occupied by France, Poland, Ukraine and Estonia.
Above the EU27 average in all dimensions analyzed
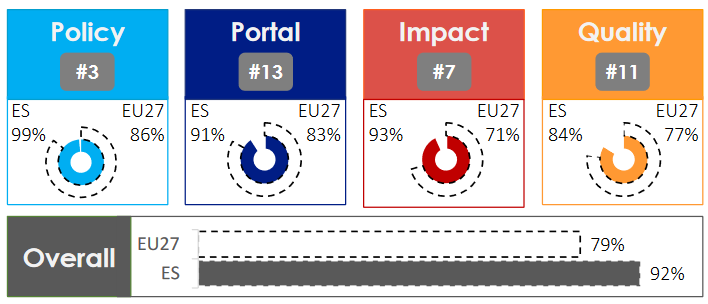
The index is accompanied by a report containing the analysis carried out and an overview of the good practices applied in Europe. In the case of Spain, it is above the EU-27 average in the four indicators analyzed:
-
Policy, focused on the open data policies of the different countries. It analyzes the existence of national governance models for open data management and the measures that have been applied to implement existing strategies. This is the indicator in which Spain obtains a higher score, with 99% compared to 89% in the EU27. The report highlights how the country's national open data strategy helps promote the openness of public information through innovative and structured actions in collaboration with public and private partners. Among other issues, the strategy includes the objective of identifying business models and business success stories to share successful practices. The report also highlights the existence of various digital strategies that complement specific policies on open data, such as the national artificial intelligence strategy, which includes provisions related to the availability of open data for the operation and training of artificial intelligence systems.
-
Impact, which analyzes the activities undertaken to monitor and measure both the reuse of open data and the impact created by such reuse. Traditionally, this has been the least mature dimension across Europe. Nevertheless, Spain scores 96% compared to 77% in the EU27. The best results are achieved in measuring the impact of open data use cases in the environmental, economic and political sectors.
-
Portal, focused on evaluating the functionalities of the national platform that allow users to access open data and help drive interaction within the community. With 96% compared to 85% in the EU27, Spain stands out in the use of analytical tools to understand user behavior, and in the implementation of strategies to ensure the sustainability of the portal and increase its visibility, including presence in social networks. It also highlights the existence of a private area that allows editors to act according to the feedback received.
-
Quality, which examines the mechanisms for ensuring the quality of (meta)data. Here Spain scores 88% compared to 82% in the EU27. Spain's score is driven by compliance with the DCAT-AP standard (providing educational materials for publishers), the existence of a systematic approach to ensure that metadata is up to date, and the wide range of data offered, both historical and current.

The report also measures how EU27 countries are progressing in the implementation of the implementing regulation on high-value datasets. In this section, Spain ranks ninth, with 68% implementation. In general, Member States are making more progress on geospatial and statistical datasets. Progress is also being made on the underlying technical and legal requirements.
Overall recommendations
The report includes a number of recommendations for Spain, among other countries, including encouraging the development of initiatives at the local and regional level, fostering better coordination between teams, and activating the network of open data officers to implement monitoring activities within their organizations. Emphasis is also placed on the need to promote existing open data courses and promote new training materials, paying special attention to developing strategic awareness of the reuse and impact of open data.
Overall, the report shows good progress in open data across Europe. Although there are areas for improvement, the European open data landscape is consolidating, with Spain at the top of the table.
In 2024, new waves of implementation of the European data strategy will present national teams with new challenges. On the one hand, they will have to redouble their efforts to inform citizens of the new data sources arising from initiatives such as the Data Governance Act and the data spaces. In this sense, coordination will be necessary between the new figures arising from these legislative developments and the traditional world of open data, enhancing the obvious synergies between the two to boost the data economy and collectivize the value generated.
Noticia
The European Commission has published the first Report of the state of the Digital Decade. It takes stock of the progress of the European Union on its way to the success of the digital transformation, as set out in the Digital Decade Policy Agenda 2030. The document builds on the agreements and recommendations adopted at European level on digitization towards 2030, including the Council Recommendation (EU) 2021/2122 of 26 November 2021 on a Pact for Research and Innovation in Europe.
Various studies and statistical sources, such as the Eurobarometer on the Digital Decade, the Strategic Foresight Report for 2021 and 2022, as well as different statistical sets from Eurostat on the state of technology, have been taken into account in compiling the report. It also includes the monitoring of the European Declaration on Digital Rights and Principles for the Digital Decade, which translates the EU's vision on digital transformation into principles and commitments.
According to the report, the success of the Digital Decade will be crucial for the future prosperity of the EU. Achieving the agenda could unlock more than €2.8 trillion in economic value, equivalent to 21% of the EU's current economy. To achieve this end, the text highlights the need to incentivize policies and investments in digital technologies, skills and infrastructure.
On this basis, the report includes concrete recommendations to Member States prior to the adoption of their national strategic roadmaps and for their future adjustments.
Spain, a major player
The Commission has prepared a report for each member country in which it exhaustively analyzes its strengths and future duties. About Spain it points out that the country is "in an ambitious digital transformation of the economy" and high rates in connectivity: Spain is, according to the report, one of the EU states with the best results in digital infrastructure.
The three key aspects analyzed in the report are:
-
Connectivity and Public Administration
In this regard, the report points out that Spain is "well above the EU average" in terms of very high capacity fixed networks, with 93% availability compared to 73% of the EU average. In fiber coverage "far exceeds" the EU average, with 91% connectivity compared to 56% of the EU average.
In terms of other technologies such as 5G, Spain is at the European average, with 82% improved broadband access. In addition, the document reveals that 98% of all pioneering 5G bands have already been allocated in the country and that "appropriate measures are being implemented to achieve the objectives of the Digital Decade" such as the Telecommunications Law of 2022.
The report also points out that Spain "is at the forefront of e-Government and digital public services in the EU". It also highlights the effort to update services and infrastructures to adapt them to the "rapid technological evolution" and the needs of companies. In fact, Spain is "well above the EU average" in indicators that measure the number of Internet users who use electronic administration services, with 84% compared to 74% in the EU or in digital public services for citizens, with 86% access, and companies, with 91%. In this sense, it highlights the work that has been done in the interoperability of digital public services at national, regional and local level.
The report includes some recommendations on healthcare digitization and notes that the country should continue to implement its public service digitization policies to "connect more types of healthcare providers to medical records" and implement measures "to ensure regionally comparable quality of service and completeness of healthcare data."
-
Economic development and companies
In terms of economic and technological development, the report praises the country's progress with PERTE Chip, whose objective is the development of semiconductors and cutting-edge technologies to strengthen their design and production in Spanish industry in order to "promote national and EU strategic sovereignty". In this field, it also highlights Spain's participation in the Important Project of Common European Interest (IPCEI) on Microelectronics and Communication Technologies with 11 direct participants active in various fields (material, open source design, equipment, packaging, connectivity, photonics) and that "could help to achieve the first European computer with quantum acceleration by 2025".
As for SMEs, the level of digital development is at the EU level (68%) and highlights the efforts "to improve the digitization of companies" that can be seen in figures: 12.3% of Spanish companies already use Artificial Intelligence and 14.3% use Big Data for analysis and internal use. In addition, it joins the Kit Digital initiative for the digital acceleration of SMEs and the Agents of Change program to hire experts in digital transformation in the field of small and medium-sized enterprises, a type of company with a high number of companies in the country and a "significant participation in the Spanish economy", which makes them a target for reforms and investments that "will have an indirect multiplier impact". The report encourages the country to continue "implementing these policies" in the area of business digitalization, particularly in the case of SMEs.
-
Citizen digitization
In addition, at the citizen level, the report analyzes the digitalization of the Spanish population. In this sense, the document points out that Spain obtains good results in terms of digital skills with 64% and 38% of the population benefiting from these skills respectively. In both cases, the Spanish average is above the EU.
Within the efforts being made when it comes to boosting ICT profiles both in the educational area and in the labor market, the report highlights measures to increase the number of ICT specialists, in particular a law to modernize the vocational education and training (VET) system, approved in March 2022, and a new VET specialization course on AI and big data that allows training in the new digital environment.
The report, which analyzes the state of play in 2022, notes the importance of that year, which stands out as having been the period "of a further acceleration of key trends affecting the digital transformation of the EU digital EU" with increasingly rapid technological advances, such as AI, climate change and associated social and economic concerns, a growing demand for high-speed connectivity or the multipolarization of the global scene in the face of an ever-increasing technological race.
The report concludes that the potential impact of technological change is significant and will require the EU to be agile and swift in its transformation.
Blog
The European Union aims to boost the Data Economy by promoting the free flow of data between member states and between strategic sectors, for the benefit of businesses, researchers, public administrations and citizens. Undoubtedly, data is a critical factor in the industrial and technological revolution we are experiencing, and therefore one of the EU's digital priorities is to capitalise on its latent value, relying on a single market where data can be shared under conditions of security and, above all, sovereignty, as this is the only way to guarantee indisputable European values and rights.
Thus, the European Data Strategy seeks to enhance the exchange of data on a large scale, under distributed and federated environments, while ensuring cybersecurity and transparency. To achieve scale, and to unlock the full potential of data in the digital economy, a key element is building trust. This, as a basic element that conditions the liquidity of the ecosystem, must be developed coherently across different areas and among different actors (data providers, users, intermediaries, service platforms, developers, etc.). Therefore, their articulation affects different perspectives, including business and functional, legal and regulatory, operational, and even technological. Therefore, success in these highly complex projects depends on developing strategies that seek to minimise barriers to entry for participants, and maximise the efficiency and sustainability of the services offered. This in turn translates into the development of data infrastructures and governance models that are easily scalable, and that provide the basis for effective data exchange to generate value for all stakeholders.
A methodology to boost data spaces
Spain has taken on the task of putting this European strategy into practice, and has been working for years to create an environment conducive to facilitating the deployment and establishment of a Sovereign Data Economy, supported, among other instruments, by the Recovery, Transformation and Resilience Plan. In this sense, and from its coordinating and enabling role, the Data Office has made efforts to design a general conceptual methodology , agnostic to a specific sector. It shapes the creation of data ecosystems around practical projects that bring value to the members of the ecosystem.
Therefore, the methodology consists of several elements, one of them being experimentation. This is because, by their flexible nature, data can be processed, modelled and thus interpreted from different perspectives. For this reason, experimentation is key to properly calibrate those processes and treatments needed to reach the market with pilots or business cases already close to the industries, so that they are closer to generating a positive impact. In this sense, it is necessary to demonstrate tangible value and underpin its sustainability, which implies, as a minimum, having:
- Frameworks for effective data governance
- Actions to improve the availability and quality of data, also seeking to increase their interoperability by design
- Tools and platforms for data exchange and exploitation.
Furthermore, given that each sector has its own specificity in terms of data types and semantics, business models, and participants' needs, the creation of communities of experts, representing the voice of the market, is another key element in generating useful projects. Based on this active listening, which leads to an understanding of the dynamics of data in each sector, it is possible to characterise the market and governance conditions necessary for the deployment of data spaces in strategic sectors such as tourism, mobility, agri-food, commerce, health and industry.
In this process of community building, data co-operatives play a fundamental role, as well as the more general figure of the data broker, which serves to raise awareness of the existing opportunity and favour the effective creation and consolidation of these new business models.
All these elements are different pieces of a puzzle with which to explore new business development opportunities, as well as to design tangible projects to demonstrate the differential value that data sharing will bring to the reality of industries. Thus, from an operational perspective, the last element of the methodology is the development of concrete use cases. These will also allow the iterative deployment of a catalogue of reusable experience and data resources in each sector to facilitate the construction of new projects. This catalogue thus becomes the centrepiece of a common sectoral and federated platform, whose distributed architecture also facilitates cross-sectoral interconnection.
On the shoulders of giants
It should be noted that Spain is not starting from scratch, as it already has a powerful ecosystem of innovation and experimentation in data, offering advanced services. We therefore believe it would be interesting to make progress in the harmonisation or complementarity of their objectives, as well as in the dissemination of their capacities in order to gain capillarity. Furthermore, the proposed methodology reinforces the alignment with European projects in the same field, which will serve to connect learning and progress from the national level to those made at EU level, as well as to put into practice the design tasks of the "cyanotypes" promulgated by the European Commission through the Data Spaces Support Centre.
Finally,the promotion of experimental or pilot projects also enables the development of standards for innovative data technologies, which is closely related to the Gaia-X project. Thus, the Gaia-X Hub Spain has an interoperability node, which serves to certify compliance with the rules prescribed by each sector, and thus to generate the aforementioned digital trust based on their specific needs.
At the Data Office, we believe that the interconnection and future scalability of data projects are at the heart of the effort to implement the European Data Strategy, and are crucial to achieve a dynamic and rich Data Economy, but at the same time a guarantor of European values and where traceability and transparency help to collectivise the value of data, catalysing a stronger and more cohesive economy.
Documentación
The Open Data Maturity Study 2022 provides a snapshot of the level of development of policies promoting open data in countries, as well as an assessment of the expected impact of these policies. Among its findings, it highlights that measuring the impact of open data is a priority, but also a major challenge across Europe.
In this edition, there has been a 7% decrease in the average maturity level in the impact dimension for EU27 countries, which coincides with the restructuring of the impact dimension indicators. However, it is not so much a decrease in the level of maturity, but a more accurate picture of the difficulty in assessing the resulting impact of reuse of open data difficulty in assessing the impact resulting from the re-use of open data.
Therefore, in order to better understand how to make progress on the challenge of measuring the impact of open data, we have looked at existing best practices for measuring the impact of open data in Europe. To achieve this objective, we have worked with the data provided by the countries in their responses to the survey questionnaire and in particular with those of the eleven countries that have scored more than 500 points in the Impact dimension, regardless of their overall score and their position in the ranking: France, Ireland, Cyprus, Estonia and the Czech Republic scoring the maximum 600 points; and Poland, Spain, Italy, Denmark and Sweden scoring above 510 points.
In the report we provide a country profile for each of the ten countries, analysing in general terms the country's performance in all dimensions of the study and in detail the different components of the impact dimension, summarising the practices that have led to its high score based on the analysis of the responses to the questionnaire.
Through this tabbed structure the document allows for a direct comparison between country indicators and provides a detailed overview of best practices and challenges in the use of open data in terms of measuring impact through the following indicators:
- "Strategic awareness": It quantifies the awareness and preparedness of countries to understand the level of reuse and impact of open data within their territory.
- "Measuring reuse": It focuses on how countries measure open data re-use and what methods they use.
-
"Impact created": It collects data on the impact created within four impact areas: government impact (formerly policy impact), social impact, environmental impact and economic impact.
Finally, the report provides a comparative analysis of these countries and draws out a series of recommendations and good practices that aim to provide ideas on how to improve the impact of open data on each of the three indicators measured in the study.
If you want to know more about the content of this report, you can watch the interview with its author interview with its author.
Below, you can download the full report, the executive summary and a presentation-summary.
Content prepared by Jose Luis Marín, Senior Consultant in Data, Strategy, Innovation & Digitalization.
The contents and views expressed in this publication are the sole responsibility of the author.
Blog
The European Commission's 'European Data Strategy' states that the creation of a single market for shared data is key. In this strategy, the Commission has set as one of its main objectives the promotion of a data economy in line with European values of self-determination in data sharing (sovereignty), confidentiality, transparency, security and fair competition.
Common data spaces at European level are a fundamental resource in the data strategy because they act as enablers for driving the data economy. Indeed, pooling European data in key sectors, fostering data circulation and creating collective and interoperable data spaces are actions that contribute to the benefit of society.
Although data sharing environments have existed for a long time, the creation of data spaces that guarantee EU values and principles is an issue. Developing enabling legislative initiatives is not only a technological challenge, but also one of coordination among stakeholders, governance, adoption of standards and interoperability.
To address a challenge of this magnitude, the Commission plans to invest close to €8 billion by 2027 in the deployment of Europe's digital transformation. Part of the project includes the promotion of infrastructures, tools, architectures and data sharing mechanisms. For this strategy to succeed, a data space paradigm that is embedded in the industry needs to be developed, based on the fulfilment of European values. This data space paradigm will act as a de facto technology standard and will advance social awareness of the possibilities of data, which will enable the economic return on the investments required to create it.
In order to make the data space paradigm a reality, from the convergence of current initiatives, the European Commission has committed to the development of the Simpl project.
What exactly is Simpl?
Simpl is a €150 million project funded by the European Commission's Digital Europe programme with a three-year implementation period. Its objective is to provide society with middleware for building data ecosystems and cloud infrastructure services that support the European values of data sovereignty, privacy and fair markets.
The Simpl project consists of the delivery of 3 products:
- Simpl-Open: Middleware itself. This is a software solution to create ecosystems of data services (data and application sharing) and cloud infrastructure services (IaaS, PaaS, SaaS, etc). This software must include agents enabling connection to the data space, operational services and brokerage services (catalogue, vocabulary, activity log, etc.). The result should be delivered under an open source licence and an attempt will be made to build an open source community to ensure its evolution.
- Simpl-Labs: Infrastructure for creating test bed environments so that interested users can test the latest version of the software in self-service mode. This environment is primarily intended for data space developers who want to do the appropriate technical testing prior to a deployment.
- Simpl-Live: Deployments of Simpl-open in production environments that will correspond to sectorial spaces contemplated in the Digital Europe programme. In particular, the deployment of data spaces managed by the European Commission itself (Health, Procurement, Language) is envisaged.
The project is practically oriented and aims to deliver results as soon as possible. It is therefore intended that, in addition to supplying the software, the contractor will provide a laboratory service for user testing. The company developing Simpl will also have to adapt the software for the deployment of common European data spaces foreseen in the Digital Europe programme.
The Gaia-X partnership is considered to be the closest in its objectives to the Simpl project, so the outcome of the project should strive for the reuse of the components made available by Gaia-X.
For its part, the Data Space Support Center, which involves the main European initiatives for the creation of technological frameworks and standards for the construction of data spaces, will have to define the middleware requirements by means of specifications, architectural models and the selection of standards.
Simpl's preparatory work was completed in May 2022, setting out the scope and technical requirements of the project which have been the subject of detail in the currently open contractual process. The tender was launched on 24 February 2023. All information is available on TED eTendering, including how to ask questions about the tendering process. The deadline for applications is 24 April 2023 at 17:00 (Brussels time).
Simpl expects to have a minimum viable platform published in early 2024. In parallel, and as soon as possible, the open test environment (Simpl-Labs) will be made available for interested parties to experiment. This will be followed by the progressive integration of different use cases, helping to tailor Simpl to specific needs, with priority being given to cases otherwise funded under the Europe DIGITAL work programme.
In conclusion, Simpl is the European Commission's commitment to the deployment and interoperability of the different sectoral data space initiatives, ensuring alignment with the specifications and requirements emanating from the Data Space Support Center and, therefore, with the convergence process of the different European initiatives for the construction of data spaces (Gaia-X, IDSA, Fiware, BDVA).
Noticia
Gaia-X represents an innovative paradigm for linking data more closely to the technological infrastructure underneath, so as to ensure the transparency, origin and functioning of these resources. This model allows us to deploy a sovereign and transparent data economy, which respects European fundamental rights, and which in Spain will take shape around the sectoral data spaces (C12.I1 and C14.I2 of the Recovery, Transformation and Resilience Plan). These data spaces will be aligned with the European regulatory framework, as well as with governance and instruments designed to ensure interoperability, and on which to articulate the sought-after single data market.
In this sense, Gaia-X interoperability nodes, or Gaia-X Digital Clearing House (GXDCH), aim to offer automatic validation services of interoperability rules to developers and participants of data spaces. The creation of such nodes was announced at the Gaia-X Summit 2022 in Paris last November. The Gaia-X architecture, promoted by the Gaia-X European Association for Data & Cloud AISBL, has established itself as a promising technological alternative for the creation of open and transparent ecosystems of data sets and services.
These ecosystems, federated by nature, will serve to develop the data economy at scale. But in order to do so, a set of minimum rules must be complied with to ensure interoperability between participants. Compliance with these rules is precisely the function of the GXDCH, serving as an "anchor" to deploy certified market services. Therefore, the creation of such a node in Spain is a crucial element for the deployment of federated data spaces at national level, which will stimulate development and innovation around data in an environment of respect for data sovereignty, privacy, transparency and fair competition.
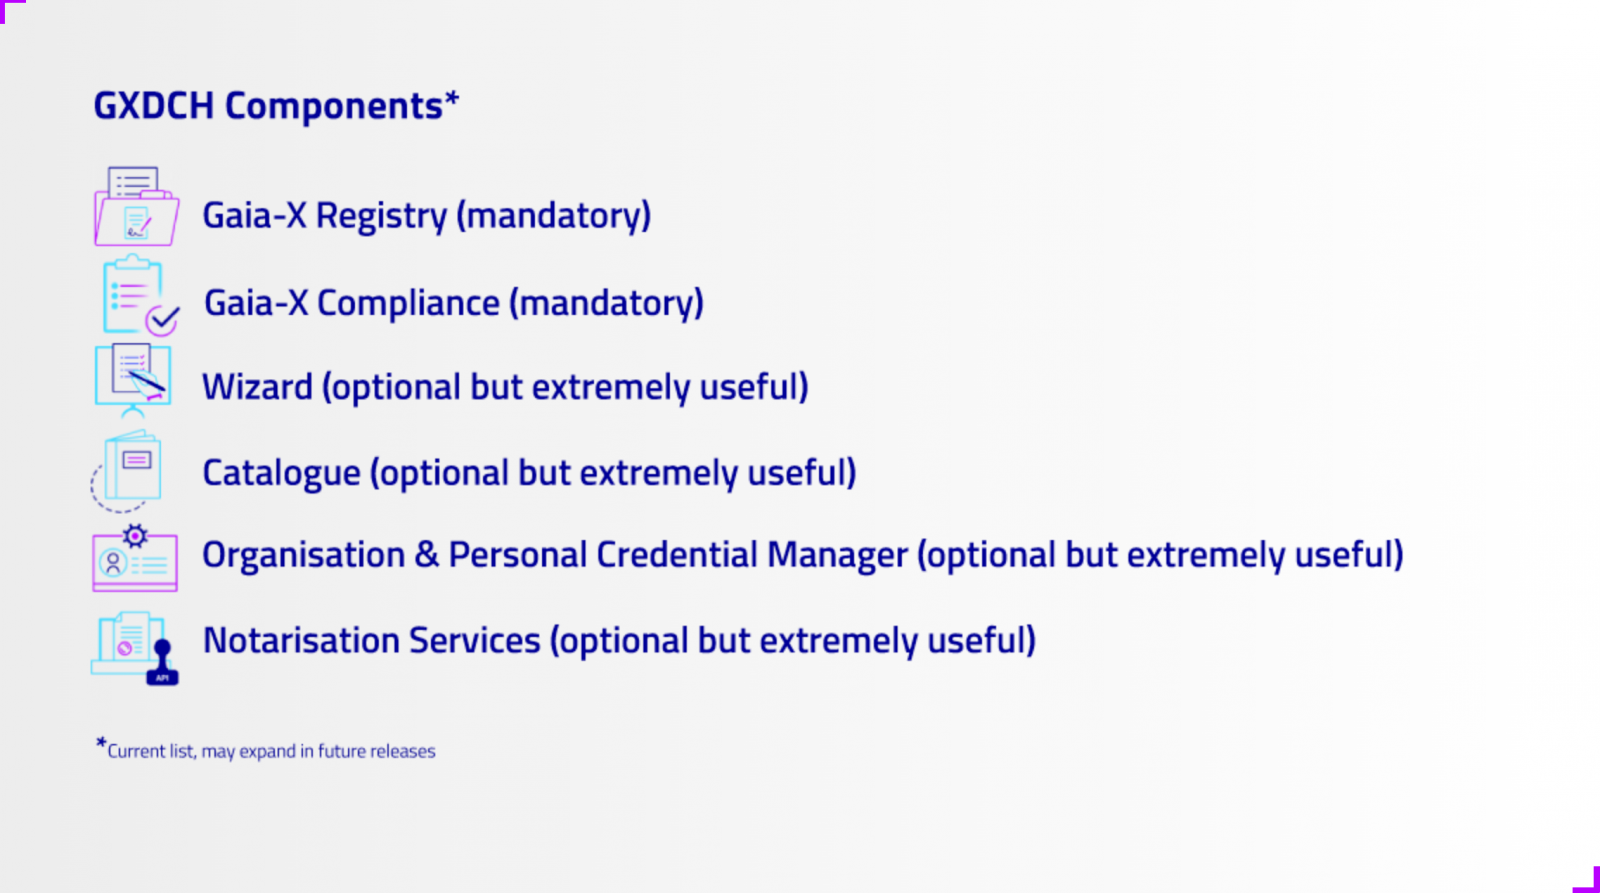
The GXDCH is defined as a node where operational services of an ecosystem compliant with the Gaia-X interoperability rules are provided. Operational services" should be understood as services that are necessary for the operation of a data space, but are not in themselves data sharing services, data exploitation applications or cloud infrastructures. Gaia-X defines six operational services, of which at least two must be part of the mandatory nodes hosting the GXDCHs:
Mandatory services
- Gaia-X Registry: Defined as an immutable, non-repudiable, distributed database with code execution capabilities. Typically it would be a blockchain infrastructure supporting a decentralised identity service ('Self Sovereign Identity') in which, among others, the list of Trust Anchors or other data necessary for the operation of identity management in Gaia-X is stored.
- Gaia-X Compliance Service or Gaia-X Compliance Service: Belongs to the so-called Gaia-X Federation Services and its function is to verify compliance with the minimum interoperability rules defined by the Gaia-X Association (e.g. the Trust Framework).
Optional services
- Self-Descriptions (SDs) or Wizard Edition Service: SDs are verifiable credentials according to the standard defined by the W3C by means of which both the participants of a Gaia-X ecosystem and the products made available by the providers describe themselves. The aforementioned compliance service consists of validating that the SDs comply with the interoperability standards. The Wizard is a convenience service for the creation of Self-Descriptions according to pre-defined schemas.
- Catalogue: Storage service of the service offer available in the ecosystem for consultation.
- e-Wallet: For the management of verifiable credentials (SDs) by participants in a system based on distributed identities.
- Notary Service: Service for issuing verifiable credentials signed by accreditation authorities (Trust Anchors).
What is the Gaia-X Compliance Service (i.e. Compliance Service)?
The Gaia-X Compliance Service belongs to the so-called Gaia-X Federation Services and its function is to verify compliance with the minimum interoperability rules defined by the Gaia-X Association. Gaia-X calls these minimum interoperability rules (Trust Framework). It should be noted that the establishment of the Trust Framework is one of the differentiating contributions of the Gaia-X technology framework compared to other solutions on the market. But the objective is not just to establish interoperability standards, but to create a service that is operable and, as far as possible, automated, that validates compliance with the Trust Framework. This service is the Gaia-X Compliance Service.
The key element of these rules are the so-called "Self-Descriptions" (SDs). SDs are verifiable credentials according to the standard defined by the W3C by which both the participants of a data space and the products made available by the providers describe themselves. The Gaia-X Compliance service validates compliance with the Trust Framework by checking the SDs from the following points of view:
- Format and syntax of the SDs
- Validation of the SDs schemas (vocabulary and ontology)
- Validation of the cryptography of the signatures of the issuers of the SDs
- Attribute consistency
- Attribute value veracity.
Once the Self-Descriptions have been validated, the compliance service operator issues a verifiable credential that attests to compliance with interoperability standards, providing confidence to ecosystem participants. Gaia-X AISBL provides the necessary code to implement the Compliance Service and authorises the provision of the service to trusted entities, but does not directly operate the service and therefore requires the existence of partners to carry out this task.
Blog
Public administration is working to ensure access to open data, in order to empowering citizens in their right to information. Aligned with this objective, the European open data portal (data.europa.eu) references a large volume of data on a variety of topics.
However, although the data belong to different information domains or are in different formats, it is complex to exploit them together to maximise their value. One way to achieve this is through the use of RDF (Resource Description Framework), a data model that enables semantic interoperability of data on the web, standardised by the W3C, and highlighted in the FAIR principles. RDF occupies one of the top levels of the five-star schema for open data publishing, proposed by Tim Berners-Lee, the father of the web.
In RDF, data and metadata are automatically interconnected, generating a network of Linked Open Data (LOD) by providing the necessary semantic context through explicit relationships between data from different sources to facilitate their interconnection. This model maximises the exploitation potential of linked data.
It is a data sharing paradigm that is particularly relevant within the EU data space initiative explained in this post.
RDF offers great advantages to the community. However, in order to maximise the exploitation of linked open data it is necessary to know the SPARQL query language, a technical requirement that can hinder public access to the data.
An example of the use of RDF is the open data catalogues available on portals such as datos.gob.es or data.europa.eu that are developed following the DCAT standard, which is an RDF data model to facilitate their interconnection. These portals have interfaces to configure queries in SPARQL language and retrieve the metadata of the available datasets.
A new app to make interlinked data accessible: Vinalod.
Faced with this situation and with the aim of facilitating access to linked data, Teresa Barrueco, a data scientist and visualisation specialist who participated in the 2018 EU Datathon, the EU competition to promote the design of digital solutions and services related to open data, developed an application together with the European Publications Office.
The result is a tool for exploring LOD without having to be familiar with SPARQL syntax, called Vinalod: Visualisation and navigation of linked open data. The application, as its name suggests, allows you to navigate and visualise data structures in knowledge graphs that represent data objects linked to each other through the use of vocabularies that represent the existing relationships between them. Thus, through a visual and intuitive interaction, the user can access different data sources:
- EU Vocabularies. EU reference data containing, among others, information from Digital Europa Thesaurus, NUTS classification (hierarchical system to divide the economic territory of the EU) and controlled vocabularies from the Named Authority Lists.
- Who's Who in the EU. Official EU directory to identify the institutions that make up the structure of the European administration.
- EU Data. Sets and visualisations of data published on the EU open data portal that can be browsed according to origin and subject.
- EU publications. Reports published by the European Union classified according to their subject matter.
- EU legislation. EU Treaties and their classification.
The good news is that the BETA version of Vinalod is now available for use, an advance that allows for temporary filtering of datasets by country or language.
To test the tool, we tried searching for data catalogues published in Spanish, which have been modified in the last three months. The response of the tool is as follows:

And it can be interpreted as follows:

Therefore, the data.europa.eu portal hosts ("has catalog") several catalogues that meet the defined criteria: they are in Spanish language and have been published in the last three months. The user can drill down into each node ("to") and find out which datasets are published in each portal.
In the example above, we have explored the 'EU data' section. However, we could do a similar exercise with any of the other sections. These are: EU Vocabularies; Who's Who in the EU; EU Publications and EU Legislation.
All of these sections are interrelated, that means, a user can start by browsing the 'EU Facts', as in the example above, and end up in 'Who's Who in the EU' with the directory of European public officials.

As can be deduced from the above tests, browsing Vinalod is a practical exercise in itself that we encourage all users interested in the management, exploitation and reuse of open data to try out.
To this end, in this link we link the BETA version of the tool that contributes to making open data more accessible without the need to know SPARQL, which means that anyone with minimal technical knowledge can work with the linked open data.
This is a valuable contribution to the community of developers and reusers of open data because it is a resource that can be accessed by any user profile, regardless of their technical background. In short, Vinalod is a tool that empowers citizens, respects their right to information and contributes to the further opening of open data.
Blog
Like every other year, the EU Open Data Portal has just published the results of its report Open Data Maturity 2022. It is a study that assesses the maturity of European countries in the field of open data and it provides an overview of the good practices followed in Europe, which can be transferred to other national and local contexts. Both the member states of the European Union (EU-27) and other countries in the region have participated in the study.
Spain has achieved a score of 92%, thirteen points above the EU27 average. With this score, it is in the leading group. France secured first place, followed by Ukraine and Poland.
Spain is above the European average for the 4 indicators analysed
The report measures maturity in relation to four aspects of open data:
- Policy, focused on the open data strategies of the different countries.
- Impact, which analyses the activities carried out to monitor and measure the reuse of open data and their impact.
- Portal, focused on evaluating the functions and characteristics of the national platform that allows users to access open data and promote interaction within the community.
- Quality, which examines mechanisms to ensure the quality of (meta)data.
In all four categories, Spain is ahead of the EU27 average, particularly standing out in the policy section. Some of the aspects that the report highlights in Spain are the open mechanisms for communicating and interacting from datos.gob.es with the open data community, the use of dashboards to monitor the use of datasets or some specific examples of use cases such as Climate change scenario viewer or Gijón in a click.
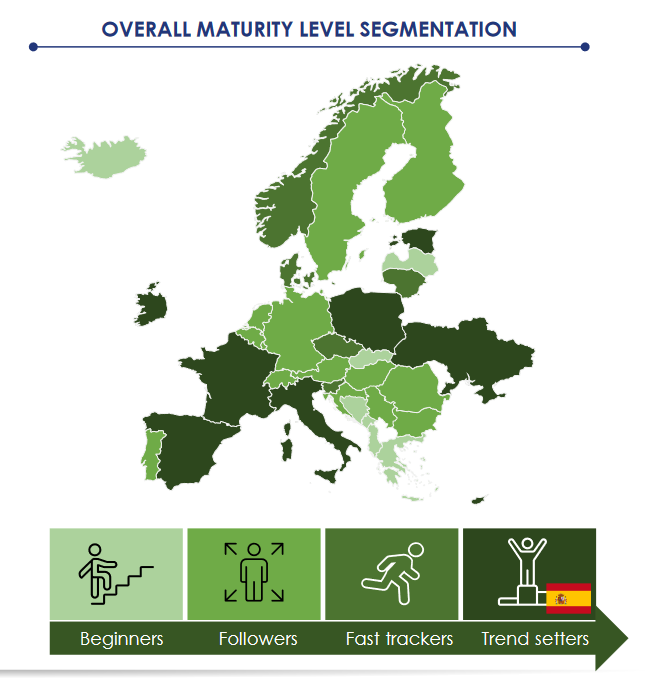
With this score, Spain falls within the so-called trendsetter group. The countries that belong to this group stand out for their strong commitment to open data, borne out by an advanced strategy, more mature platforms and an active methodology for measuring the impact of open data.

3 key trends in Europe
This year's analysis highlights three trends at European level:
- EU Member States are preparing for the implementation of the high-value datasets regulation. Directive 2019/1024 highlighted, amongst other issues, a specific regime for the so-called high-value data, in other words, those whose reuse is associated with considerable benefits for society, the environment and the economy. Although their implementing regulation has not yet been made public, 96% of EU Member States are already working on the identification of high-value data, especially in the categories of statistical, geospatial, Earth observation, environmental and meteorological data. In addition, 85% are already prepared to monitor and measure their level of reuse and 63% to ensure their interoperability with available data sets from other countries. Spain is no exception and it is one of the most advanced countries in this regard.
- Measuring the impact of open data is a priority for EU Member States, but it is a major challenge too. Countries are still interested in understanding and capturing open data reuse and value creation, but compiling data on the impact created remains challenging, especially in the economic area.
- In a post-pandemic world, European countries face new and old common challenges. The impact of the war in Ukraine has affected all countries, both socially and economically. Open data have proven to serve as a mechanism to help refugees or improve energy management. Other common challenges highlighted in the report are the lack of resources and qualified personnel or the difficulty in coordinating between the different levels of the administration, inter alia.
Recommendations to keep moving ahead in the field of open data
The report ends with a series of recommendations by groups of countries. In the case of open data trendsetters, the group to which Spain belongs, the report recommends focusing on maintaining the current ecosystem, experimenting and sharing knowledge.
To be precise, the focus should be placed on improving and consolidating open data ecosystems through the development of thematic communities of providers and reusers. It is also recommended to collaborate with data.europa.eu, other national data teams, universities and research institutions to develop an experimental impact evaluation framework.
High-value data sets stand out as one of the areas to prioritise, based on that which was previously indicated in Directive 2019/1024. In addition to preparing for the Data Governance Regulation, evaluating the existing options to expand the portals and assuming the role of public registry for those organisations linked to the altruistic transfer of data.
You can read the full report via this link.