Blog
The Open Data Maturity Report is an annual evaluation that since 2015 has analysed the development and evolution of open data initiatives in the European Union. Coordinated by the European Data Portal (data.europa.eu) and carried out in collaboration with the European Commission, this report assesses 36 participating countries: the 27 EU Member States, 3 European Free Trade Association countries (Iceland, Norway and Switzerland) and 6 candidate countries.
The report assesses four key dimensions:
- Policy (strategies and regulatory frameworks)
- Portal (functionalities and usability)
- Quality (metadata and data standards)
- Impact (reuse and benefits generated)
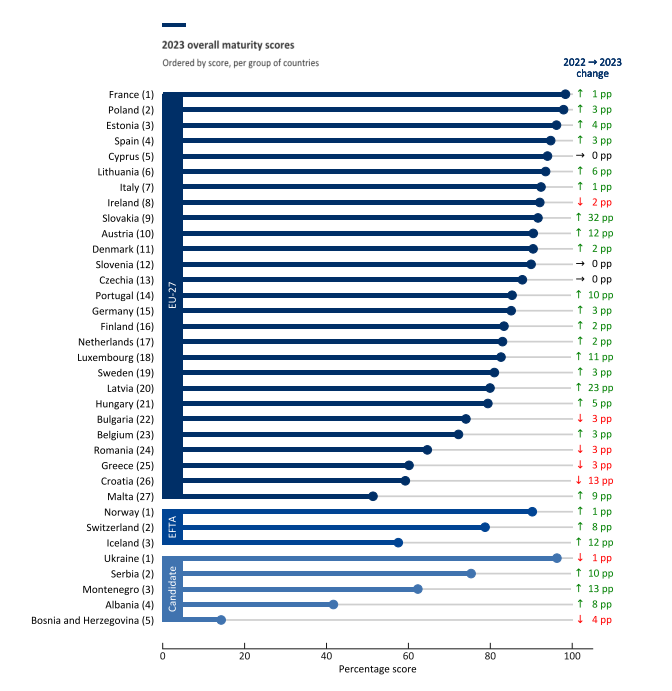
In the 2025 edition, Spain stood out with a score of 100% in the impact block compared to the European average of 82.1%. In general terms, it occupies the fifth position among the countries of the European Union with a total score of 95.6%, forming part of the group of countries that prescribe trends.
A differential aspect of this edition of the report is the incorporation of a descriptive and contextual approach that complements the traditional regulatory model, creating clusters of countries to allow fairer comparisons. These clusters group countries with similar economic, social, political, and digital characteristics, and are based on profiles that explain how open data policies are implemented, not just what results are obtained. The aim is to invite countries to look at their peers , learn from comparable experiences and promote more effective peer-to-peer learning than based solely on general rankings.
In addition to quantifying it, the report includes use cases and good practices carried out by countries to open and reuse public sector data. In this post, we highlight some of them that can serve as inspiration to continue improving our open data ecosystem.
Croatia's inclusive and coordinated governance
One of the most noteworthy aspects of the 2025 report is how some countries have managed to establish strong governance structures that ensure coordination between different levels of administration and multi-stakeholder participation.
Croatia stands out for having established in 2025 the Coordination for the Implementation of the Open Data Policy, a multisectoral body that monitors regulatory compliance, improves data accessibility, and supports authorities. This model ensures broad participation and ensures that national and local initiatives are aligned. The national portal functions as a central hub, complemented by local portals such as the one for the city of Zagreb. In addition, knowledge exchanges are encouraged through coordination meetings, regular updates and collaborations with universities, such as the Faculty of Electrical and Computer Engineering at the University of Zagreb.
France's complete data governance structure
This country leads the ranking of the Open Data Maturity Report thanks, among others, to its comprehensive governance model that integrates open data roles at all administrative levels. At the national level, the General Data Administrator coordinates public data policy and oversees a network of chief data officers in each ministry. Etalab, the national open data and digital innovation unit, manages this network and provides technical support.
At the ministerial level, each data controller manages the data policy (openness, quality and reuse), supported by Etalab. Some ministries also appoint specific open data officers and data stewards who handle technical and organizational aspects of the publication. At the local level, each regional representative (préfet) designates a referent for data, algorithms and source codes. The Digital Inter-Ministerial Directorate also coordinates a network of API managers to enable dynamic access to data. They also ensure compliance with DCAT-AP in their metadata, as we do in Spain.
Effective implementation: from strategy to action in Italy
Italian public administrations are obliged to adopt data publication plans, following national guidelines, which prioritise high-value datasets, dynamic data and user-requested information. The implementation is supported by a robust monitoring system. The Agency for Digital Italy (AgID) tracks progress through its Digital Transformation Dashboard, which reports the growth of datasets in dati.gov.it.
Policies are updated regularly: the latest three-year plan (2024-2026) was adopted in December 2024. To assist data holders and officials, AgID provides guidance, conducts webinars, and launched the AgID Academy to strengthen digital competencies.
Culture of reuse in Poland and Ukraine
A crucial aspect of encouraging open data is to provide practical resources to guide public organizations throughout the process. Poland stands out for its open data manual, the second edition of which was published by the Ministry of Digital Affairs.
This updated handbook introduces new categories of data, explains how regulations shape open data policies, and introduces the Poland Data Portal.
The handbook functions as a checklist for offices, guiding them through their responsibilities to open data and foster a culture of reuse and include tools such as an openness checklist for compliance.
In this regard, Ukraine has also adopted an approach towards reuse and the generation of resources that incentivise this reuse of data. The Ministry of Digital Transformation has developed a comprehensive set of resources and tools including detailed technical documentation and templates to help prepare and publish datasets aligned with national standards, covering metadata structuring, licensing, and compliance with the DCAT-AP standard.
The national portal includes functionalities for tracking the publication and reuse of datasets. Suppliers receive feedback on the quality and completeness of their metadata, helping them identify areas for improvement. In addition, regular training sessions and workshops are organized to develop the skills of publishers, promoting a shared understanding of open data principles and technical requirements.
Albania: comprehensive redesign of the portal
This country exemplifies the maturity improvements that can be achieved through a comprehensive update of the national open data portal. The large-scale revamp of the portal improved usability, transparency, and user engagement.
The updated portal now features a dataset rating system (1-5 stars), a dedicated news section on open data topics , and multiple notification options, including RSS and Atom feeds, and email. Users can track the progress of their data requests, which are actively monitored and responses summarized in publicly available reports.
To better understand and respond to user needs, the portal team tracks search keywords, analyzes traffic, and conducts user surveys and workshops.
Lithuania: official monitoring methodology
One of the key practices highlighted in the report is the adoption of formal frameworks and structured methodologies that provide a systematic way to assess the impact of open data. Lithuania excels with a comprehensive approach because it defines how institutions should report on open data activities, ensuring consistency, accountability, and compliance across the public sector.
In addition, the Ministry of Economy and Innovation made calculations to estimate the economic impact of open data. This analysis provides quantifiable evidence of the contribution of open data to innovation, productivity and job creation. The results show that open data in Lithuania creates a market value of approximately €566 billion (around 1.2% of GDP) and supports close to 8,000 value-added jobs.
Germany: systematic funding for collaboration
Germany's mFund initiative provides structured financial support for mobility-related data projects, fostering partnerships beyond government.
An example is the miki (mobil im Kiez) project, which develops navigation and orientation solutions for people with limited mobility through the active engagement of civil society. The team created a national prototype with visualizations for cities such as Cologne, Kassel, Munich, Potsdam and Saarbrücken, showing building barriers and road surfaces. These visualizations will be integrated into Wheelmap.org, helping individuals with mobility disabilities.
Conclusion
In conclusion, the Open Data Maturity Report 2025 demonstrates that the most open data mature European countries share common characteristics: inclusive and well-structured governance, effective implementation supported by planning and monitoring, practical support to data publishers, continuous technical innovation in portals and, crucially, systematic impact measurement.
The good practices highlighted here are transferable and adaptable. We invite Spanish public administrations to explore these experiences, adapt them to their local contexts and share their own innovations, thus contributing to an increasingly robust and impact-oriented European open data ecosystem.
Blog
For more than a decade, open data platforms have measured their impact through relatively stable indicators: number of downloads, web visits, documented reuses, applications or services created based on them, etc. These indicators worked well in an ecosystem where users – companies, journalists, developers, anonymous citizens, etc. – directly accessed the original sources to query, download and process the data.
However, the panorama has changed radically. The emergence of generative artificial intelligence models has transformed the way people access information. These systems generate responses without the need for the user to visit the original source, which is causing a global drop in web traffic in media, blogs and knowledge portals.
In this new context, measuring the impact of an open data platform requires rethinking traditional indicators to incorporate new ones to the metrics already used that also capture the visibility and influence of data in an ecosystem where human interaction is changing.
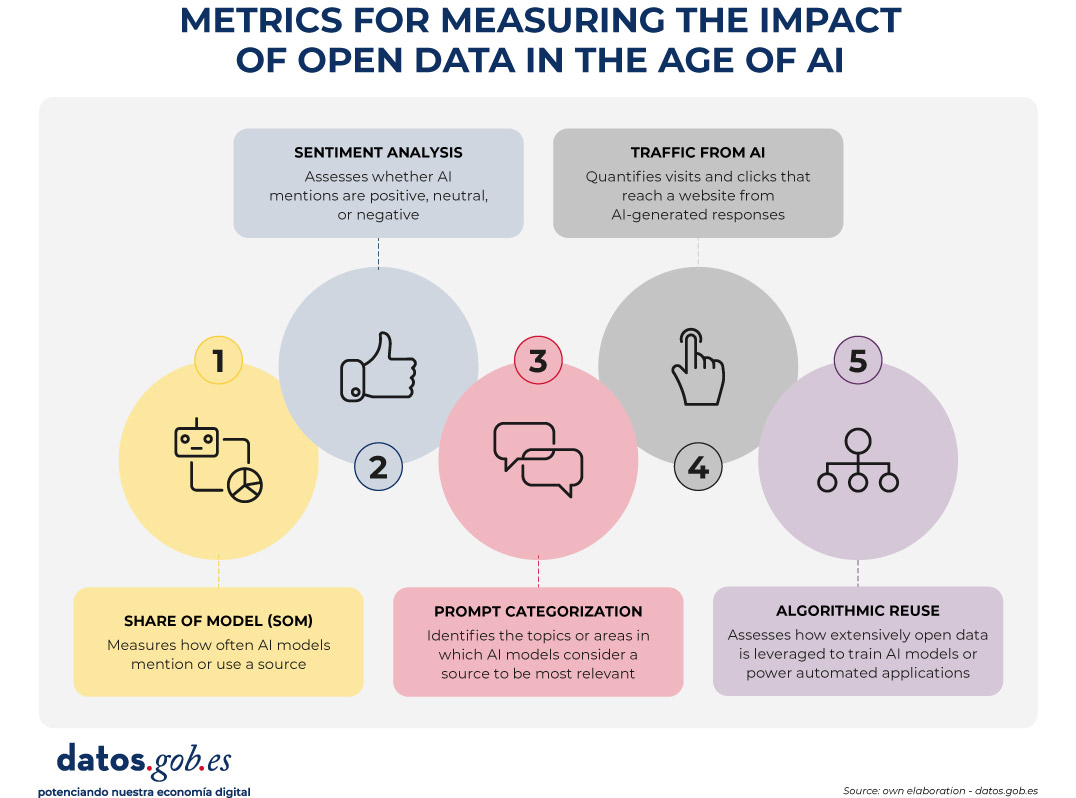
Figure 1. Metrics for measuring the impact of open data in the age of AI.
A structural change: from click to indirect consultation
The web ecosystem is undergoing a profound transformation driven by the rise of large language models (LLMs). More and more people are asking their questions directly to systems such as ChatGPT, Copilot, Gemini or Perplexity, obtaining immediate and contextualized answers without the need to resort to a traditional search engine.
At the same time, those who continue to use search engines such as Google or Bing are also experiencing relevant changes derived from the integration of artificial intelligence on these platforms. Google, for example, has incorporated features such as AI Overviews, which offers automatically generated summaries at the top of the results, or AI Mode, a conversational interface that allows you to drill down into a query without browsing links. This generates a phenomenon known as Zero-Click: the user performs a search on an engine such as Google and gets the answer directly on the results page itself. As a result, you don't need to click on any external links, which limits visits to the original sources from which the information is extracted.
All this implies a key consequence: web traffic is no longer a reliable indicator of impact. A website can be extremely influential in generating knowledge without this translating into visits.
New metrics to measure impact
Faced with this situation, open data platforms need new metrics that capture their presence in this new ecosystem. Some of them are listed below.
-
Share of Model (SOM): Presence in AI models
Inspired by digital marketing metrics, the Share of Model measures how often AI models mention, cite, or use data from a particular source. In this way, the SOM helps to see which specific data sets (employment, climate, transport, budgets, etc.) are used by the models to answer real questions from users, revealing which data has the greatest impact.
This metric is especially valuable because it acts as an indicator of algorithmic trust: when a model mentions a web page, it is recognizing its reliability as a source. In addition, it helps to increase indirect visibility, since the name of the website appears in the response even when the user does not click.
-
Sentiment analysis: tone of mentions in AI
Sentiment analysis allows you to go a step beyond the Share of Model, as it not only identifies if an AI model mentions a brand or domain, but how it does so. Typically, this metric classifies the tone of the mention into three main categories: positive, neutral, and negative.
Applied to the field of open data, this analysis helps to understand the algorithmic perception of a platform or dataset. For example, it allows detecting whether a model uses a source as an example of good practice, if it mentions it neutrally as part of an informative response, or if it associates it with problems, errors, or outdated data.
This information can be useful to identify opportunities for improvement, strengthen digital reputation, or detect potential biases in AI models that affect the visibility of an open data platform.
-
Categorization of prompts: in which topics a brand stands out
Analyzing the questions that users ask allows you to identify what types of queries a brand appears most frequently in. This metric helps to understand in which thematic areas – such as economy, health, transport, education or climate – the models consider a source most relevant.
For open data platforms, this information reveals which datasets are being used to answer real user questions and in which domains there is greater visibility or growth potential. It also allows you to spot opportunities: if an open data initiative wants to position itself in new areas, it can assess what kind of content is missing or what datasets could be strengthened to increase its presence in those categories.
-
Traffic from AI: clicks from digests generated
Many models already include links to the original sources. While many users don't click on such links, some do. Therefore, platforms can start measuring:
- Visits from AI platforms (when these include links).
- Clicks from rich summaries in AI-integrated search engines.
This means a change in the distribution of traffic that reaches websites from the different channels. While organic traffic—traffic from traditional search engines—is declining, traffic referred from language models is starting to grow.
This traffic will be smaller in quantity than traditional traffic, but more qualified, since those who click from an AI usually have a clear intention to go deeper.
It is important that these aspects are taken into account when setting growth objectives on an open data platform.
-
Algorithmic Reuse: Using Data in Models and Applications
Open data powers AI models, predictive systems, and automated applications. Knowing which sources have been used for their training would also be a way to know their impact. However, few solutions directly provide this information. The European Union is working to promote transparency in this field, with measures such as the template for documenting training data for general-purpose models, but its implementation – and the existence of exceptions to its compliance – mean that knowledge is still limited.
Measuring the increase in access to data through APIs could give an idea of its use in applications to power intelligent systems. However, the greatest potential in this field lies in collaboration with companies, universities and developers immersed in these projects, so that they offer a more realistic view of the impact.
Conclusion: Measure what matters, not just what's easy to measure
A drop in web traffic doesn't mean a drop in impact. It means a change in the way information circulates. Open data platforms must evolve towards metrics that reflect algorithmic visibility, automated reuse, and integration into AI models.
This doesn't mean that traditional metrics should disappear. Knowing the accesses to the website, the most visited or the most downloaded datasets continues to be invaluable information to know the impact of the data provided through open platforms. And it is also essential to monitor the use of data when generating or enriching products and services, including artificial intelligence systems. In the age of AI, success is no longer measured only by how many users visit a platform, but also by how many intelligent systems depend on its information and the visibility that this provides.
Therefore, integrating these new metrics alongside traditional indicators through a web analytics and SEO strategy * allows for a more complete view of the real impact of open data. This way we will be able to know how our information circulates, how it is reused and what role it plays in the digital ecosystem that shapes society today.
*SEO (Search Engine Optimization) is the set of techniques and strategies aimed at improving the visibility of a website in search engines.
Noticia
Spain once again stands out in the European open data landscape. The Open Data Maturity 2025 report places our country among the leaders in the opening and reuse of public sector information, consolidating an upward trajectory in digital innovation.
The report, produced annually by the European data portal, data.europa.eu, assesses the degree of maturity of open data in Europe. To do this, it analyzes several indicators, grouped into four dimensions: policy, portal, quality and impact. This year's edition has involved 36 countries, including the 27 Member States of the European Union (EU), three European Free Trade Association countries (Iceland, Norway and Switzerland) and six candidate countries (Albania, Bosnia and Herzegovina, Montenegro, North Macedonia, Serbia and Ukraine).
This year, Spain is in fifth position among the countries of the European Union and sixth out of the total number of countries analysed, tied with Italy. Specifically, a total score of 95.6% was obtained, well above the average of the countries analysed (81.1%). With this data, Spain improves its score compared to 2024, when it obtained 94.8%.
Spain, among the European leaders
With this position, Spain is once again among the countries that prescribe open data (trendsetters), i.e. those that set trends and serve as an example of good practices to other States. Spain shares a group with France, Lithuania, Poland, Ukraine, Ireland, the aforementioned Italy, Slovakia, Cyprus, Portugal, Estonia and the Czech Republic.
The countries in this group have advanced open data policies, aligned with the technical and political progress of the European Union, including the publication of high-value datasets. In addition, there is strong coordination of open data initiatives at all levels of government. Its national portals offer comprehensive features and quality metadata, with few limitations on publication or use. This means that published data can be more easily reused for multiple purposes, helping to generate a positive impact in different areas.
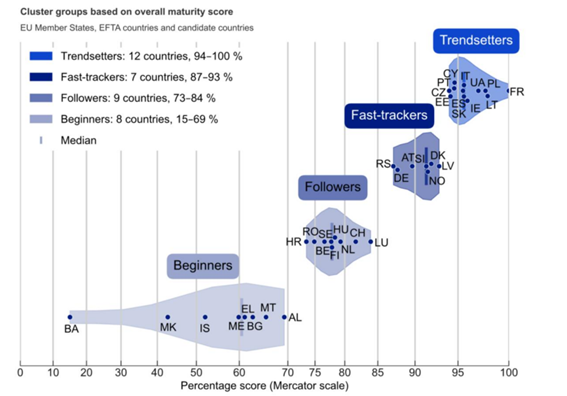
Figure 1. Member countries of the different clusters.
The keys to Spain's progress
According to the report, Spain strengthened its leadership in open data through strategic policy development, technical modernization, and reuse-driven innovation. In particular, improvements in the political sphere are what have boosted Spain's growth:
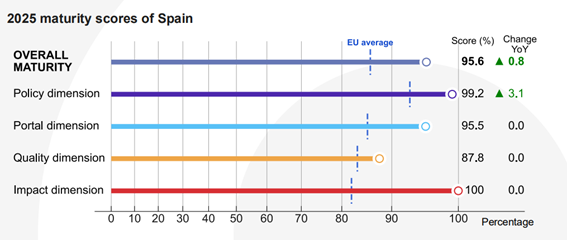
Figure 2. Spain's score in the different dimensions together with growth over the previous year.
As shown in the image, the political dimension has reached a score of 99.2% compared to 96% last year, standing out from the European average of 93.1%. The reason for this growth is the progress in the regulatory framework. In this regard, the report highlights the configuration of the V Open Government Plan, developed through a co-creation process in which all stakeholders participated. This plan has introduced new initiatives related to the governance and reuse of open data. Another noteworthy issue is that Spain promoted the publication of high-value datasets, in line with Implementing Regulation (EU) 2023/138.
The rest of the dimensions remain stable, all of them with scores above the European average: in the portal dimension, 95.5% has been obtained compared to 85.45% in Europe, while the quality dimension has been valued with 87.8% compared to 83.4% in the rest of the countries analysed. The Impact block continues to be our great asset, with 100% compared to 82.1% in Europe. In this dimension, we continue to position ourselves as great leaders, thanks to a clear definition of reuse, the systematic measurement of data use and the existence of examples of impact in the governmental, social, environmental and economic spheres.
Although there have not been major movements in the score of these dimensions, the report does highlight milestones in Spain in all areas. For example, the datos.gob.es platform underwent a major redesign, including adjustments to the DCAT-AP-ES metadata profile, in order to improve quality and interoperability. In this regard, a specific implementation guide was published and a learning and development community was consolidated through GitHub. In addition, the portal's search engine and monitoring tools were improved, including tracking external reuse through GitHub references and rich analytics through interactive dashboards.
The involvement of the infomediary sector has been key in strengthening Spain's leadership in open data. The report highlights the importance of activities such as the National Open Data Meeting, with challenges that are worked on jointly by a multidisciplinary team with representatives of public, private and academic institutions, edition after edition. In addition, the Spanish Federation of Municipalities and Provinces identified 80 essential data sets on which local governments should focus when advancing in the opening of information, promoting coherence and reuse at the municipal level.
The following image shows the specific score for each of the subdimensions analyzed:
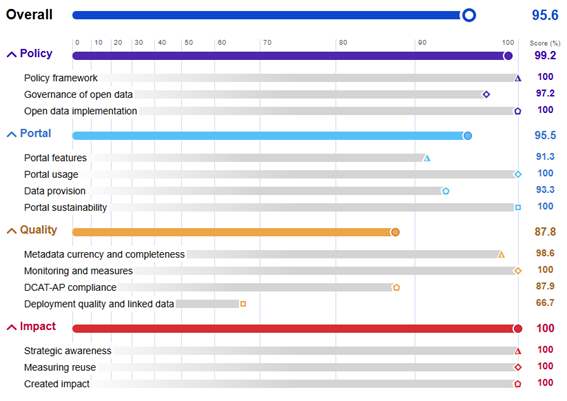
Figure 3. Spain's score in the different dimensions and subcategories.
You can see the details of the report for Spain on the website of the European portal.
Next steps and common challenges
The report concludes with a series of specific recommendations for each group of countries. For the group of trendsetters, in which Spain is located, the recommendations are not so much focused on reaching maturity – already achieved – but on deepening and expanding their role as European benchmarks. Some of the recommendations are:
- Consolidate thematic ecosystems (supplier and reuser communities) and prioritize high-value data in a systematic way.
- Align local action with the national strategy, enabling "data-driven" policies.
- Cooperate with data.europa.eu and other countries to implement and adapt an impact assessment framework with domain-by-domain metrics.
- Develop user profiles and allow their contributions to the national portal.
- Improve data and metadata quality and localization through validation tools, artificial intelligence, and user-centric flows.
- Apply domain-specific standards to harmonize datasets and maximize interoperability, quality, and reusability.
- Offer advanced and certified training in regulations and data literacy.
- Collaborate internationally on reusable solutions, such as shared or open source software.
Spain is already working on many of these points to continue improving its open data offer. The aim is for more and more reusers to be able to easily take advantage of the potential of public information to generate services and solutions that generate a positive impact on society as a whole.
The position achieved by Spain in this European ranking is the result of the work of all public initiatives, companies, user communities and reusers linked to open data, which promote an ecosystem that does not stop growing. Thank you for the effort!
Noticia
On 19 November, the European Commission presented the Data Union Strategy, a roadmap that seeks to consolidate a robust, secure and competitive European data ecosystem. This strategy is built around three key pillars: expanding access to quality data for artificial intelligence and innovation, simplifying the existing regulatory framework, and protecting European digital sovereignty. In this post, we will explain each of these pillars in detail, as well as the implementation timeline of the plan planned for the next two years.
Pillar 1: Expanding access to quality data for AI and innovation
The first pillar of the strategy focuses on ensuring that companies, researchers and public administrations have access to high-quality data that allows the development of innovative applications, especially in the field of artificial intelligence. To this end, the Commission proposes a number of interconnected initiatives ranging from the creation of infrastructure to the development of standards and technical enablers. A series of actions are established as part of this pillar: the expansion of common European data spaces, the development of data labs, the promotion of the Cloud and AI Development Act, the expansion of strategic data assets and the development of facilitators to implement these measures.
1.1 Extension of the Common European Data Spaces (ECSs)
Common European Data Spaces are one of the central elements of this strategy:
-
Planned investment: 100 million euros for its deployment.
-
Priority sectors: health, mobility, energy, (legal) public administration and environment.
-
Interoperability: SIMPL is committed to interoperability between data spaces with the support of the European Data Spaces Support Center (DSSC).
-
Key Applications:
-
European Health Data Space (EHDS): Special mention for its role as a bridge between health data systems and the development of AI.
-
New Defence Data Space: for the development of state-of-the-art systems, coordinated by the European Defence Agency.
-
1.2 Data Labs: the new ecosystem for connecting data and AI development
The strategy proposes to use Data Labs as points of connection between the development of artificial intelligence and European data.
These labs employ data pooling, a process of combining and sharing public and restricted data from multiple sources in a centralized repository or shared environment. All this facilitates access and use of information. Specifically, the services offered by Data Labs are:
-
Makes it easy to access data.
-
Technical infrastructure and tools.
-
Data pooling.
-
Data filtering and labeling
-
Regulatory guidance and training.
-
Bridging the gap between data spaces and AI ecosystems.
Implementation plan:
-
First phase: the first Data Labs will be established within the framework of AI Factories (AI gigafactories), offering data services to connect AI development with European data spaces.
-
Sectoral Data Labs: will be established independently in other areas to cover specific needs, for example, in the energy sector.
-
Self-sustaining model: It is envisaged that the Data Labs model can be deployed commercially, making it a self-sustaining ecosystem that connects data and AI.
1.3 Cloud and AI Development Act: boosting the sovereign cloud
To promote cloud technology, the Commission will propose this new regulation in the first quarter of 2026. There is currently an open public consultation in which you can participate here.
1.4 Strategic data assets: public sector, scientific, cultural and linguistic resources
On the one hand, in 2026 it will be proposed to expand the list of high-value data in English or HVDS to include legal, judicial and administrative data, among others. And on the other hand, the Commission will map existing bases and finance new digital infrastructure.
1.5 Horizontal enablers: synthetic data, data pooling, and standards
The European Commission will develop guidelines and standards on synthetic data and advanced R+D in techniques for its generation will be funded through Horizon Europe.
Another issue that the EU wants to promote is data pooling, as we explained above. Sharing data from early stages of the production cycle can generate collective benefits, but barriers persist due to legal uncertainty and fear of violating competition rules. Its purpose? Make data pooling a reliable and legally secure option to accelerate progress in critical sectors.
Finally, in terms of standardisation, the European standardisation organisations (CEN/CENELEC) will be asked to develop new technical standards in two key areas: data quality and labelling. These standards will make it possible to establish common criteria on how data should be to ensure its reliability and how it should be labelled to facilitate its identification and use in different contexts.
Pillar 2: Regulatory simplification
The second pillar addresses one of the challenges most highlighted by companies and organisations: the complexity of the European regulatory framework on data. The strategy proposes a series of measures aimed at simplifying and consolidating existing legislation.
2.1 Derogations and regulatory consolidation: towards a more coherent framework
The aim is to eliminate regulations whose functions are already covered by more recent legislation, thus avoiding duplication and contradictions. Firstly, the Free Flow of Non-Personal Data Regulation (FFoNPD) will be repealed, as its functions are now covered by the Data Act. However, the prohibition of unjustified data localisation, a fundamental principle for the Digital Single Market, will be explicitly preserved.
Similarly, the Data Governance Act (European Data Governance Regulation or DGA) will be eliminated as a stand-alone rule, migrating its essential provisions to the Data Act. This move simplifies the regulatory framework and also eases the administrative burden: obligations for data intermediaries will become lighter and more voluntary.
As for the public sector, the strategy proposes an important consolidation. The rules on public data sharing, currently dispersed between the DGA and the Open Data Directive, will be merged into a single chapter within the Data Act. This unification will facilitate both the application and the understanding of the legal framework by public administrations.
2.2 Cookie reform: balancing protection and usability
Another relevant detail is the regulation of cookies, which will undergo a significant modernization, being integrated into the framework of the General Data Protection Regulation (GDPR). The reform seeks a balance: on the one hand, low-risk uses that currently generate legal uncertainty will be legalized; on the other, consent banners will be simplified through "one-click" systems. The goal is clear: to reduce the so-called "user fatigue" in the face of the repetitive requests for consent that we all know when browsing the Internet.
2.3 Adjustments to the GDPR to facilitate AI development
The General Data Protection Regulation will also be subject to a targeted reform, specifically designed to release data responsibly for the benefit of the development of artificial intelligence. This surgical intervention addresses three specific aspects:
-
It clarifies when legitimate interest for AI model training may apply.
-
It defines more precisely the distinction between anonymised and pseudonymised data, especially in relation to the risk of re-identification.
-
It harmonises data protection impact assessments, facilitating their consistent application across the Union.
2. 4 Implementation and Support for the Data Act
The recently approved Data Act will be subject to adjustments to improve its application. On the one hand, the scope of business-to-government ( B2G) data sharing is refined, strictly limiting it to emergency situations. On the other hand, the umbrella of protection is extended: the favourable conditions currently enjoyed by small and medium-sized enterprises (SMEs) will also be extended to medium-sized companies or small mid-caps, those with between 250 and 749 employees.
To facilitate the practical implementation of the standard, a model contractual clause for data exchange has already been published , thus providing a template that organizations can use directly. In addition, two additional guides will be published during the first quarter of 2026: one on the concept of "reasonable compensation" in data exchanges, and another aimed at clarifying the key definitions of the Data Act that may generate interpretative doubts.
Aware that SMEs may struggle to navigate this new legal framework, a Legal Helpdesk will be set up in the fourth quarter of 2025. This helpdesk will provide direct advice on the implementation of the Data Act, giving priority precisely to small and medium-sized enterprises that lack specialised legal departments.
2.5 Evolving governance: towards a more coordinated ecosystem
The governance architecture of the European data ecosystem is also undergoing significant changes. The European Data Innovation Board (EDIB) evolves from a primarily advisory body to a forum for more technical and strategic discussions, bringing together both Member States and industry representatives. To this end, its articles will be modified with two objectives: to allow the inclusion of the competent authorities in the debates on Data Act, and to provide greater flexibility to the European Commission in the composition and operation of the body.
In addition, two additional mechanisms of feedback and anticipation are articulated. The Apply AI Alliance will channel sectoral feedback, collecting the specific experiences and needs of each industry. For its part, the AI Observatory will act as a trend radar, identifying emerging developments in the field of artificial intelligence and translating them into public policy recommendations. In this way, a virtuous circle is closed where politics is constantly nourished by the reality of the field.
Pillar 3: Protecting European data sovereignty
The third pillar focuses on ensuring that European data is treated fairly and securely, both inside and outside the Union's borders. The intention is that data will only be shared with countries with the same regulatory vision.
3.1 Specific measures to protect European data
-
Publication of guides to assess the fair treatment of EU data abroad (Q2 2026):
-
Publication of the Unfair Practices Toolbox (Q2 2026):
-
Unjustified location.
-
Exclusion.
-
Weak safeguards.
-
The data leak.
-
-
Taking measures to protect sensitive non-personal data.
All these measures are planned to be implemented from the last quarter of 2025 and throughout 2026 in a progressive deployment that will allow a gradual and coordinated adoption of the different measures, as established in the Data Union Strategy.
In short, the Data Union Strategy represents a comprehensive effort to consolidate European leadership in the data economy. To this end, data pooling and data spaces in the Member States will be promoted, Data Labs and AI gigafactories will be committed to and regulatory simplification will be encouraged.
Noticia
The European open data portal has published the third volume of its Use Case Observatory, a report that compiles the evolution of data reuse projects across Europe. This initiative highlights the progress made in four areas: economic, governmental, social and environmental impact.
The closure of a three-year investigation
Between 2022 and 2025, the European Open Data Portal has systematically monitored the evolution of various European projects. The research began with an initial selection of 30 representative initiatives, which were analyzed in depth to identify their potential for impact.
After two years, 13 projects continued in the study, including three Spanish ones: Planttes, Tangible Data and UniversiDATA-Lab. Its development over time was studied to understand how the reuse of open data can generate real and sustainable benefits.
The publication of volume III in October 2025 marks the closure of this series of reports, following volume I (2022) and volume II (2024). This last document offers a longitudinal view, showing how the projects have matured in three years of observation and what concrete impacts they have generated in their respective contexts.
Common conclusions
This third and final report compiles a number of key findings:
Economic impact
Open data drives growth and efficiency across industries. They contribute to job creation, both directly and indirectly, facilitate smarter recruitment processes and stimulate innovation in areas such as urban planning and digital services.
The report shows the example of:
- Naar Jobs (Belgium): an application for job search close to users' homes and focused on the available transport options.
This application demonstrates how open data can become a driver for regional employment and business development.
Government impact
The opening of data strengthens transparency, accountability and citizen participation.
Two use cases analysed belong to this field:
- Waar is mijn stemlokaal? (Netherlands): platform for the search for polling stations.
- Statsregnskapet.no (Norway): website to visualize government revenues and expenditures.
Both examples show how access to public information empowers citizens, enriches the work of the media, and supports evidence-based policymaking. All of this helps to strengthen democratic processes and trust in institutions.
Social impact
Open data promotes inclusion, collaboration, and well-being.
The following initiatives analysed belong to this field:
- UniversiDATA-Lab (Spain): university data repository that facilitates analytical applications.
- VisImE-360 (Italy): a tool to map visual impairment and guide health resources.
- Tangible Data (Spain): a company focused on making physical sculptures that turn data into accessible experiences.
- EU Twinnings (Netherlands): platform that compares European regions to find "twin cities"
- Open Food Facts (France): collaborative database on food products.
- Integreat (Germany): application that centralizes public information to support the integration of migrants.
All of them show how data-driven solutions can amplify the voice of vulnerable groups, improve health outcomes and open up new educational opportunities. Even the smallest effects, such as improvement in a single person's life, can prove significant and long-lasting.
Environmental impact
Open data acts as a powerful enabler of sustainability.
As with environmental impact, in this area we find a large number of use cases:
- Digital Forest Dryads (Estonia): a project that uses data to monitor forests and promote their conservation.
- Air Quality in Cyprus (Cyprus): platform that reports on air quality and supports environmental policies.
- Planttes (Spain): citizen science app that helps people with pollen allergies by tracking plant phenology.
- Environ-Mate (Ireland): a tool that promotes sustainable habits and ecological awareness.
These initiatives highlight how data reuse contributes to raising awareness, driving behavioural change and enabling targeted interventions to protect ecosystems and strengthen climate resilience.
Volume III also points to common challenges: the need for sustainable financing, the importance of combining institutional data with citizen-generated data, and the desirability of involving end-users throughout the project lifecycle. In addition, it underlines the importance of European collaboration and transnational interoperability to scale impact.
Overall, the report reinforces the relevance of continuing to invest in open data ecosystems as a key tool to address societal challenges and promote inclusive transformation.
The impact of Spanish projects on the reuse of open data
As we have mentioned, three of the use cases analysed in the Use Case Observatory have a Spanish stamp. These initiatives stand out for their ability to combine technological innovation with social and environmental impact, and highlight Spain 's relevance within the European open data ecosystem. His career demonstrates how our country actively contributes to transforming data into solutions that improve people's lives and reinforce sustainability and inclusion. Below, we zoom in on what the report says about them.
This citizen science initiative helps people with pollen allergies through real-time information about allergenic plants in bloom. Since its appearance in Volume I of the Use Case Observatory, it has evolved as a participatory platform in which users contribute photos and phenological data to create a personalized risk map. This participatory model has made it possible to maintain a constant flow of information validated by researchers and to offer increasingly complete maps. With more than 1,000 initial downloads and about 65,000 annual visitors to its website, it is a useful tool for people with allergies, educators and researchers.
The project has strengthened its digital presence, with increasing visibility thanks to the support of institutions such as the Autonomous University of Barcelona and the University of Granada, in addition to the promotion carried out by the company Thigis.
Its challenges include expanding geographical coverage beyond Catalonia and Granada and sustaining data participation and validation. Therefore, looking to the future, it seeks to extend its territorial reach, strengthen collaboration with schools and communities, integrate more data in real time and improve its predictive capabilities.
Throughout this time, Planttes has established herself as an example of how citizen-driven science can improve public health and environmental awareness, demonstrating the value of citizen science in environmental education, allergy management, and climate change monitoring.
The project transforms datasets into physical sculptures that represent global challenges such as climate change or poverty, integrating QR codes and NFC to contextualize the information. Recognized at the EU Open Data Days 2025, Tangible Data has inaugurated its installation Tangible climate at the National Museum of Natural Sciences in Madrid.
Tangible Data has evolved in three years from a prototype project based on 3D sculptures to visualize sustainability data to become an educational and cultural platform that connects open data with society. Volume III of the Use Case Observatory reflects its expansion into schools and museums, the creation of an educational program for 15-year-old students, and the development of interactive experiences with artificial intelligence, consolidating its commitment to accessibility and social impact.
Its challenges include funding and scaling up the education programme, while its future goals include scaling up school activities, displaying large-format sculptures in public spaces, and strengthening collaboration with artists and museums. Overall, it remains true to its mission of making data tangible, inclusive, and actionable.
UniversiDATA-Lab is a dynamic repository of analytical applications based on open data from Spanish universities, created in 2020 as a public-private collaboration and currently made up of six institutions. Its unified infrastructure facilitates the publication and reuse of data in standardized formats, reducing barriers and allowing students, researchers, companies and citizens to access useful information for education, research and decision-making.
Over the past three years, the project has grown from a prototype to a consolidated platform, with active applications such as the budget and retirement viewer, and a hiring viewer in beta. In addition, it organizes a periodic datathon that promotes innovation and projects with social impact.
Its challenges include internal resistance at some universities and the complex anonymization of sensitive data, although it has responded with robust protocols and a focus on transparency. Looking to the future, it seeks to expand its catalogue, add new universities and launch applications on emerging issues such as school dropouts, teacher diversity or sustainability, aspiring to become a European benchmark in the reuse of open data in higher education.
Conclusion
In conclusion, the third volume of the Use Case Observatory confirms that open data has established itself as a key tool to boost innovation, transparency and sustainability in Europe. The projects analysed – and in particular the Spanish initiatives Planttes, Tangible Data and UniversiDATA-Lab – demonstrate that the reuse of public information can translate into concrete benefits for citizens, education, research and the environment.
Noticia
The European data portal, data.europa.eu, has published the Open Data Maturity Index 2024, an annual report that assesses the level of open data maturity of European countries.
The 34 participating countries, including the 27 EU Member States, four candidate countries (Bosnia and Herzegovina, Albania, Serbia and Ukraine) and three European Free Trade Association countries (Iceland, Norway and Switzerland) were surveyed.
In this year's edition, Spain obtains an overall rating of 95% out of 100%. This places it in sixth place overall. As reflected in the following image, for yet another year, Spain is in the group of so-called trendsetter countries (trendsetter) , which are those with the best scores in the ranking, and which also include France, Poland, Ukraine, Slovakia, Ireland, Lithuania, Czech Republic, Italy, Estonia and Cyprus.

Figure 1: Groups of participating countries according to their overall open data maturity score.
Above the EU27 average in all four dimensions analysed
The Policy Dimension, focusing on open data policies in different countries, analyses the existence of national governance models for open data management and the measures that have been put in place to implement existing strategies. In these aspects, Spain scored 96% compared to the European average of 91%. The most positive aspects identified are:
- Alignment with European policies: The report highlights that Spain is fully aligned with the European Open Data Directive, among other recent data-related regulations that have come into force.
- Well-defined action plans: It highlights the strategies deployed in different public administrations focused on incentivising the publication and re-use of data generated in real time and data from citizens.
- Strengthening competences: It focuses on how Spain has developed training programmes to improve the skills of civil servants in managing and publishing open data, ensuring quality standards and fostering a data culture in public administration.
The Impact Dimension analyses the activities carried out to monitor and measure both the re-use of open data, and the impact created as a result of this re-use. Year after year, this has been the least mature dimension in Europe. Thus, compared to an EU average of 80%, Spain obtains a score of 100% for the development of numerous actions, among which the following stand out:
- Multi-sectoral collaboration: The report highlights how our country is presented as an example of interaction between public administrations, private companies and civil society, materialized in examples such as the close ties between the public sector and the Multisectoral Association of Information (ASEDIE), which produces year after year the ASEDIE report on the reuse of public sector information.
- Examples of re-use in key sectors: It shows how Spain has promoted numerous cases of open data reuse in strategic areas such as the environment, mobility and energy.
- Innovation in communication: The document highlights the effort invested in innovative communication strategies to raise public awareness of the value of data, and especially young audiences. Also noteworthy is the production of podcasts featuring interviews with open data experts, accompanied by short promotional videos.
The Portal Dimension focuses on analysing the functionalities of the national platform to enableusers to access open data and interact within the community. With 96% compared to 82% in the EU27, Spain is positioned as one of the European benchmarks in improving user experience and optimising national portals. The highlights of the report are:
- Sustainability and continuous improvement: According to the report, Spain has demonstrated a strong commitment to the sustainability of the national open data platform (datos.gob.es) and its adaptation to new technological demands.
- Interaction with users: One of the great strengths is the active promotion from the platform of the datasets available and of the channels through which users can request data that are not available in the National Catalogue.
Finally, the Quality Dimension examines the mechanisms for ensuring the quality of (meta)data. Here Spain scores 88% compared to 79% in the EU. Spain continues to stand out with initiatives that ensure the reliability, accessibility and standardisation of open data. Some of the strengths highlighted in the report are:
- Metadata automation: It highlights the use of advanced techniques for automatic metadata collection, reducing reliance on manual processes and improving accuracy and real-time updating.
- Guidelines for data and metadata quality: Spain provides many practical guidelines to improve the publication and quality of open data, including anonymisation techniques, publication in tabular formats (CSV) and the use of APIs.
Continuing to innovate to maintain Spain's advanced position in open data maturity
While Spain continues to stand out in the EU thanks to its open data ecosystem, efforts must continue. To this end, the same report identifies lines of work for countries, such as Spain, that seek to maintain their advanced position in open data maturity and to continue innovating. Among others, the following recommendations are made:
- Consolidating open data ecosystems: Strengthen thematic communities of providers and re-users by prioritising High Value Datasets (HVDs) in their development and promotion.
- Promoting coordination: Align the national strategy with the needs of agencies and local authorities.
- Develop country-specific impact metrics: Collaborate with universities, research institutions and others to develop impact assessment frameworks.
- Measure and disseminate the impact of open data: Conduct regular (annual or biannual) assessments of the economic, environmental and social impact of open data, promoting the results to generate political support.
- Facilitate the participation of the open data community: Ensure that providers improve the publication of data based on user feedback and ratings.
- Increase the quality of data and metadata: Use automated tools and validations to improve publication standards, including adopting artificial intelligence technology to optimise metadata quality.
- Promote successful reuse cases: Publish and promote success stories in the use of open data, interact with providers and users to identify innovative needs and applications.
Overall, the report shows good progress on open data across Europe. Although there are areas for improvement, the European open data landscape is consolidating, with Spain at the top of the table. Read here the complete Open Data Maturity Index 2024.
Blog
The transformative potential of open data initiatives is now widely recognised as they offer opportunities for fostering innovation, greater transparency and improved efficiency in many processes. However, reliable measurement of the real impact of these initiatives is difficult to obtain.
From this same space we have also raised on more than one occasion the recurring question of what would be the best way to measure the impact of open data, we have reviewed different methods and best practices to try to quantify it, as well as to analyse it through detailed use cases or the specific impact on specific topics and sectors such as employment, geographic data, transport or sustainable development objectives. Now, thanks to the report "Indicators for Open Data Impact Assessment" by the data.europa.eu team, we have a new resource to not only understand but also be able to amplify the impact of open data initiatives by designing the right indicators. This publication will provide a quick analysis of the importance of these indicators and also briefly explain how they can be used to maximise the potential of open data.
Understanding open data and its value chain
Open data refers to the practice of making data available to the public in a way that makes it freely accessible and usable. Beyond ensuring simple availability, the real value of open data lies in its use in various domains, fostering economic growth, improving public sector transparency and driving social innovation. However, quantifying the real impact of data openness poses significant challenges due to the multiple ways in which data is used and the wide-ranging implications it can have for society.
To understand the impact of open data, we must first understand its value chain, which will provide us with a structured and appropriate framework for transforming raw data into actionable insights. This chain includes four main stages that form a continuous process from the initial production to the final use of the data:
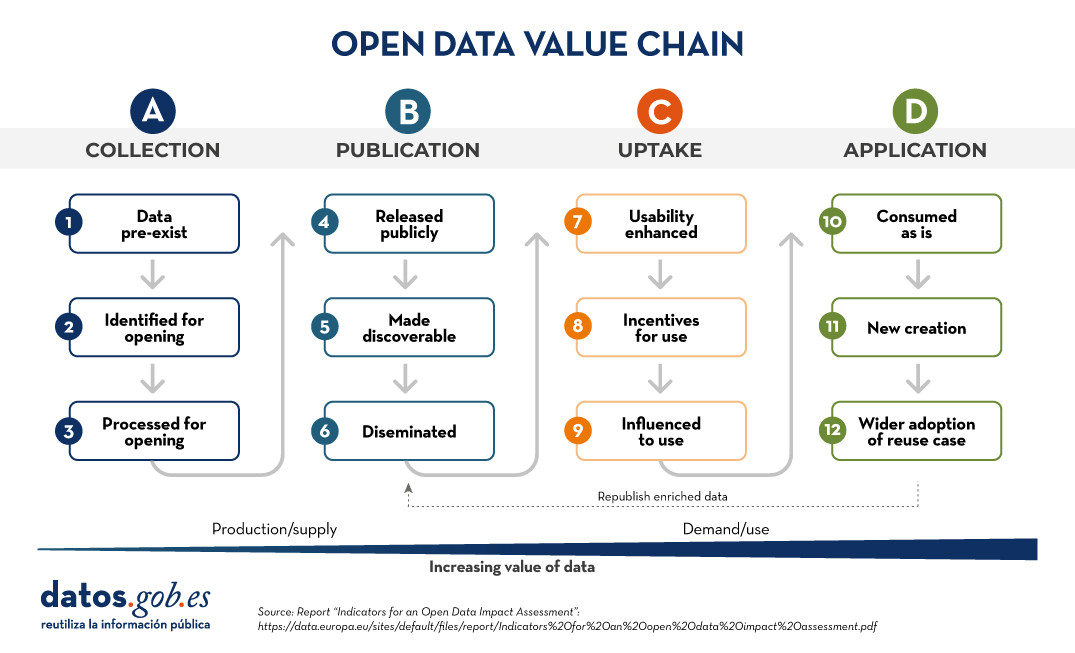
Figure 1: Open Data Value Chain
- Collection: this consists of identifying existing data and establishing the necessary procedures for their cataloguing.
- Publication: making data available in an accessible form and easy to locate.
- Uptake:will come sooner when data is easy to use and accompanied by the right incentives to use it.
- Application:either through direct consumption of the data or through some transformation that adds new value to the initial data.
Each of these steps will play a critical role in contributing to the overall effectiveness and value derived from open data. The indicators developed to assess the impact of open data will also be closely linked to each of these stages, providing a holistic view of how data is transformed from simple information into a powerful tool for development.
Indicators for impact assessment
The report introduces a set of robust indicators that are specifically designed to monitor open data initiatives through their outputs, outcomes and impact as a result of their value chain. These indicators should not be seen as simple metrics, but as tools to help us understand the effectiveness of open data initiatives and make strategic improvements. Let us look at these indicators in a little more detail:
-
Output indicators: are those that focus on measuring the immediate results that come from making open data available. Examples would be the number of datasets released, the frequency of dataset updates , the number of visitors to the data catalogue, the accessibility of the data across various platforms, or even the efforts made to promote the data and increase its visibility. Output indicators help us to assess the efficiency of data publication and dissemination processes and are generally easy to measure, although they will only give a fairly superficial measure of impact.
-
Indicators of effect: Outcome indicators measure the short- and medium-term consequences of open data. These indicators are crucial to understand how open data influences decision-makingprocesses, leads to the development of new applications or improves government transparency. Thus, improved public transport planning based on usage data, increased citizen participation in the development of public policies to tackle climate change brought about by the increased availability of data and information, or improved productivity of public services through the use of data can be considered as significant examples of outcome indicators.
- Impact indicators: This is the deepest level of measurement, as impact indicators assess the broader, long-term effects of open data. These indicators may include economic benefits such as job creation or GDP growth, social impacts such as improved trust in public entities, or even environmental impacts such as the effective reduction of greenhouse gases. At this level, indicators are much more complex and specific, and should therefore be defined for each specific domain to be analysed and also according to the objectives set within that domain.
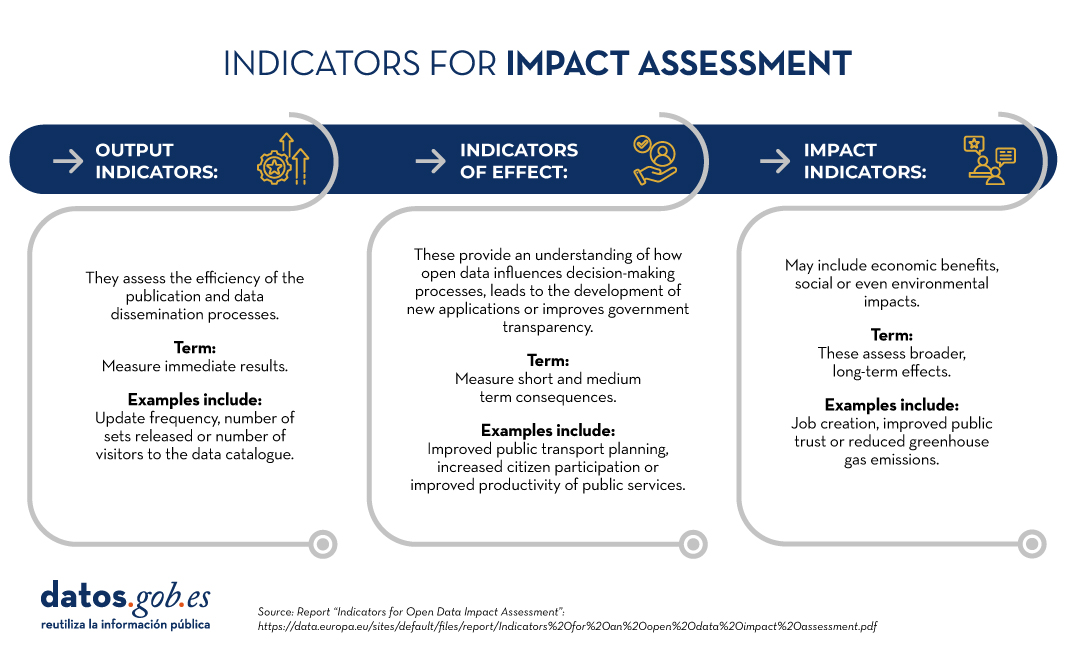
Figure 2: Indicators for impact assessmen
Implementing these indicators in practice will require the implementation of a robust methodological framework that can capture and analyse data from a variety of sources. It is recommended to combine automated and survey-based data collection methods to collect more comprehensive data. This type of dual approach allows for capturing quantitative data through automated systems while also incorporating qualitative insights through user feedback and more in-depth use case analysis.
Looking to the future
The future of open data impact assessment looks towards refining the indicators used for measurement and consolidating them through the use of interactive monitoring tools. Such tools would enable the possibility of a more continuous assessment that would provide real-time information on how open data is being used and its effects in different sectors. In addition, the development of standardised metrics for these indicators would facilitate comparative analysis across regions and over time, further improving the overall understanding of the impact of open data.
Another important factor to take into account are possible privacy and ethical considerations applicable to the selected indicators. As in any other data-centric initiative, privacy and data protection considerations will be paramount and mandatory for the indicators developed. However, once we get into its use by users, it could lead to more delicate situations. Generally, this should not be a particularly problematic issue when monitoring data. However, once we get into its use by users, it could lead to more delicate situations. Ensuring anonymity in indicators and secure practices in their management is also crucial to maintaining trust and integrity in open data processes.
In conclusion, the development and implementation of specific detailed indicators following the recommendations of the report"Indicators for an Open Data Impact Assessment" would be a significant step forward in terms of how we measure and understand the impact of open data.Continuous refinement and adaptation of these indicators will also be crucial as they evolve in tandem with the open data strategies they accompany and their growing sphere of influence. In the medium term the European Commission will further develop its analysis in this area of work through the data.europa.eu project with the ultimate goal of being able to formulate a common methodology for the assessment of the impact of the re-use of public data and to develop an interactive monitoring tool for its implementation.
Content prepared by Carlos Iglesias, Open data Researcher and consultant, World Wide Web Foundation. The contents and views expressed in this publication are the sole responsibility of the author.
Blog
Geographic data allow us to learn about the world around us. From locating optimal travel routes to monitoring natural ecosystems, from urban planning and development to emergency management, geographic data has great potential to drive development and efficiency in multiple economic and social areas. They are therefore considered high-value datasets by the European Commission, and have a specific obligations to make their publication accessible and interoperable.
In order to understand the real impact of this type of data, several reports and studies have been carried out. The following are several of them, which address the challenge of measuring the impact of geographic information.
Geospatial data in the Ministry of Transport and Sustainable Mobility. Impact of information co-produced by IGN and CNIG (2024)
- You can read the full report here.
This report, produced by ASEDIE and CNIG, aims to draw conclusions about the use and perception of the services co-produced by National Geographic Institute (IGN) and National Centre for Geographic Information (CNIG) in order to understand the benefit they bring to the daily activity of the companies that use them and to society. For this purpose, a survey was carried out among companies using geospatial data, thanks to which a classification of companies reusing geographic data could be drawn up.
Of the 170 companies considered, 70.0% are self-employed and micro-enterprises (less than 10 employees). These companies are mainly located in the Community of Madrid (25.6%), Catalonia (16.3%), Andalusia (14%), Valencia (11.6%) and Castilla y León (11.6%). 53.3% claim to reuse data from Spatial Data Infrastructures (SDI) and 51% open data from INE, among others. The most used products are orthophotos and satellite images (74%), followed by vector maps and cartographic and topographic databases (63%), and LiDAR (58%).
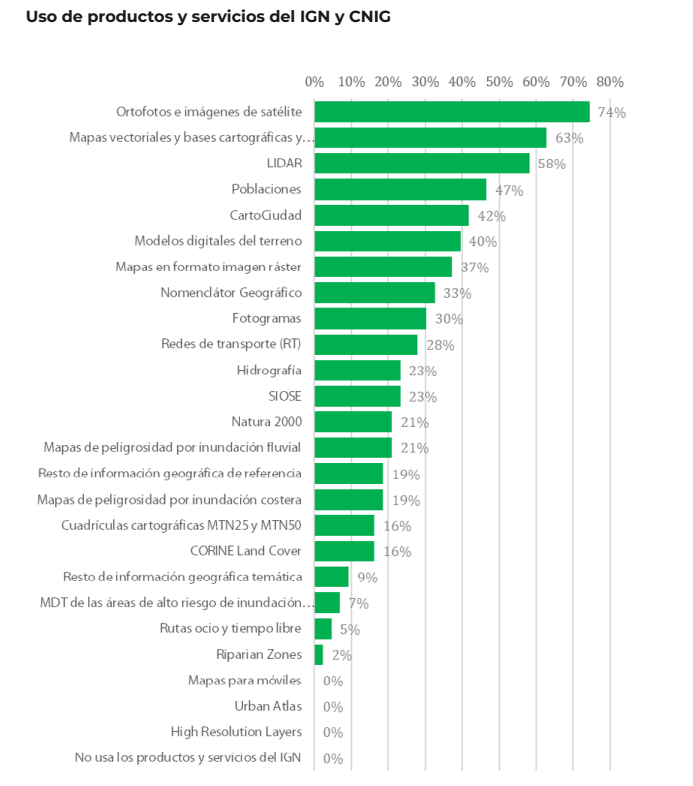
In terms of economic impact, the report estimates an average impact of 35.7% on the sales of the companies surveyed. Specifically, open geographic information from the IGN and CNIG account for an impact of 12.4% of sales.
The report also includes the analysis of collected use cases, as well as in-depth interviews with companies in the sector as examples of best practices and, on the other hand, updates the information from Asedie's annual report on the Data Economy in its 2023 infomediary scope with respect to the economic data of the geographic subsector.
Economic benefits of the SDI central node by CNIG and University of Leuven (2021)
- You can read the full report here.
This document develops and tests a methodology for estimating the economic benefits generated by the Spanish Spatial Data Infrastructure (IDEE), which establishes the publication and accessibility of spatial data through free geographic web services for viewing and downloading produced by cartographic, environmental, cadastral and land observation organisations at national, regional and local level since 2004, in accordance with norms, standards and recommendations that guarantee their interoperability.
The study was to answer the question of what would happen if the NSDI were to disappear. For the study, only the central node of the NSDIE was considered, understanding as such the geographic services and data co-produced among the partners of the National Cartographic System, and focusing on web map services (WMS) and map tiles (WMTS). The nodes of ministries, autonomous communities and local entities were not part of its scope.
Two investigation paths were used to carry out the calculation:
- Comparison with the costs of using Google Maps. The application of the different scenarios led to a profit/value of the 6 WMTS and 13 WMS of minimum 355,646 and maximum 891,144 euros.
- Comparison with other countries' charges for the use of their data and services. Despite the difficulties in calculating the rate per application, due to the existence of different approaches in each country, the total value of the FDIE was estimated at between 34,000 and 14 million euros.
This report joins others produced by the NSDI, such as these documents to estimate the average cost of metadata generation or the implementation of visualisation and download services for Inspire-compliant datasets, both carried out in 2019.
In order to allow other organisations to adapt the study to their particularities, an Excel file has been created, as a calculator, with the following calculation template.
ICEARAGON and ARAGEA Performance Report by the Government of Aragon (2024)
- You can read the full report here.
Regional governments are also interested in knowing the impact of their geographic information services. This is the case of the Government of Aragon, which recently presented a report on the performance of the Spatial Knowledge Infrastructure of Aragon (ICEARAGON) and the Active Geodesy Network of Aragon (AREAGA).
In total, these services are estimated to have saved almost two million euros for all Aragonese citizens by 2023. According to the report, ICEARAGÓN received almost 5 million visits in 2023, an increase of 58.6% over 2022. These users made 1.7 million downloads. Most of the information downloaded (47.8%) refers to environmental layers. Information on administrative boundaries (13.8%) and maps of Aragon (13.4%) were also very successful. Regarding the user profile, 71% are from the surveying field and 27% belong to the agricultural sector.
These reports serve as a basis for the work of the European Commission on a regular basis, compiling progress in the different areas of INSPIRE implementation. As a result of this work, annual reports are generated for each country, including a section on costs and benefits.
All this work on measuring and estimating benefits highlights the economic value of providing geographic data and services to society. As a result, new products and services can be created that boost the economy of the whole country and provide benefits to all its citizens.
Noticia
The European Data Portal, data.europa.eu, has just published its Data Maturity Index, an index that assesses the level of maturity of European countries in terms of open data. For its elaboration, an evaluation survey has been carried out and has been completed by 35 countries, including the 27 Member States of the European Union, three countries of the European Free Trade Association (Iceland, Norway and Switzerland) and five candidate countries (Bosnia and Herzegovina, Montenegro, Albania, Serbia and Serbia and Ukraine).
In this year's edition, Spain obtained a score of 95% out of 100%. This places it in fifth place overall and in fourth place if only European Union (EU27) member countries are taken into account. This figure represents an improvement of three percentage points over last year's score and places Spain 12 points above the EU27 average (83%).
The top positions in the ranking are occupied by France, Poland, Ukraine and Estonia.
Above the EU27 average in all dimensions analyzed
The index is accompanied by a report containing the analysis carried out and an overview of the good practices applied in Europe. In the case of Spain, it is above the EU-27 average in the four indicators analyzed:
-
Policy, focused on the open data policies of the different countries. It analyzes the existence of national governance models for open data management and the measures that have been applied to implement existing strategies. This is the indicator in which Spain obtains a higher score, with 99% compared to 89% in the EU27. The report highlights how the country's national open data strategy helps promote the openness of public information through innovative and structured actions in collaboration with public and private partners. Among other issues, the strategy includes the objective of identifying business models and business success stories to share successful practices. The report also highlights the existence of various digital strategies that complement specific policies on open data, such as the national artificial intelligence strategy, which includes provisions related to the availability of open data for the operation and training of artificial intelligence systems.
-
Impact, which analyzes the activities undertaken to monitor and measure both the reuse of open data and the impact created by such reuse. Traditionally, this has been the least mature dimension across Europe. Nevertheless, Spain scores 96% compared to 77% in the EU27. The best results are achieved in measuring the impact of open data use cases in the environmental, economic and political sectors.
-
Portal, focused on evaluating the functionalities of the national platform that allow users to access open data and help drive interaction within the community. With 96% compared to 85% in the EU27, Spain stands out in the use of analytical tools to understand user behavior, and in the implementation of strategies to ensure the sustainability of the portal and increase its visibility, including presence in social networks. It also highlights the existence of a private area that allows editors to act according to the feedback received.
-
Quality, which examines the mechanisms for ensuring the quality of (meta)data. Here Spain scores 88% compared to 82% in the EU27. Spain's score is driven by compliance with the DCAT-AP standard (providing educational materials for publishers), the existence of a systematic approach to ensure that metadata is up to date, and the wide range of data offered, both historical and current.

The report also measures how EU27 countries are progressing in the implementation of the implementing regulation on high-value datasets. In this section, Spain ranks ninth, with 68% implementation. In general, Member States are making more progress on geospatial and statistical datasets. Progress is also being made on the underlying technical and legal requirements.
Overall recommendations
The report includes a number of recommendations for Spain, among other countries, including encouraging the development of initiatives at the local and regional level, fostering better coordination between teams, and activating the network of open data officers to implement monitoring activities within their organizations. Emphasis is also placed on the need to promote existing open data courses and promote new training materials, paying special attention to developing strategic awareness of the reuse and impact of open data.
Overall, the report shows good progress in open data across Europe. Although there are areas for improvement, the European open data landscape is consolidating, with Spain at the top of the table.
In 2024, new waves of implementation of the European data strategy will present national teams with new challenges. On the one hand, they will have to redouble their efforts to inform citizens of the new data sources arising from initiatives such as the Data Governance Act and the data spaces. In this sense, coordination will be necessary between the new figures arising from these legislative developments and the traditional world of open data, enhancing the obvious synergies between the two to boost the data economy and collectivize the value generated.
Blog
There is a recurring question that has been around since the beginning of the open data movement, and as efforts and investments in data collection and publication have increased, it has resonated more and more strongly: What is the value of a dataset?
This is an extremely difficult question to answer given not only the inherent complexity of the data itself, which grows exponentially as we begin to combine it, but also the different points of view from which the question of value can be approached.
- If we know that the value will not be immediate, how can we foresee and quantify the potential benefits at some point in the future?
- Could the value of data become negative in some cases, if we can also cause some kind of 'harm' with it?
- Can the value of data degrade over time?
In this space we have recurrently analysed the value of open data for the administration from different approaches: high-value data and its identification, the perspective of suppliers, the keys to the value of data, how to generate value through data or what is the value of data in real time. However, analysis and research work in this area continues to grow unstoppably. In this regard, we would like to highlight a recently published paper from the University of Cambridge. It is a study in which some of the most common methods for data valuation are described.
Based on their previous analysis of the characteristics of the data and its associated value, a review of the methods that currently exist has been carried out. They concluded that these methods can be divided into several categories, the characteristics of which are detailed below.
Methods based on cost análisis
This approach is based on the traditional statistical principle of "sum of costs". It takes into account the costs of generating, collecting, storing and replacing datasets, as well as the costs to the organisation in case the data results in some kind of loss. These methods have the advantage that they are relatively easy to calculate, but on the other hand, they have the difficulty of having to differentiate between costs directly attributable to the data and other indirect costs related to, for example, the variety of professional work involved or the different software elements used.
An example of the application of this method is the case of Statistics Canada with its analysis of the valuation of the costs associated with investment in data, databases and data science in Canada.
Methods based on revenue análisis
In this case, revenue stream expectations are used, taking as a reference the existing potential market for the exploitation of the data. This may take into account, for example, usage fees, trademarks or patents. The main limitations of these methods are generally that they require the application of somewhat more subjective criteria and the complexity of estimating the value when the data are not exploited directly but indirectly, e.g. through analytics.
These methods are used in the OECD study on the prospects for the value of data. It calculates the reported revenues related to the collection and sale of data through the US enterprise survey.
Methods based on market análisis
Generally, these are the preferred methods to use when all the elements necessary to make the calculations are available. However, today there is still a large amount of data in organisations for internal use only, which makes it difficult to use these methods, as their behaviour is not visible to the market. Furthermore, these methods cannot fully incorporate the social value of the data.
An example of this method is the analysis made in the study carried out by the Economic Commission for Latin America and the Caribbean (ECLAC) on the data marts launched by the European Union and the Government of Colombia, respectively.
Experiments and surveys
This approach to the value of data consists of assessing market sentiment in relation to the data by directly asking about the willingness to pay for certain data or to do without it. It is generally used when the public market value is not known or in cases where social value is important, for example in the environmental area. A limitation of these methods is that, when respondents are not specialists, it can be quite difficult for them to assess the possible uses of the data and thus its full value.
The study carried out by the UK Office for National Statistics is a clear example of such valuation methods.
Impact-based methods
In this case the assessment is carried out through experiments or case studies that analyse the causal effect on certain outcomes attributable to the data. This option is particularly useful for evidence-led policy makers, as it allows a cause-effect relationship to be established, making it easier to understand the benefits and to develop a narrative in favour of the use of the data. However, if the experiments are not well designed or are not well adjusted to the specific context we want to analyse, we run the risk of obtaining an excessively subjective assessment.
The decision-based evaluation framework proposed by the Internet of Water Coalition is a good example of how to apply impact-focused methods to a particular case.
Actor-chain methods
The aim of these methods is to use a more comprehensive view to assess the data from different points of view. This means that evaluations can also be more complex by involving different definitions of what constitutes the value of the data. However, it also makes it the most appropriate method when one wants to assess a data ecosystem as a whole. Moreover, it is a growing method for organisations considering socially responsible investment.
An example of how these methods can be applied in practice is the case study carried out with Highways England.
Methods based on real options analysis
The main advantage of these methods is that they can be applied even when not all possible use cases for the data are yet defined. Their aim is to get an estimate of the value of the data in certain possible future scenarios - usually through computer simulation - so that if such a scenario is reached, exploitation of the data could be justified. Thus, certain data-related decisions and investments could be postponed until the ideal scenario that maximises the value of the data is reached, thereby minimising the associated costs and risks until that point.
The UK case study on the transport sector provides an example of how these methods could be applied using financial models.
And what is the method I should use in my particular case?
Unfortunately, there is no golden rule for selecting a particular method. However, there are a number of questions that the authors of the study suggest we ask ourselves in order to find the most appropriate method for each case:
- What exactly we are assessing: Data goes through several stages in its life cycle - from raw data to processed data, analysis or generated knowledge. Depending on which phase we want to focus our analysis on, some methods may be more appropriate than others.
- From which point of view the valuation is carried out: value can have different definitions depending on the point of view of who is carrying out or commissioning a valuation. In some cases, for example, cost containment due to budgetary constraints may be the priority, while in others one might choose to try to maximise social value.
- When the assessment process takes place: basically it should be considered whether the assessment will be carried out in a predictive way before all the elements assessed are available or whether it will be carried out a posteriori, once all the variables are already known.
- What is the purpose of the assessment: several of the available methods omit or minimise certain aspects of the data by focusing on other features of the assessment process. Therefore, it will be necessary to be clear about the priorities of our evaluation when selecting the most appropriate method: are we interested in social impact, improving productivity or maximising the cost-effectiveness of data?
We should therefore first analyse our needs and our own definition of value, asking ourselves what exactly we want to evaluate and how best to carry out that evaluation, and then develop our own valuation framework using the most appropriate methods from the wide variety available.
Content prepared by Carlos Iglesias, Open data Researcher and consultant, World Wide Web Foundation.
The contents and views expressed in this publication are the sole responsibility of the author.