6 posts found
AI Data Readiness: Preparing Data for Artificial Intelligence
Over the last few years we have seen spectacular advances in the use of artificial intelligence (AI) and, behind all these achievements, we will always find the same common ingredient: data. An illustrative example known to everyone is that of the language models used by OpenAI for its famous ChatGP…
Benefits and opportunities of public initiatives for open data visualisation
Imagine you want to know how many terraces there are in your neighbourhood, how the pollen levels in the air you breathe every day are evolving or whether recycling in your city is working well. All this information exists in your municipality's databases, but it sits in spreadsheets and technical d…
Big Data Test Infrastructure: A free environment for public administrations to experiment with open data
The Big Data Test Infrastructure (BDTI) is a tool funded by the European Digital Agenda, which enables public administrations to perform analysis with open data and open source tools in order to drive innovation.
This free-to-use, cloud-based tool was created in 2019 to accelerate d…
FAIR principles: the secret of the data wizards.
Books are an inexhaustible source of knowledge and experiences lived by others before us, which we can reuse to move forward in our lives. Libraries, therefore, are places where readers looking for books, borrow them, and once they have used them and extracted from them what they need, return them.…
Re-use of open data in public administrations
Open data is a source of information for the development of smart services, as well as for decision-making and policy-making. It is therefore not surprising that an increasing number of public bodies, in addition to opening data - for reuse by others and for reasons of accountability and transparenc…
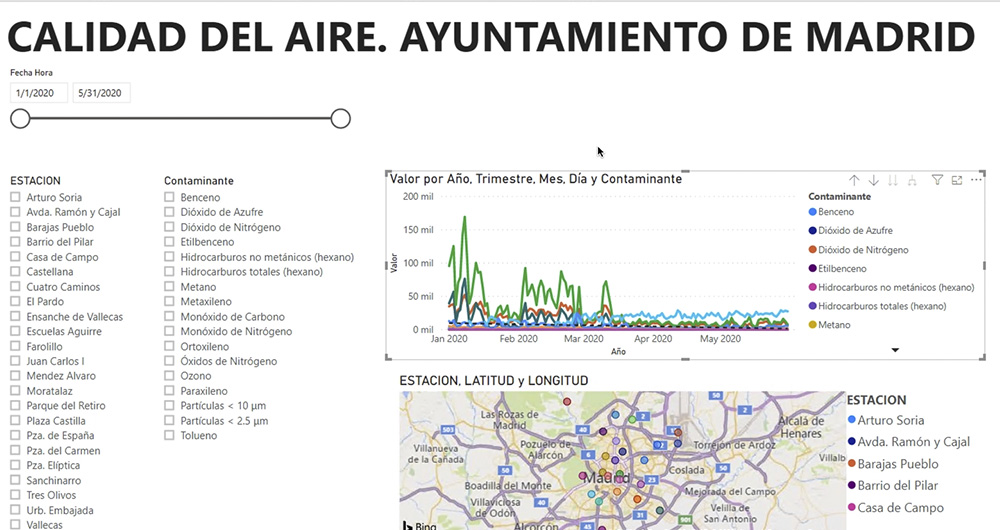
What is an interactive display? Here is an example
The visual representation of data helps our brain to digest large amounts of information quickly and easily. Interactive visualizations make it easier for non-experts to analyze complex situations represented as data.
As we introduced in our last post on this topic, graphical data visualization is a…


