5 posts found
Data visualization: the best charts for representing comparisons
Data is a valuable source of knowledge for society. Public commitment to achieving data openness, public-private collaboration on data, and the development of applications with open data are actions that are part of the data economy, which seeks the innovative, ethical, and practical use of data to…
How to choose the right chart to visualise open data
A statistical graph is a visual representation designed to contain a series of data whose objective is to highlight a specific part of the reality. However, organising a set of data in an informative way is not an easy task, especially, if we want to capture the viewer’s attention and to present the…
European Legislation Identifier (ELI): an opportunity to boost interoperability and reuse of legal texts
Nowadays we can find a great deal of legislative information on the web. Countries, regions and municipalities make their regulatory and legal texts public through various spaces and official bulletins. The use of this information can be of great use in driving improvements in the sector: from facil…
Improving efficiency in the legal sector: LegalTech and data analytics
Digital transformation affects all sectors, from agriculture to tourism and education. Among its objectives is the optimization of processes, the improvement of the customer experience and even the promotion of new business models.
The legal sector is no exception, which is why in recent years…
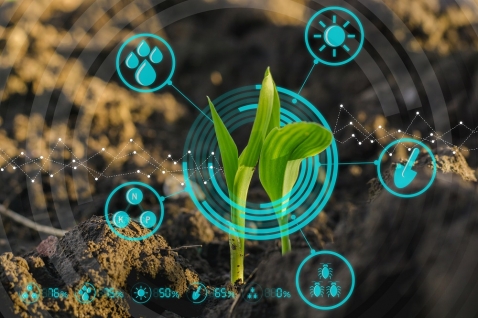
Applications of [open] data science for agriculture
In many areas, there is a false belief that the primary sector is a technologically backward sector that is not involved in digitization. Perhaps because throughout history, as economic development indicators progressed, their weight in GDP and employment rates has been decreasing in favor of other…


