


Documentation
Sort by:
-
Road to electrification: Deciphering electric vehicle growth in Spain through data analytics
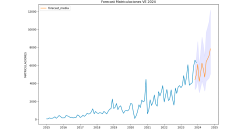
1. Introduction Visualisations are graphical representations of data that allow to communicate, in a simple and effective way, the information linked to the data. The visualisation possibilities are very wide ranging, from basic representations such...
-
Predictive analisys of electric consuption in the city of Barcelona
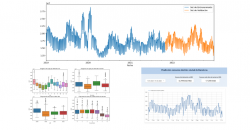
1. Introduction Visualizations are graphical representations of data that allow you to communicate, in a simple and effective way, the information linked to it. The visualization possibilities are very extensive, from basic representations such as...
-
Analysis of travel networks in BICIMAD
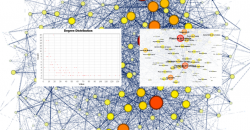
1. Introduction Visualizations are graphical representations of data that allow the information linked to them to be communicated in a simple and effective way. The visualization possibilities are very wide, from basic representations, such as line,...
-
Study on nutrition in spanish homes
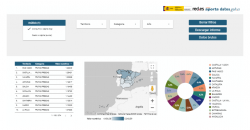
1. Introduction Visualizations are graphical representations of data that allow the information linked to them to be communicated in a simple and effective way. The visualization possibilities are very wide, from basic representations, such as line,...


