Road to electrification: Deciphering electric vehicle growth in Spain through data analytics


Fecha del documento: 15-04-2024
1. Introduction
Visualisations are graphical representations of data that allow to communicate, in a simple and effective way, the information linked to the data. The visualisation possibilities are very wide ranging, from basic representations such as line graphs, bar charts or relevant metrics, to interactive dashboards.
In this section of "Step-by-Step Visualisations we are regularly presenting practical exercises making use of open data available at datos.gob.es or other similar catalogues. They address and describe in a simple way the steps necessary to obtain the data, carry out the relevant transformations and analyses, and finally draw conclusions, summarizing the information.
Documented code developments and free-to-use tools are used in each practical exercise. All the material generated is available for reuse in the GitHub repository of datos.gob.es.
In this particular exercise, we will explore the current state of electric vehicle penetration in Spain and the future prospects for this disruptive technology in transport.
Access the data lab repository on Github.
Run the data pre-processing code on Google Colab.
In this video (available with English subtitles), the author explains what you will find both on Github and Google Colab.
2. Context: why is the electric vehicle important?
The transition towards more sustainable mobility has become a global priority, placing the electric vehicle (EV) at the centre of many discussions on the future of transport. In Spain, this trend towards the electrification of the car fleet not only responds to a growing consumer interest in cleaner and more efficient technologies, but also to a regulatory and incentive framework designed to accelerate the adoption of these vehicles. With a growing range of electric models available on the market, electric vehicles represent a key part of the country's strategy to reduce greenhouse gas emissions, improve urban air quality and foster technological innovation in the automotive sector.
However, the penetration of EVs in the Spanish market faces a number of challenges, from charging infrastructure to consumer perception and knowledge of EVs. Expansion of the freight network, together with supportive policies and fiscal incentives, are key to overcoming existing barriers and stimulating demand. As Spain moves towards its sustainability and energy transition goals, analysing the evolution of the electric vehicle market becomes an essential tool to understand the progress made and the obstacles that still need to be overcome.
3. Objective
This exercise focuses on showing the reader techniques for the processing, visualisation and advanced analysis of open data using Python. We will adopt a "learning-by-doing" approach so that the reader can understand the use of these tools in the context of solving a real and topical challenge such as the study of EV penetration in Spain. This hands-on approach not only enhances understanding of data science tools, but also prepares readers to apply this knowledge to solve real problems, providing a rich learning experience that is directly applicable to their own projects.
The questions we will try to answer through our analysis are:
- Which vehicle brands led the market in 2023?
- Which vehicle models were the best-selling in 2023?
- What market share will electric vehicles absorb in 2023?
- Which electric vehicle models were the best-selling in 2023?
- How have vehicle registrations evolved over time?
- Are we seeing any trends in electric vehicle registrations?
- How do we expect electric vehicle registrations to develop next year?
- How much CO2 emission reduction can we expect from the registrations achieved over the next year?
4. Resources
To complete the development of this exercise we will require the use of two categories of resources: Analytical Tools and Datasets.
4.1. Dataset
To complete this exercise we will use a dataset provided by the Dirección General de Tráfico (DGT) through its statistical portal, also available from the National Open Data catalogue (datos.gob.es). The DGT statistical portal is an online platform aimed at providing public access to a wide range of data and statistics related to traffic and road safety. This portal includes information on traffic accidents, offences, vehicle registrations, driving licences and other relevant data that can be useful for researchers, industry professionals and the general public.
In our case, we will use their dataset of vehicle registrations in Spain available via:
- Open Data Catalogue of the Spanish Government.
- Statistical portal of the DGT.
Although during the development of the exercise we will show the reader the necessary mechanisms for downloading and processing, we include pre-processed data
in the associated GitHub repository, so that the reader can proceed directly to the analysis of the data if desired.
*The data used in this exercise were downloaded on 04 March 2024. The licence applicable to this dataset can be found at https://datos.gob.es/avisolegal.
4.2. Analytical tools
- Programming language: Python - a programming language widely used in data analysis due to its versatility and the wide range of libraries available. These tools allow users to clean, analyse and visualise large datasets efficiently, making Python a popular choice among data scientists and analysts.
- Platform: Jupyter Notebooks - ia web application that allows you to create and share documents containing live code, equations, visualisations and narrative text. It is widely used for data science, data analytics, machine learning and interactive programming education.
-
Main libraries and modules:
- Data manipulation: Pandas - an open source library that provides high-performance, easy-to-use data structures and data analysis tools.
- Data visualisation:
- Matplotlib: a library for creating static, animated and interactive visualisations in Python..
- Seaborn: a library based on Matplotlib. It provides a high-level interface for drawing attractive and informative statistical graphs.
- Statistics and algorithms:
- Statsmodels: a library that provides classes and functions for estimating many different statistical models, as well as for testing and exploring statistical data.
- Pmdarima: a library specialised in automatic time series modelling, facilitating the identification, fitting and validation of models for complex forecasts.
5. Exercise development
It is advisable to run the Notebook with the code at the same time as reading the post, as both didactic resources are complementary in future explanations
The proposed exercise is divided into three main phases.
5.1 Initial configuration
This section can be found in point 1 of the Notebook.
In this short first section, we will configure our Jupyter Notebook and our working environment to be able to work with the selected dataset. We will import the necessary Python libraries and create some directories where we will store the downloaded data.
5.2 Data preparation
This section can be found in point 2 of the Notebookk.
All data analysis requires a phase of accessing and processing to obtain the appropriate data in the desired format. In this phase, we will download the data from the statistical portal and transform it into the format Apache Parquet format before proceeding with the analysis.
Those users who want to go deeper into this task, please read this guide Practical Introductory Guide to Exploratory Data Analysis.
5.3 Data analysis
This section can be found in point 3 of the Notebook.
5.3.1 Análisis descriptivo
In this third phase, we will begin our data analysis. To do so,we will answer the first questions using datavisualisation tools to familiarise ourselves with the data. Some examples of the analysis are shown below:
- Top 10 Vehicles registered in 2023: In this visualisation we show the ten vehicle models with the highest number of registrations in 2023, also indicating their combustion type. The main conclusions are:
- The only European-made vehicles in the Top 10 are the Arona and the Ibiza from Spanish brand SEAT. The rest are Asians.
- Nine of the ten vehicles are powered by gasoline.
- The only vehicle in the Top 10 with a different type of propulsion is the DACIA Sandero LPG (Liquefied Petroleum Gas).
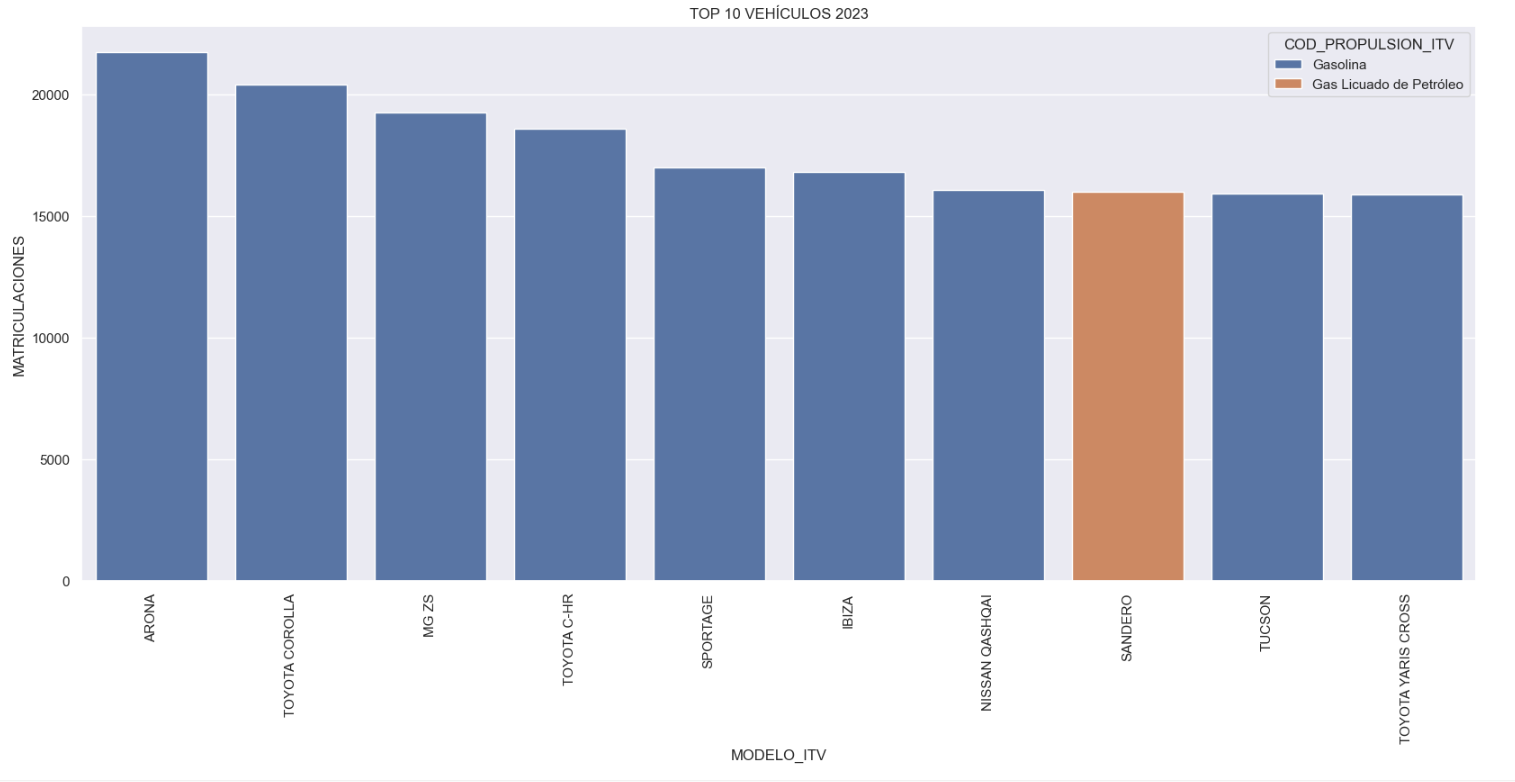
Figure 1. Graph "Top 10 vehicles registered in 2023"
- Market share by propulsion type: In this visualisation we represent the percentage of vehicles registered by each type of propulsion (petrol, diesel, electric or other). We see how the vast majority of the market (>70%) was taken up by petrol vehicles, with diesel being the second choice, and how electric vehicles reached 5.5%.
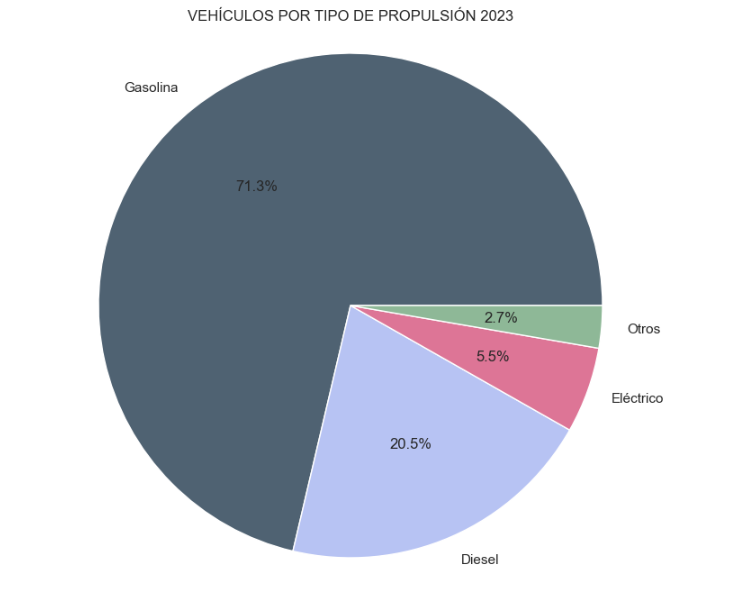
Figure 2. Graph "Market share by propulsion type".
- Historical development of registrations: This visualisation represents the evolution of vehicle registrations over time. It shows the monthly number of registrations between January 2015 and December 2023 distinguishing between the propulsion types of the registered vehicles, and there are several interesting aspects of this graph:
- We observe an annual seasonal behaviour, i.e. we observe patterns or variations that are repeated at regular time intervals. We see recurring high levels of enrolment in June/July, while in August/September they decrease drastically. This is very relevant, as the analysis of time series with a seasonal factor has certain particularities.
-
The huge drop in registrations during the first months of COVID is also very remarkable.
-
We also see that post-covid enrolment levels are lower than before.
-
Finally, we can see how between 2015 and 2023 the registration of electric vehicles is gradually increasing.
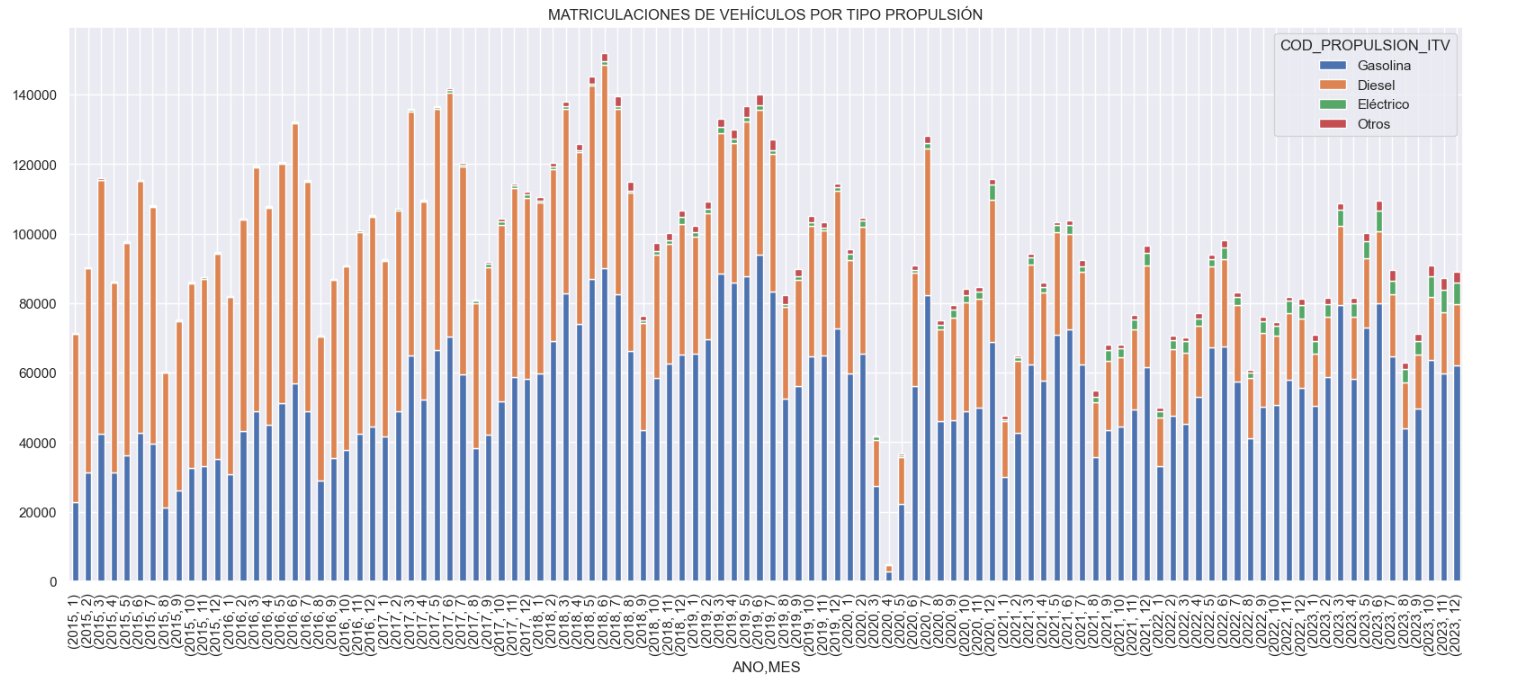
Figure 3. Graph "Vehicle registrations by propulsion type".
- Trend in the registration of electric vehicles: We now analyse the evolution of electric and non-electric vehicles separately using heat maps as a visual tool. We can observe very different behaviours between the two graphs. We observe how the electric vehicle shows a trend of increasing registrations year by year and, despite the COVID being a halt in the registration of vehicles, subsequent years have maintained the upward trend.
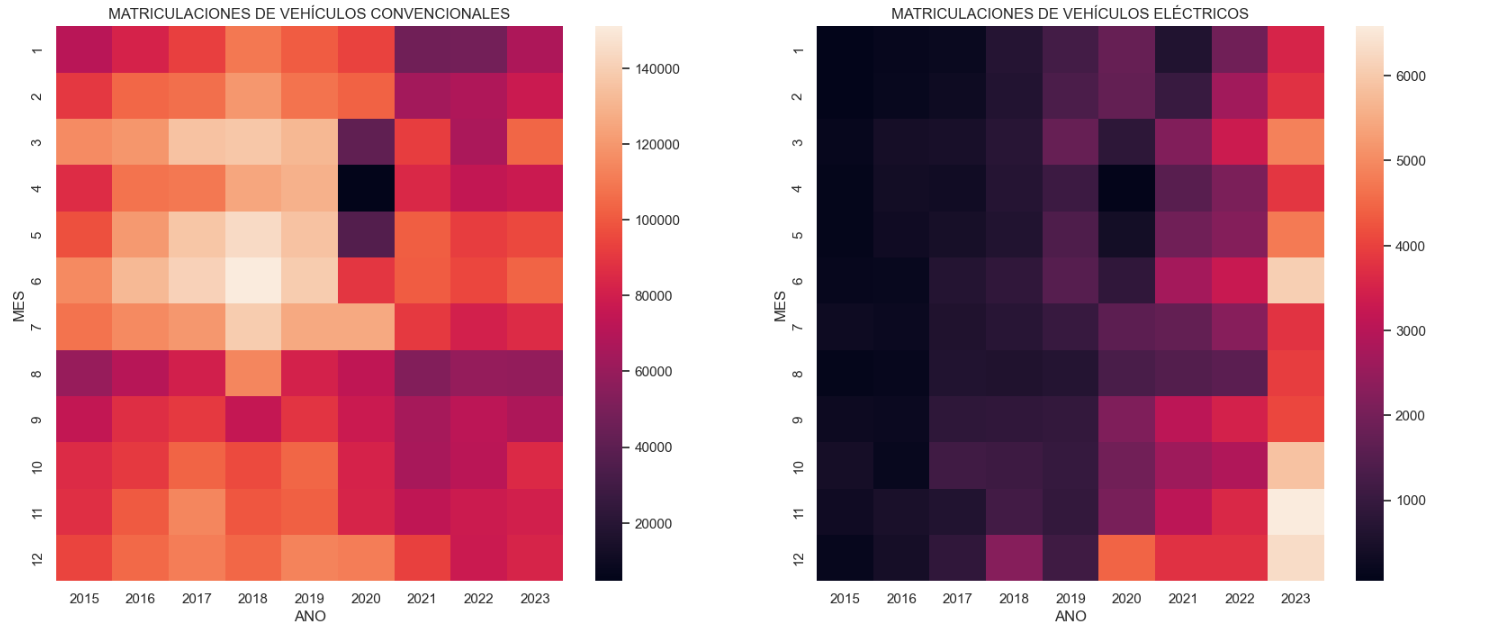
Figure 4. Graph "Trend in registration of conventional vs. electric vehicles".
5.3.2. Predictive analytics
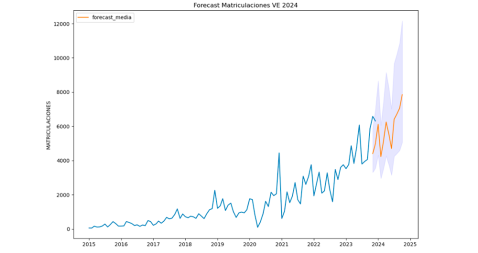
To answer the last question objectively, we will use predictive models that allow us to make estimates regarding the evolution of electric vehicles in Spain. As we can see, the model constructed proposes a continuation of the expected growth in registrations throughout the year of 70,000, reaching values close to 8,000 registrations in the month of December 2024 alone.
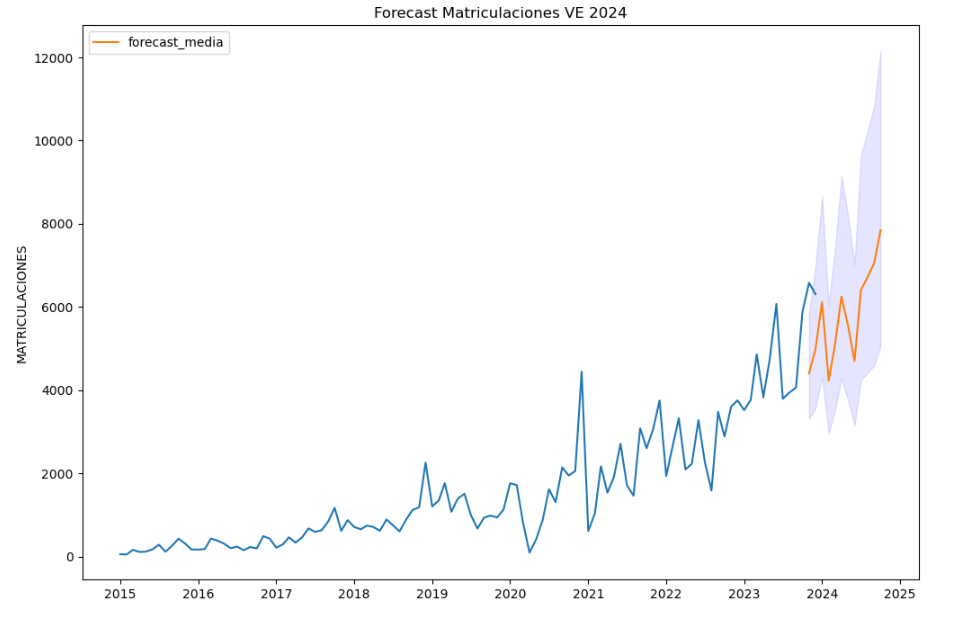
Figure 5. Graph "Predicted electric vehicle registrations".
5. Conclusions
As a conclusion of the exercise, we can observe, thanks to the analysis techniques used, how the electric vehicle is penetrating the Spanish vehicle fleet at an increasing speed, although it is still at a great distance from other alternatives such as diesel or petrol, for now led by the manufacturer Tesla. We will see in the coming years whether the pace grows at the level needed to meet the sustainability targets set and whether Tesla remains the leader despite the strong entry of Asian competitors.
6. Do you want to do the exercise?
If you want to learn more about the Electric Vehicle and test your analytical skills, go to this code repository where you can develop this exercise step by step.
Also, remember that you have at your disposal more exercises in the section "Step by step visualisations" "Step-by-step visualisations" section.
Content elaborated by Juan Benavente, industrial engineer and expert in technologies linked to the data economy. The contents and points of view reflected in this publication are the sole responsibility of the author.