


Infographics: Disruptive technologies and open data


Fecha del documento: 05-11-2021
Open data can be the basis for various disruptive technologies, such as Artificial Intelligence, which can lead to improvements in society and the economy. These infographics address both tools for working with data and examples of the use of open data in these new technologies. New content will be published periodically.
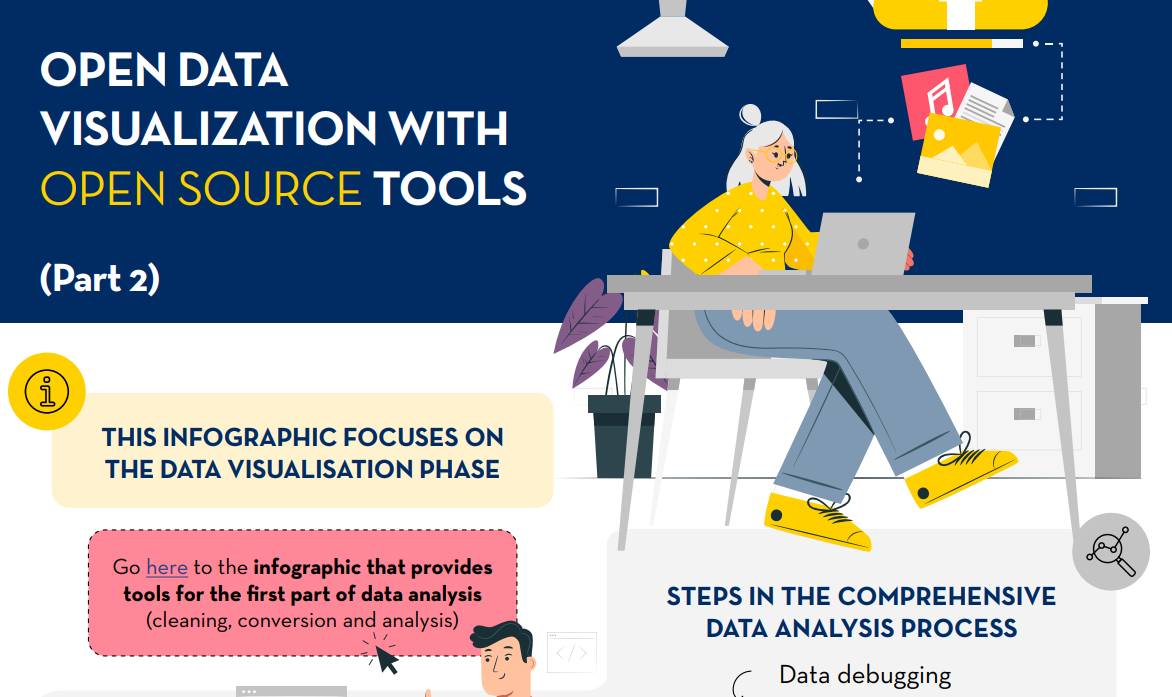
1. Open data analysis with open source tools (part 2)
Published: June 2025
This infographic compiles data visualisation tools, the last step of exploratory data analysis. It is the second part of the infographic on open data analysis with open source tools.
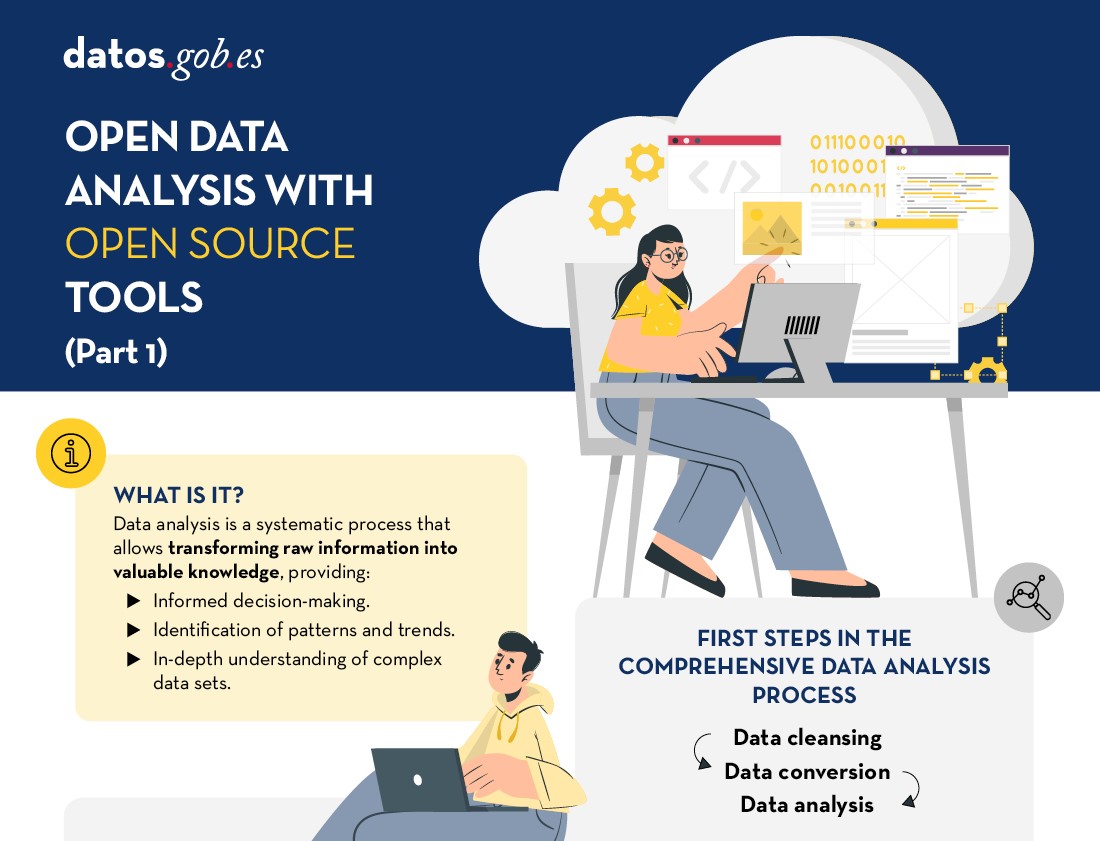
2. Open data analysis with open source tools
Published: March 2025
EDA is the application of a set of statistical techniques aimed at exploring, describing and summarising the nature of data in a way that ensures its objectivity and interoperability. In this infographic, we compile free tools to perform the first three steps of data analysis..
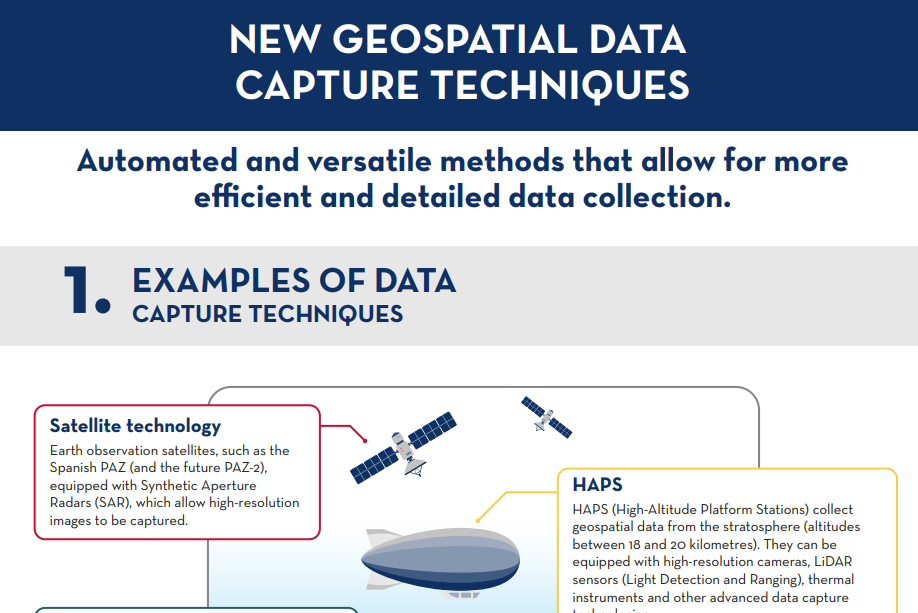
3. New geospatial data capture techniques
Published: January 2025
Geospatial data capture is essential for understanding the environment, making decisions and designing effective policies. In this infographic, we will explore new methods of data capture,.
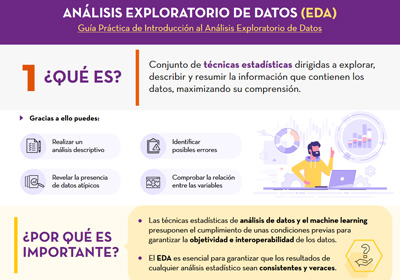
4. Exploratory Data Analysis (EDA)
Published: November 2024
Based on the report “Guía Práctica de Introducción al Análisis Exploratorio de Datos”, an infographic has been prepared that summarises in a simple way what this technique consists of, its benefits and the steps to follow in order to carry it out correctly.
5. Glossary of open data and related new technologies
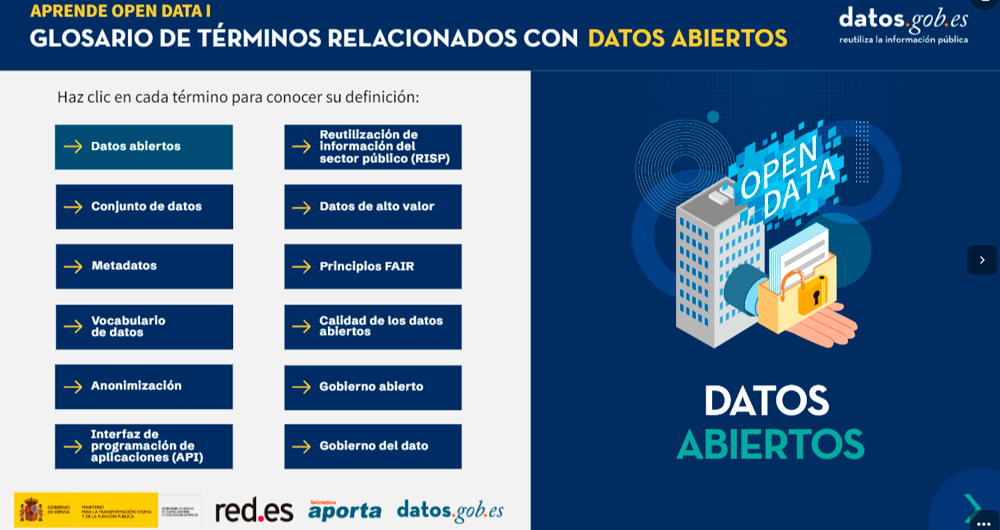
Published: April 2024 and May 2024
This page contains two infographics. The first infographic contains the definition of various terms related to open data, while the second focuses on new technologies related to data.
6. Synthetic Data (EDA)
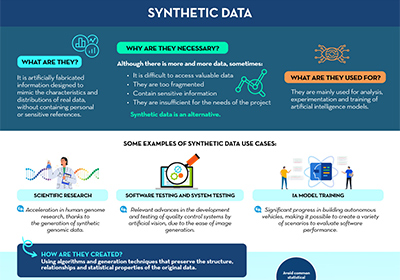
Published: October 2023
Based on the report 'Synthetic Data: What are they and what are they used for?', an infographic has been prepared that summarizes in a simple way the main keys of synthetic data and how they overcome the limitations of real data..
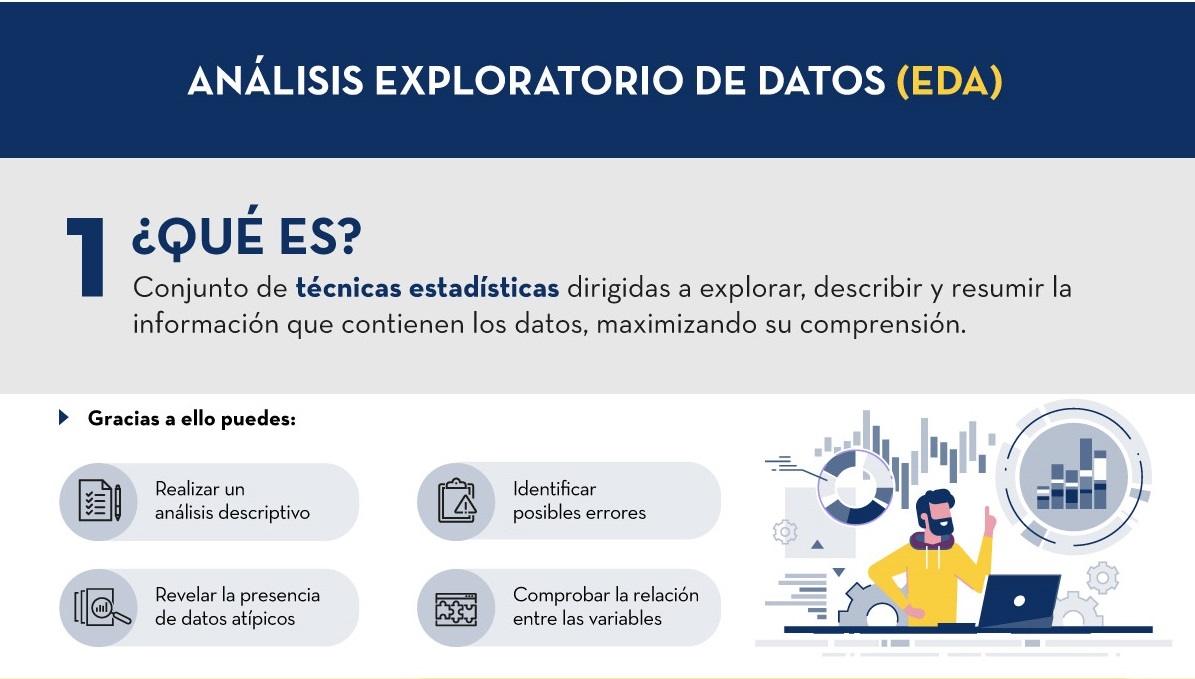
7. Exploratory Data Analysis (EDA)
Published: September 2021
Based on the report "A Practical Introductory Guide to Exploratory Data Analysis", an infographic has been prepared that summarizes in a simple way what this technique consists of, its benefits and which are the steps to follow to perform it correctly.
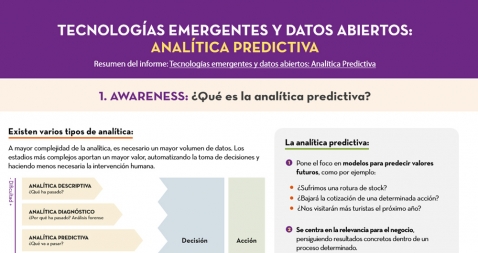
8. Emerging Technologies and Open Data: Predictive Analytics
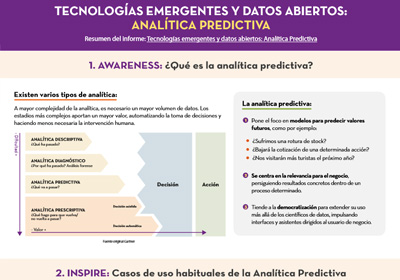
Published: April 2021
This infographic is a summary of the report "Emerging Technologies and Open Data: Predictive Analytics", from the "Awareness, Inspire, Action" series. It explains what predictive analytics is and its most common use cases. It also shows a practical example, using the dataset related to traffic accident in the city of Madrid.
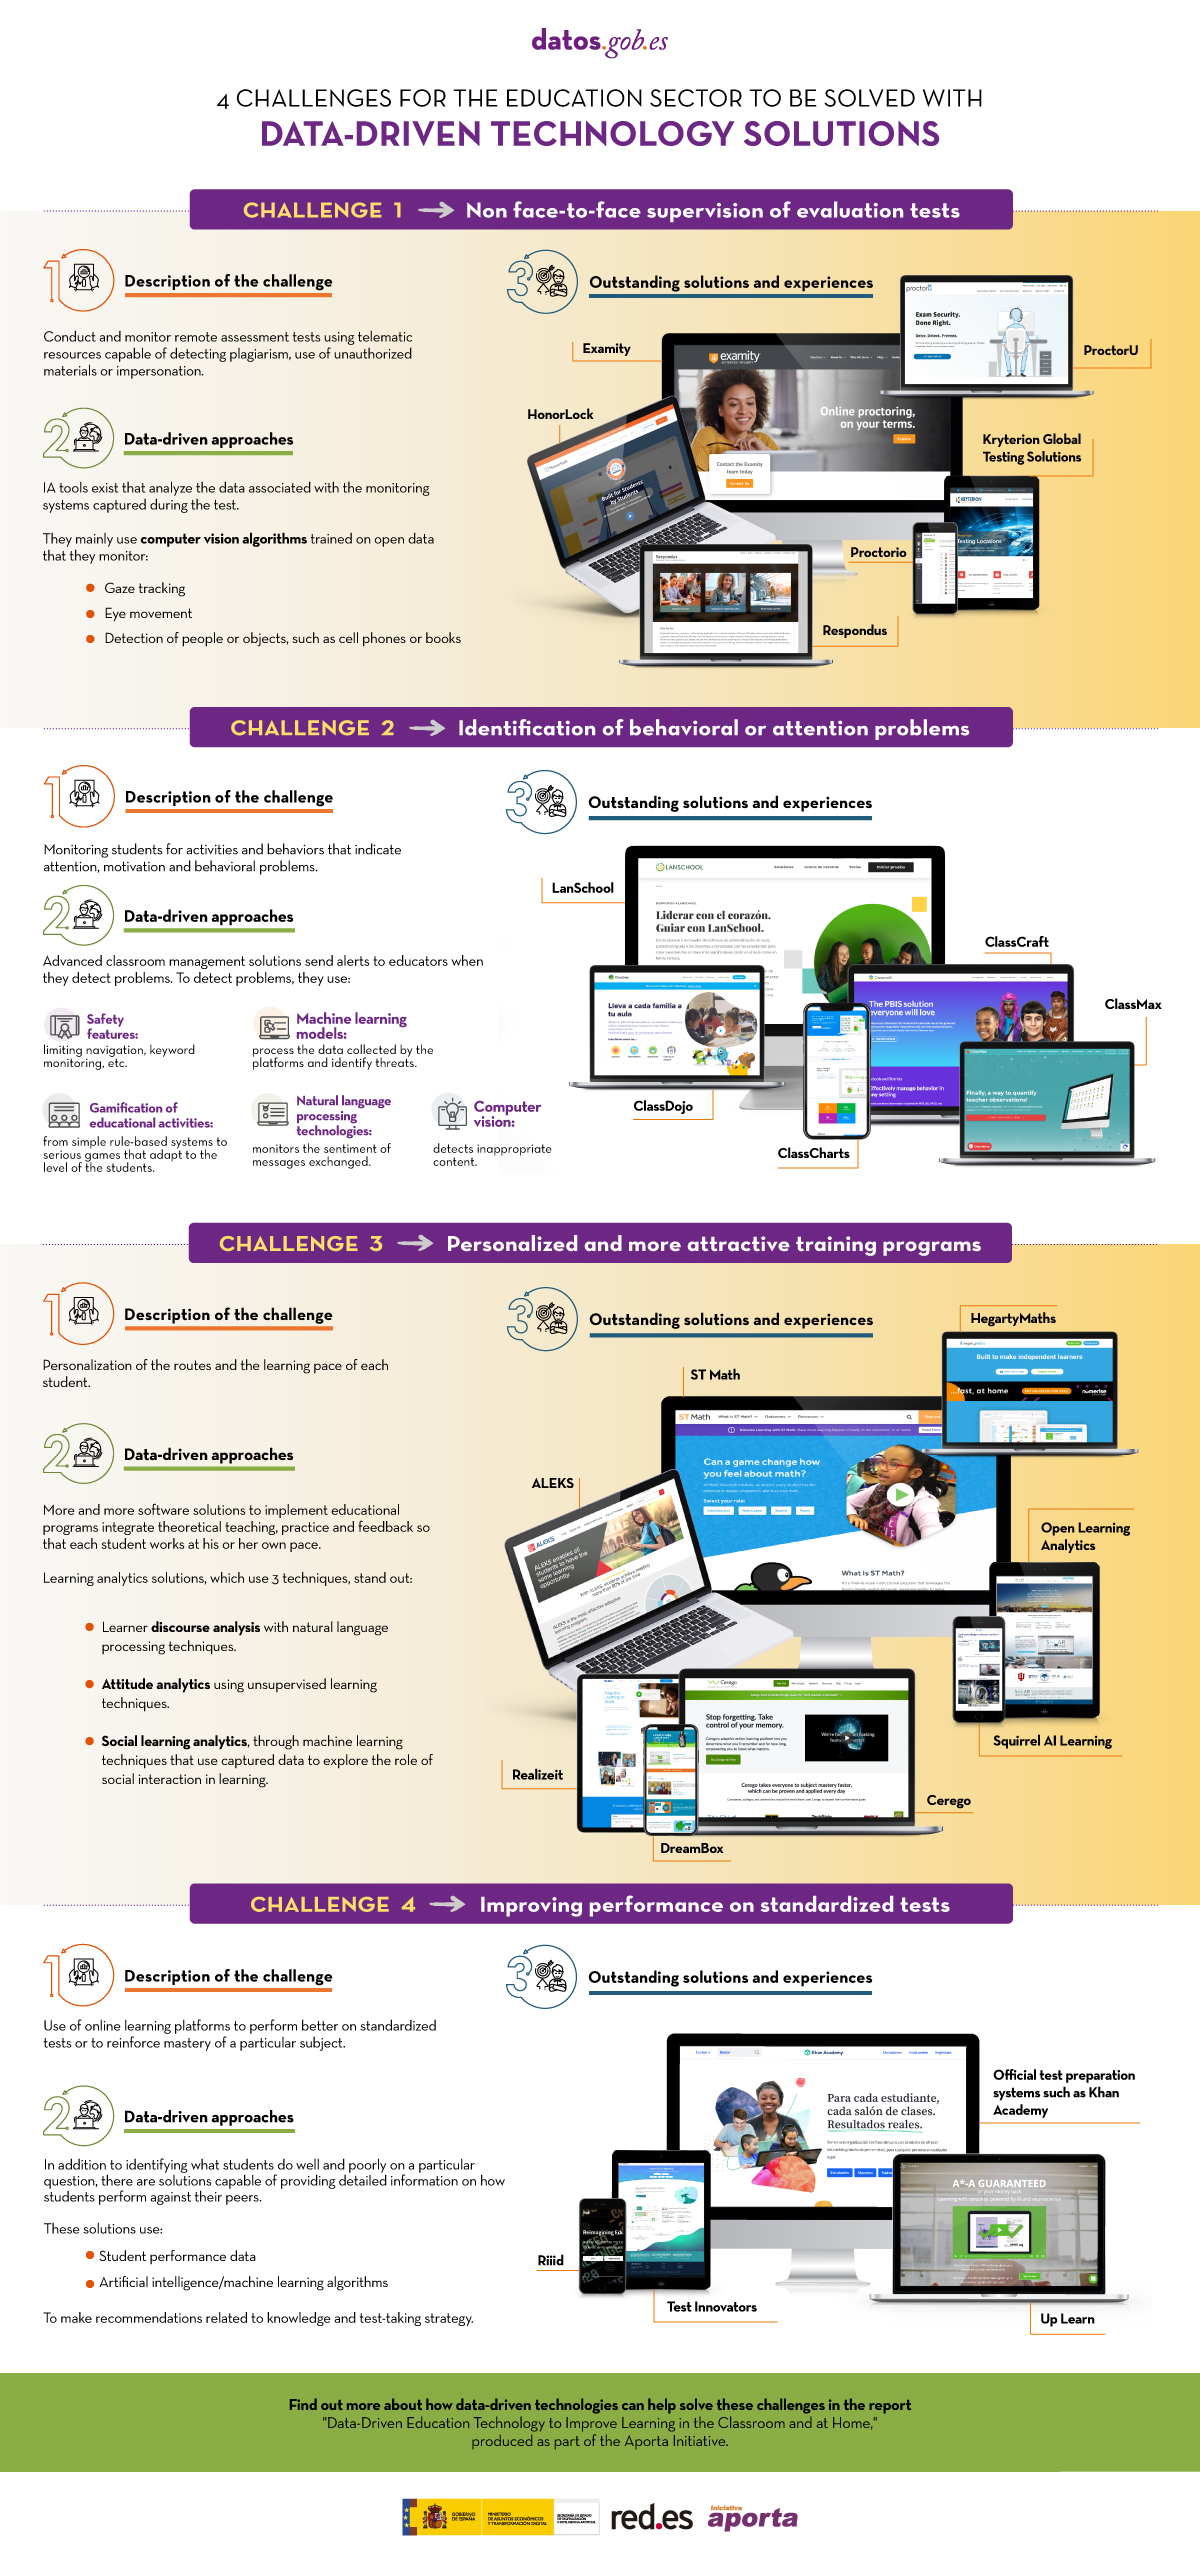
9. Data-driven education technology to improve learning in the classroom and at home
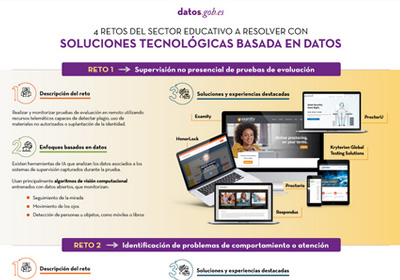
Published: August 2020
Innovative educational technology based on data and artificial intelligence can address some of the challenges facing the education system, such as monitoring online assessment tests, identifying behavioral problems, personalized training or improving performance on standardized tests. This infographic, a summary of the report "Data-driven educational technology to improve learning in the classroom and at home", shows some examples.


