6 posts found
DCAT-AP-ES: A step forward in open data interoperability
Context and need for an update
Data is a key resource in the digital transformation of public administrations. Ensuring its access, interoperability and reuse is fundamental to improve transparency, foster innovation and enable the development of efficient public services centered on citizens.
In th…
GeoParquet 1.0.0: new format for more efficient access to spatial data
Cloud data storage is currently one of the fastest growing segments of enterprise software, which is facilitating the incorporation of a large number of new users into the field of analytics.
As we introduced in a previous post, a new format, Parquet, has among its…
Artificial Intelligence applied to the identification and classification of diseases detected by radiodiagnosis
In this post we have described step-by-step a data science exercise in which we try to train a deep learning model with a view to automatically classifying medical images of healthy and sick people.
Diagnostic imaging has been around for many years in the hospitals of develo…
Why should you use Parquet files if you process a lot of data?
It's been a long time since we first heard about the Apache Hadoop ecosystem for distributed data processing. Things have changed a lot since then, and we now use higher-level tools to build solutions based on big data payloads. However, it is important to highlight some best practices related to ou…
Low coding tools for data analysis
The democratisation of technology in all areas is an unstoppable trend. With the spread of smartphones and Internet access, an increasing number of people can access high-tech products and services without having to resort to advanced knowledge or specialists. The world of data is no stranger to thi…
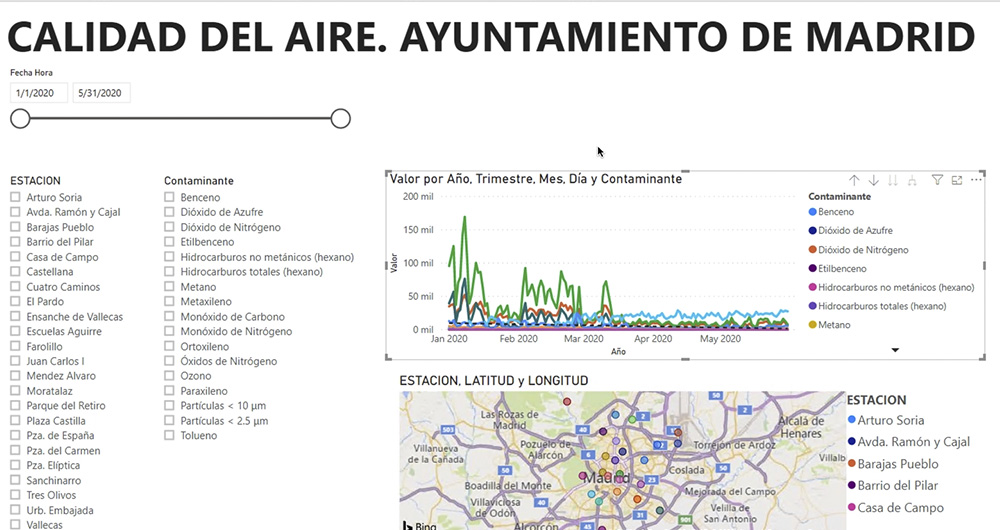
What is an interactive display? Here is an example
The visual representation of data helps our brain to digest large amounts of information quickly and easily. Interactive visualizations make it easier for non-experts to analyze complex situations represented as data.
As we introduced in our last post on this topic, graphical data visualization is a…


