5 posts found
Neurotechnology and neurodata: what is its potential?
Imagine a machine that can tell if you're happy, worried, or about to make a decision, even before you know clearly. Although it sounds like science fiction, that future is already starting to take shape. Thanks to advances in neuroscience and technology, today we can record, analyze, and even predi…
Data visualization: the best charts for representing comparisons
Data is a valuable source of knowledge for society. Public commitment to achieving data openness, public-private collaboration on data, and the development of applications with open data are actions that are part of the data economy, which seeks the innovative, ethical, and practical use of data to…

How to choose the right chart to visualise open data
A statistical graph is a visual representation designed to contain a series of data whose objective is to highlight a specific part of the reality. However, organising a set of data in an informative way is not an easy task, especially, if we want to capture the viewer’s attention and to present the…

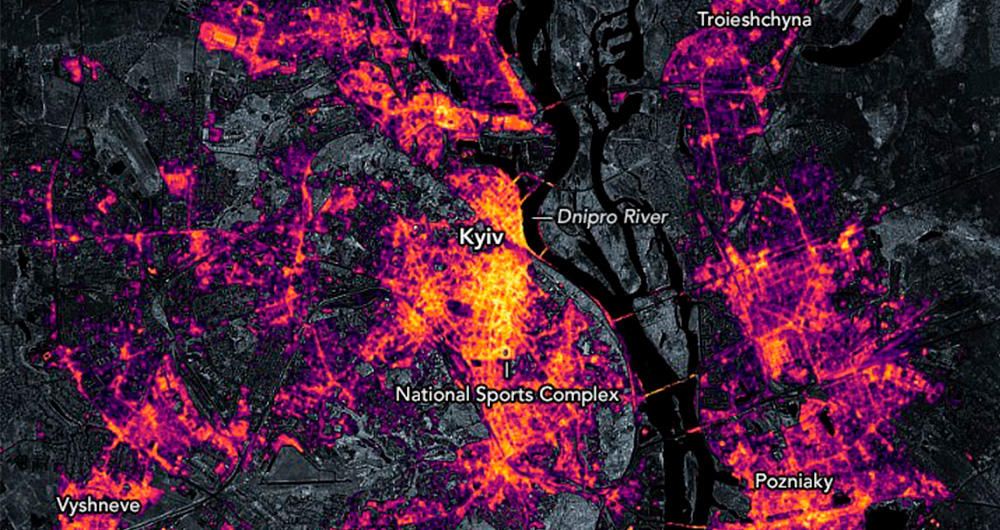
Collecting and analysing data to improve humanitarian assistance and restore damage during the Ukrainian war
On 24 February Europe entered a scenario that not even the data could have predicted: Russia invaded Ukraine, unleashing the first war on European soil so far in the 21st century.
Almost five months later, on 26 September, the United Nations (UN) published its official figures: 4,889 dead and 6,263…
How open data can help in the refugee crisis
According to the United Nations Agency for Refugees (UNHCR), we are currently witnessing the highest levels of displacement of people registered in recent history. In 2019, it is estimated that more than 70 million people have been forced to leave their homes, including 25.9 million legal refugees,…
