131 documents found
Good Practices for Measuring the Impact of Open Data in Europe
The Open Data Maturity Study 2022 provides a snapshot of the level of development of policies promoting open data in countries, as well as an assessment of the expected impact of these policies. Among its findings, it highlights that measuring the impact of open data is a priority, but also a major…
- Reports and studies

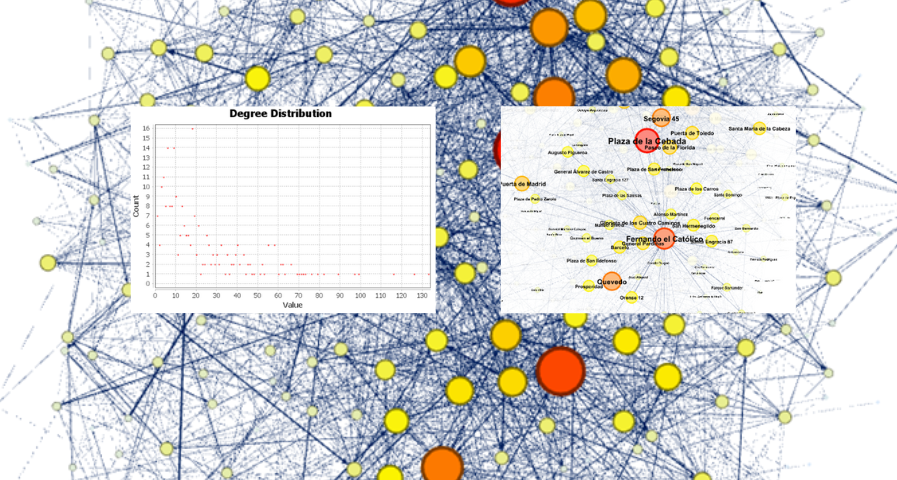
Analysis of travel networks in BICIMAD
1. Introduction
Visualizations are graphical representations of data that allow the information linked to them to be communicated in a simple and effective way. The visualization possibilities are very wide, from basic representations, such as line, bar or sector graphs, to visualizations…
- Data exercises
Open Data and Reuse of Public Sector Information in the Judicial Field: Challenges in Regulation, Use Cases, and Opportunities
The digitalization in the public sector in Spain has also reached the judicial field. The first regulation to establish a legal framework in this regard was the reform that took place through Law 18/2011, of July 5th (LUTICAJ). Since then, there have been advances in the technological modernization…
- Reports and studies

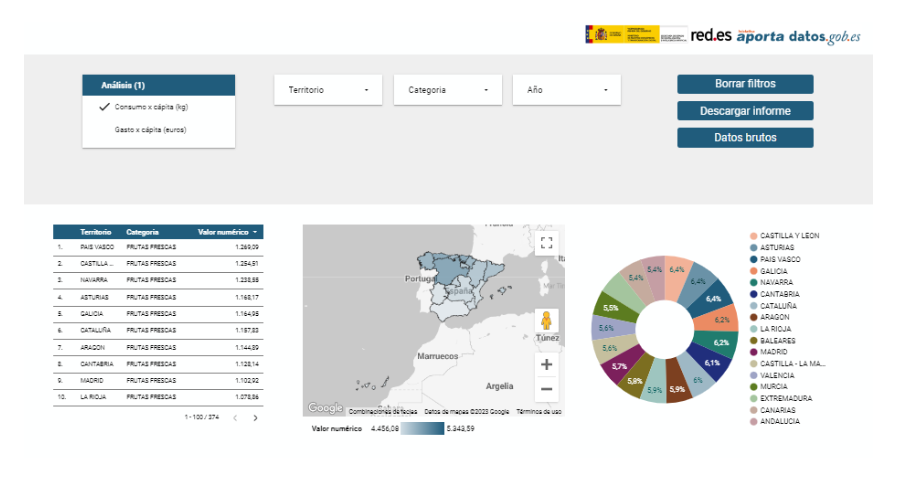
Study on nutrition in spanish homes
1. Introduction
Visualizations are graphical representations of data that allow the information linked to them to be communicated in a simple and effective way. The visualization possibilities are very wide, from basic representations, such as line, bar or sector graphs, to visualizations…
- Data exercises
Datos en tiempo real: Enfoques para integrar fuentes de datos en tiempo real en data.europa.eu
Este informe, que publica el Portal de Datos Europeo, analiza el potencial de reutilización de los datos en tiempo real. Los datos en tiempo real ofrecen información con alta frecuencia de actualización sobre el entorno que nos rodea (por ejemplo, información sobre el tráfico, datos…
- Reports and studies
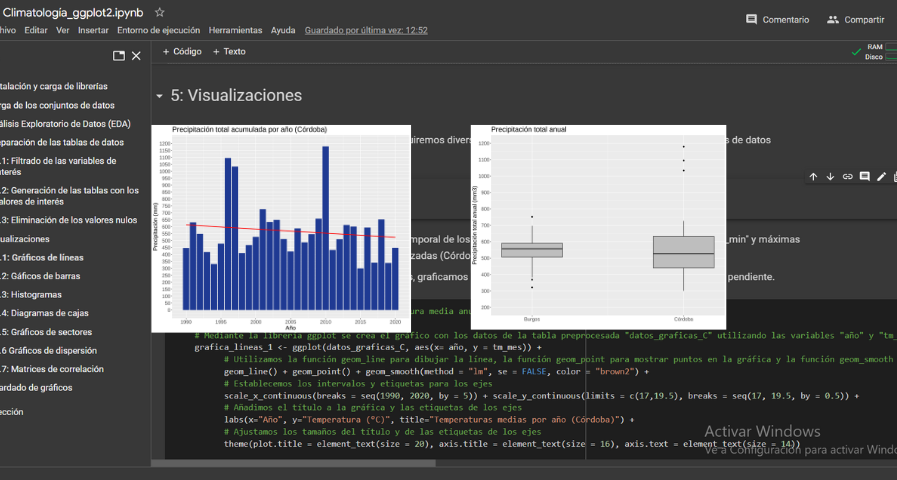
Analysis of meteorological data using the "ggplot2" library
1. Introduction
Visualizations are graphical representations of data that allow the information linked to them to be communicated in a simple and effective way. The visualization possibilities are very wide, from basic representations, such as a line chart, bars or sectors, to visualizations…
- Data exercises
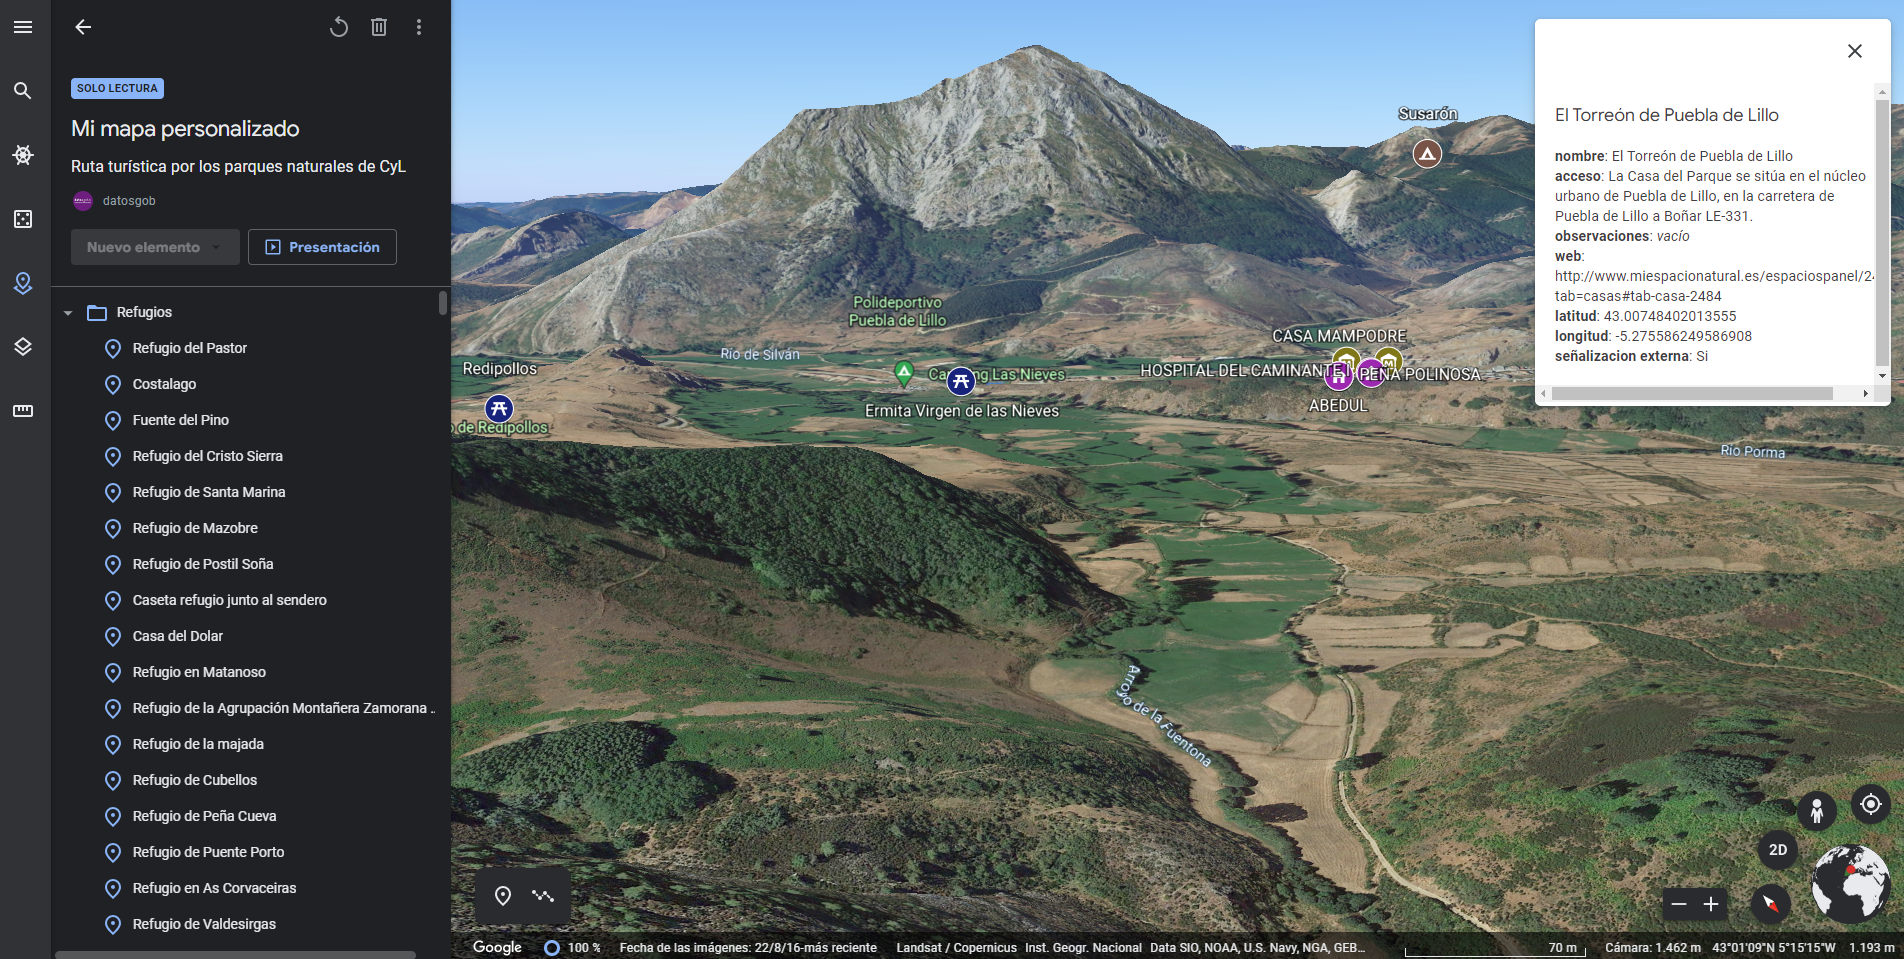
Generating personalized tourist map with "Google My Maps"
1. Introduction
Visualizations are graphical representations of the data allowing to transmit in a simple and effective way related information. The visualization capabilities are extensive, from basic representations, such as a line chart, bars or sectors, to visualizations configured on control…
- Data exercises
Tendencias geoespaciales 2022: Oportunidades para data.europa.eu a partir de las tendencias emergentes en la comunidad geoespacial
Este informe recoge varias temáticas relevantes para la comunidad europea de datos geoespaciales.
Por un lado, el capítulo dedicado a la "modernización INSPIRE y avance hacia los datos abiertos" trata la evaluación realizada por la Comisión Europea de la directiva INSPIRE y cómo ésta debe avanzar…
- Informes y estudios
Analysis of toxicological findings in road traffic accidents
1. Introduction
Visualizations are graphical representations of data that allows comunication in a simple and effective way the information linked to it. The visualization possibilities are very wide, from basic representations, such as a graph of lines, bars or sectors, to visualizations…
- Data exercises

Emerging technologies and open data: introduction to data science applied to image analysis
We present a new report in the series 'Emerging Technologies and Open Data', by Alejandro Alija. The aim of these reports is to help the reader understand how various technologies work, what is the role of open data in them and what impact they will have on our society. This series includes…
- Reports and studies