131 documents found
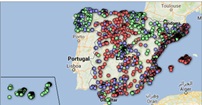
Characterization of the employment demand and registered contracting in Spain
1. Introduction
Data visualization is a task linked to data analysis that aims to represent graphically the underlying information. Visualizations play a fundamental role in data communication, since they allow to draw conclusions in a visual and understandable way, also allowing detection of…
- Data exercises

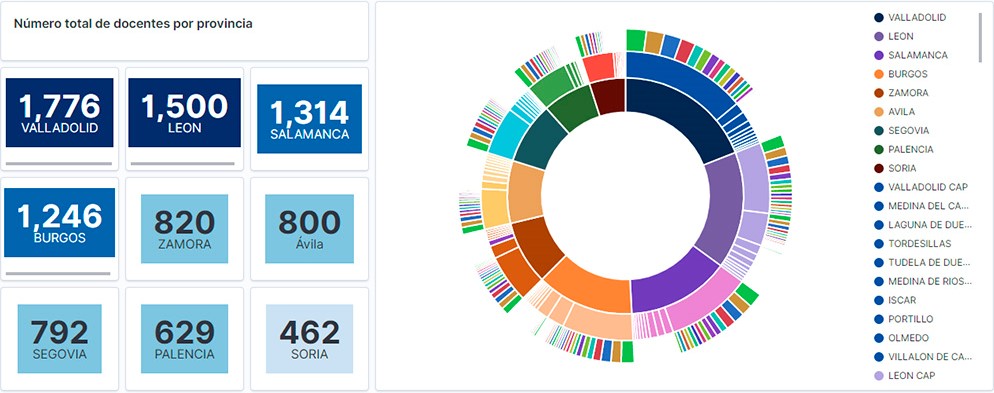
Teachers of public schools in Castilla y León
1. Introduction
Data visualization is a task linked to data analysis that aims to graphically represent underlying data information. Visualizations play a fundamental role in the communication function that data possess, since they allow to drawn conclusions in a visual and understandable way,…
- Data exercises
A practical introductory guide to exploratory data analysis
Before performing data analysis, for statistical or predictive purposes, for example through machine learning techniques, it is necessary to understand the raw material with which we are going to work. It is necessary to understand and evaluate the quality of the data in order to, among other…
- Guides
Tendencias y buenas prácticas en la implementación de políticas de datos abiertos
En esta unidad se recorren y analizan distintas iniciativas open data que tienen como objetivo conseguir la armonización, construir un marco común que permita combinar datos de distintas fuentes. Se describen los principales índices internacionales que monitorizan y valoran las distintas…
- Materiales formativos

Data processing and visualization tools
Visualization is critical for data analysis. It provides a first line of attack, revealing intricate structures in data that cannot be absorbed otherwise. We discover unimaginable effects and question those that have been imagined."
William S. Cleveland (de Visualizing Data, Hobart Press)
Over the…
- Reports and studies
Emerging Technologies and Open Data: Predictive Analytics
In order to extract the full value of data, it is necessary to classify, filter and cross-reference it through analytics processes that help us draw conclusions, turning data into information and knowledge. Traditionally, data analytics is divided into 3 categories:
Descriptive analytics, which…
- Reports and studies

Data-driven education technology to improve learning in the classroom and at home
The pandemic that originated last year has brought about a significant change in the way we see the world and how we relate to it. As far as the education sector is concerned, students and teachers at all levels have been forced to change the face-to-face teaching and learning methodology for a…
- Reports and studies

How to integrate a visualization tool into a data platform
The saying "a picture is worth a thousand words" is a clear example of popular wisdom based on science. 90% of the information we process is visual, thanks to a million nerve fibers that link the eye to the brain and more than 20,000 million neurons that perform the processing of the impulses…
- Guides

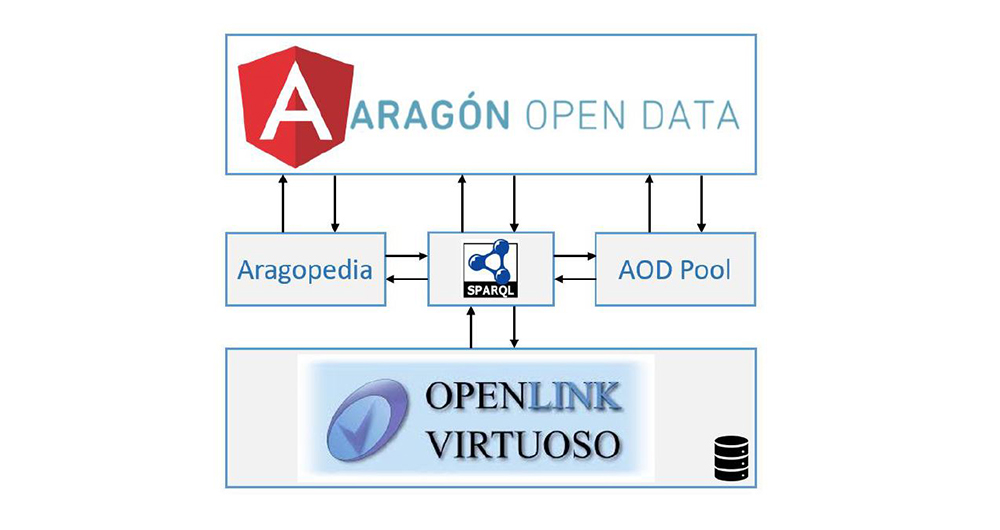
How to implement Linked Data: real case of the Aragon Open Data portal
A large number of different data sources with different contents and formats coexist in an open data portal. It is therefore necessary to provide each file, resource or content on the network with a context or definition that allows people, and also machines, to interpret its meaning. This is where…
- Reports and studies
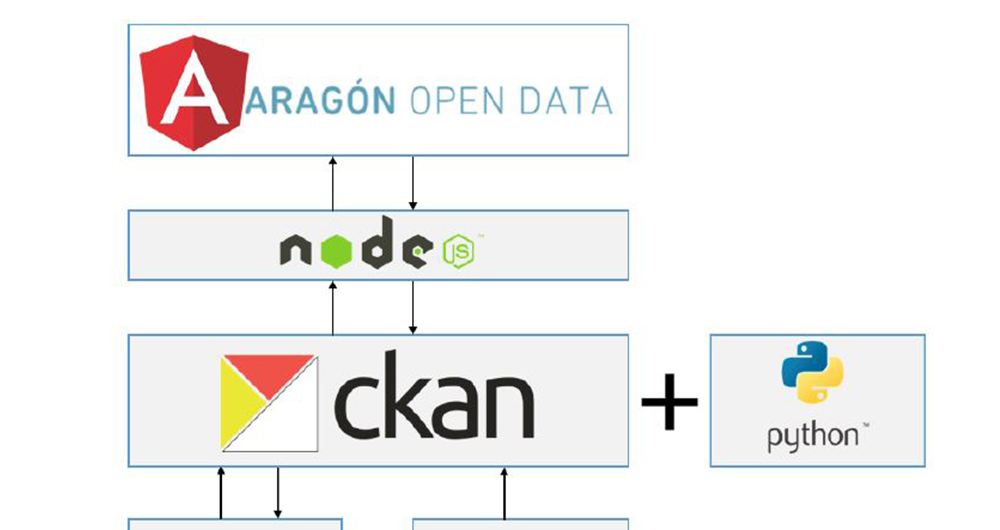
How to implement CKAN: real case of the Aragon Open Data portal
Aragon Open Data is one of the most active open data initiatives on the Spanish scene. In addition to the implementation, management and maintenance of an interoperable data catalogue, since its inception Aragon Open Data has carried out actions to bring the culture of open data closer to citizens…
- Reports and studies