131 documents found
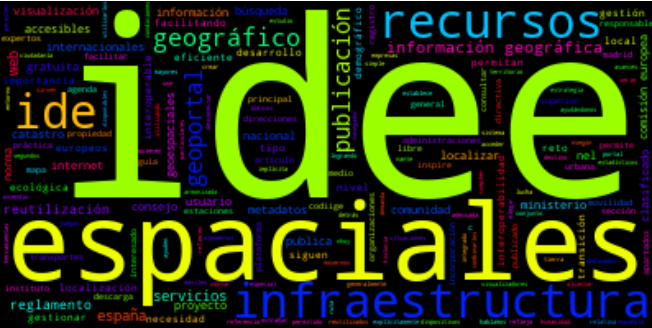
Creating word clouds from the text data with NLP techniques
1. Introduction
Visualizations are a graphic representation that allow us to comprehend in a simple way the information that the data contains. Thanks to visual elements, such as graphs, maps or word clouds, visualizations also help to explain trends, patterns, or outliers that data may present.…
- Data exercises
Help videos for data reusers in datos.gob.es
In a platform such as datos.gob.es, where the frequency of dataset updates is constant, it is necessary to have mechanisms that facilitate massive and automatic queries.
In datos.gob.es we have an API and a SPARQL point to facilitate this task. Both tools allow querying the metadata associated with…
- Guides

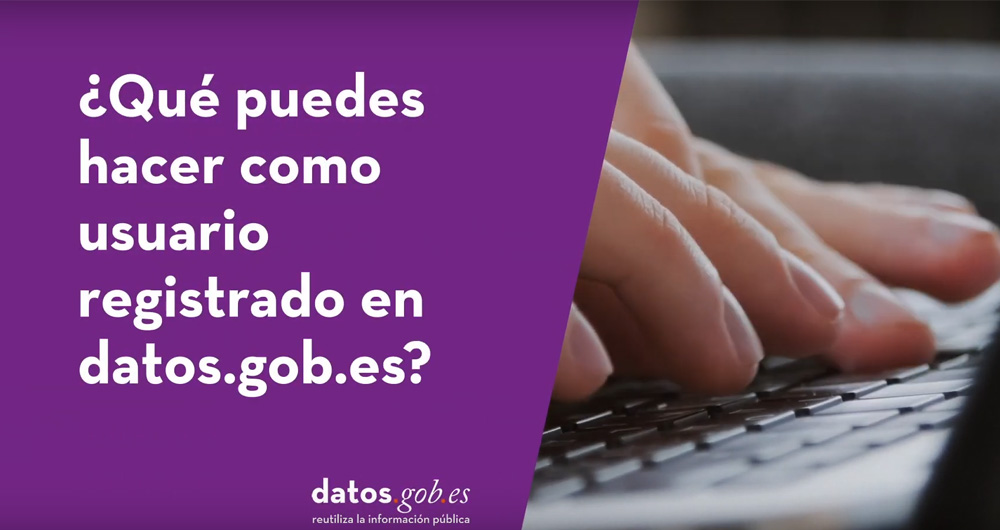
Help videos for data publishers on datos.gob.es
Open data publishers in the National Catalog hosted in datos.gob.es have at their disposal several internal functionalities to easily manage their datasets and everything related to them.
To bring these possibilities closer to the registered users, from datos.gob.es we have prepared a series of…
- Guides
Infographics: Featured strategies and datasets
Discover which are the strategic frameworks that mark the publication and use of open data, as well as the most outstanding datasets at local, regional, national and international level through the various infographics that we will publish periodically.
1. European Health Data Space: objectives and…
- Infographics
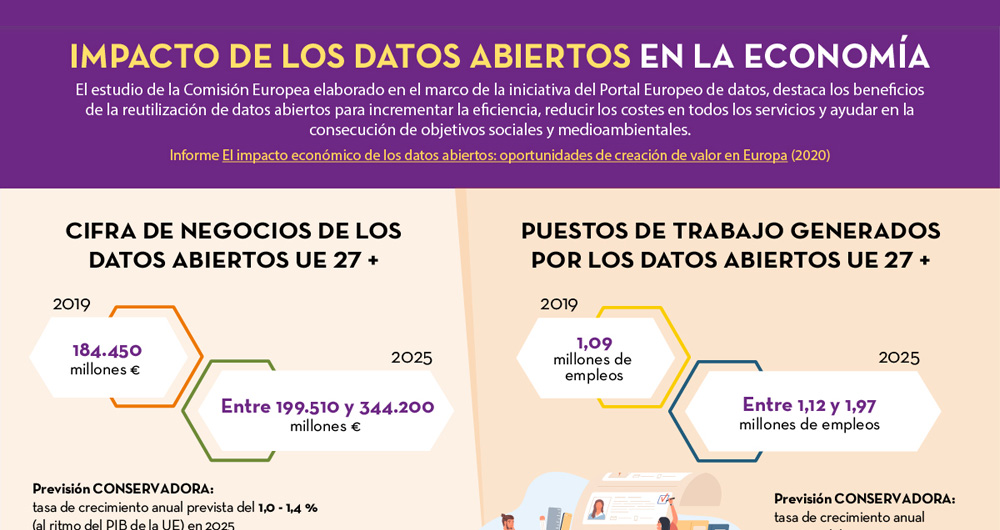
Infographics: Impact and use cases
These infographics show examples of the use of open data in certain sectors, as well as data from studies on its impact. New content will be published periodically.
1. Open Data and Urban Management: Innovative Use Cases
Published: July 2024
Municipal innovation through the use of open data…
- Infographics
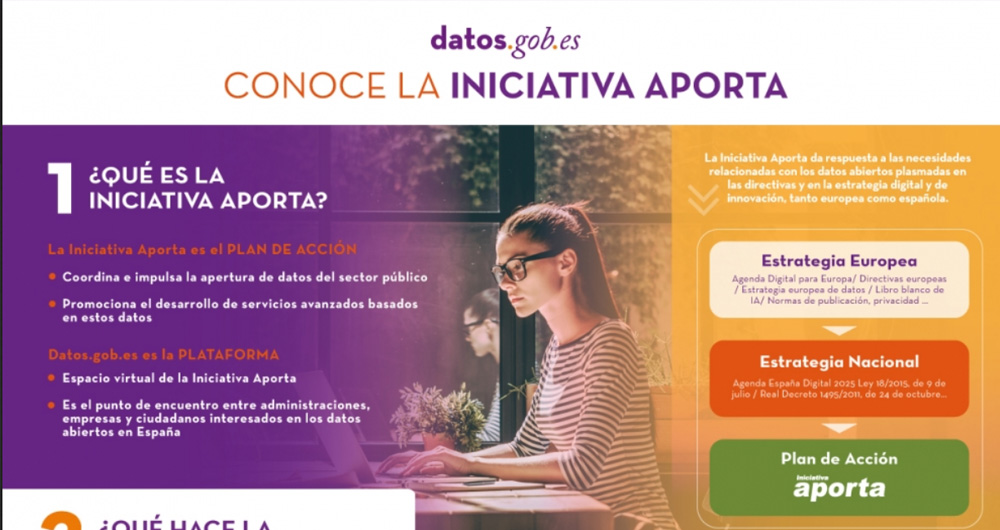
Infographics: The datos.gob.es platform and how it works
Thanks to these infographics you can learn a little more about the activity of datos.gob.es and the functionalities of the platform. New contents will be published periodically.
1. Dissemination of the data culture
Published: January 2023
datos.gob.es offers innovative content on data, open…
- Infographics
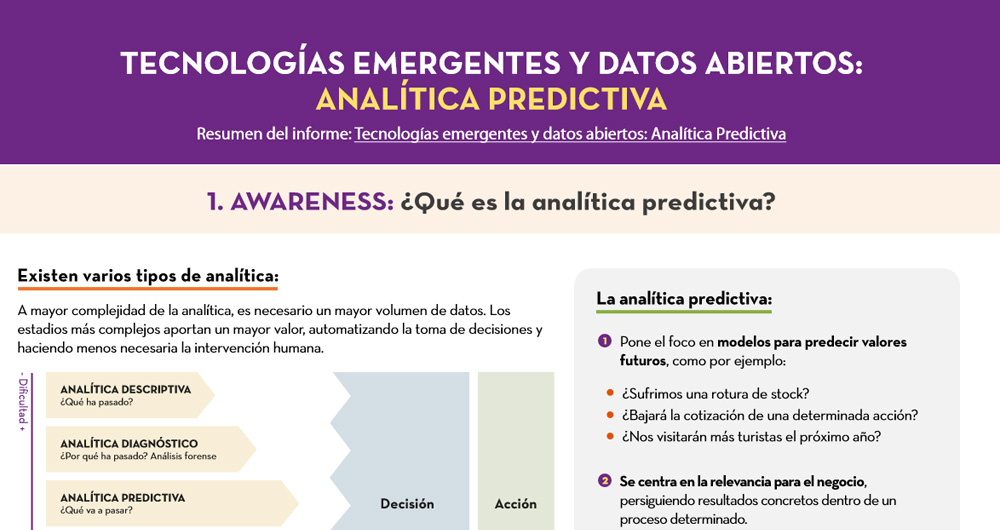
Infographics: Disruptive technologies and open data
Open data can be the basis for various disruptive technologies, such as Artificial Intelligence, which can lead to improvements in society and the economy. These infographics address both tools for working with data and examples of the use of open data in these new technologies. New content will be…
- Infographics
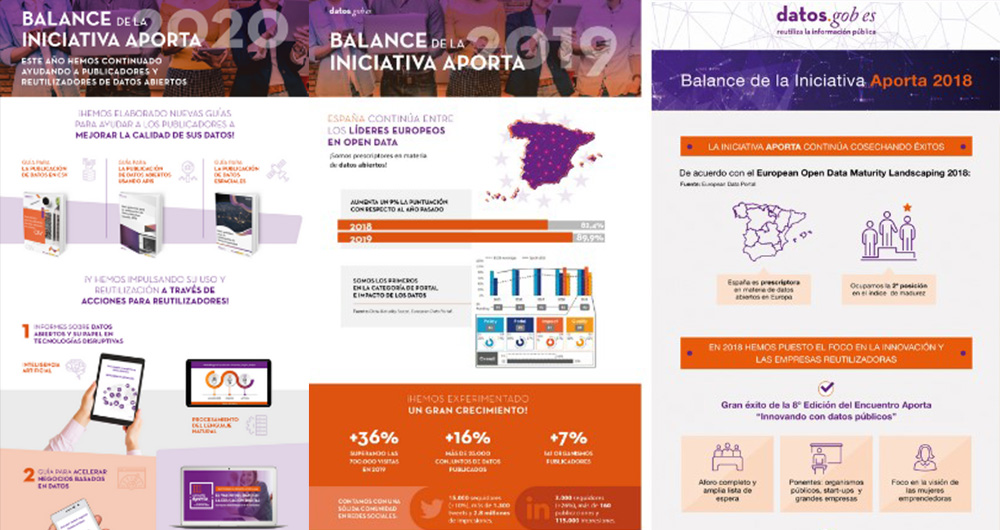
Infographics: Annual balance sheets
At the end of each year, at datos.gob.es we take an overview of the activity carried out during the last 365 days. In these infographics you will find a summary of the actions carried out and the achievements. New content will be published periodically.
Balance of the Aporta Initiative 2024…
- Infographics
Infographics: Aporta Challenges
The Aporta Challenges are awards for new ideas and prototypes that, making use of open data, lead to efficiency improvements in a specific sector of activity. In this section you will find infographics with information about the different editions carried out.
I Aporta challenge: The value of the…
- Infographics
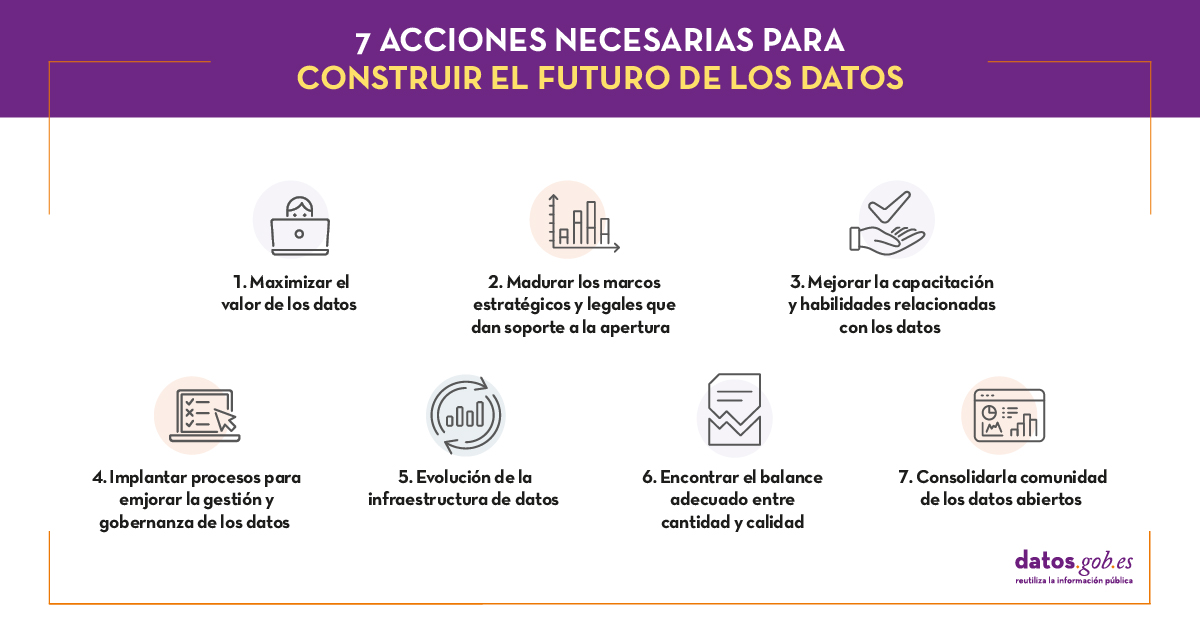
The future of open data
"Information and data are more valuable when they are shared and the opening of government data could allow [...] to examine and use public information in a more transparent, collaborative, efficient and productive way". This was, in general terms, the idea that revolutionized more than ten years…
- Reports and studies