24 documents found
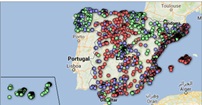
Design and visualize road accident rates using D3.js
Introduction
Every year there are tens of thousands of accidents in Spain, in which thousands of people are injured of varying degrees, and which occur in very different circumstances, both in terms of the type of road and the type of accident.
Many of the statistics related to these parameters are…
- Data exercises

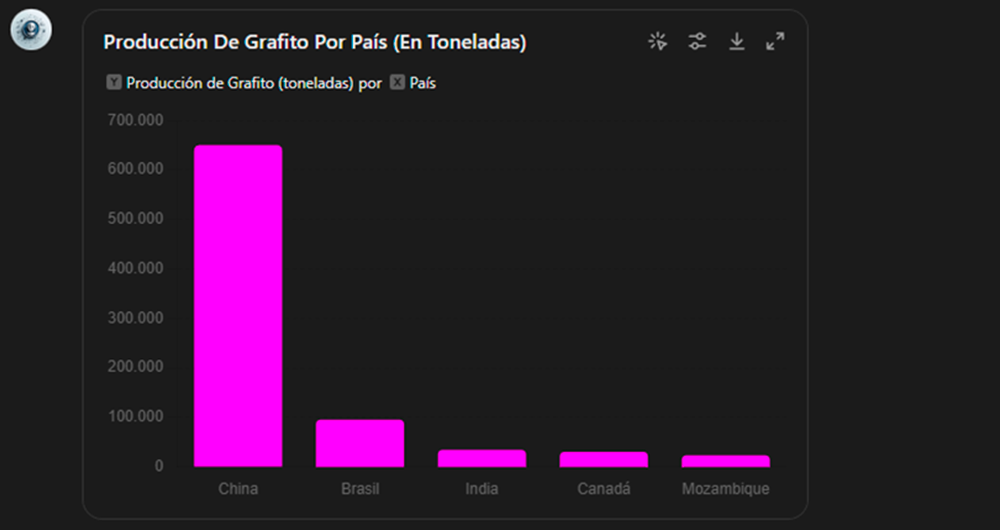
How to Create an Expert Assistant with Open Data: Building GPT to Answer the Critical Minerals Challenge
1. Introduction
In the information age, artificial intelligence has proven to be an invaluable tool for a variety of applications. One of the most incredible manifestations of this technology is GPT (Generative Pre-trained Transformer), developed by OpenAI. GPT is a natural language model…
- Data exercises
Data Visualisation Guide for Local Authorities
The FEMP's Network of Local Entities for Transparency and Citizen Participation has just presented a guide focused on data visualisation. The document, which takes as a reference the Guide to data visualisation developed by the City Council of L'Hospitalet, has been prepared based on the search for…
- Guides
How to facilitate data collaboration to solve societal problems
Data are fundamental to solving the social and economic challenges we face today. It allows us to understand the causes behind a given situation and the factors that influence it, to estimate how it is evolving and to make informed decisions for change.
The problem is that solving such challenges…
- Reports and studies

Infographics: Featured strategies and datasets
Discover which are the strategic frameworks that mark the publication and use of open data, as well as the most outstanding datasets at local, regional, national and international level through the various infographics that we will publish periodically.
European Health Data Space: objectives and…
- Infographics

Infographics: The datos.gob.es platform and how it works
Thanks to these infographics you can learn a little more about the activity of datos.gob.es and the functionalities of the platform. New contents will be published periodically.
What is datos.gob.es?
Published: September 2025
In this infographic, we have summarized the main resources you can…
- Infographics

Infographics: Annual balance sheets
At the end of each year, at datos.gob.es we take an overview of the activity carried out during the last 365 days. In these infographics you will find a summary of the actions carried out and the achievements. New content will be published periodically.
Balance of the Aporta Initiative 2025…
- Infographics

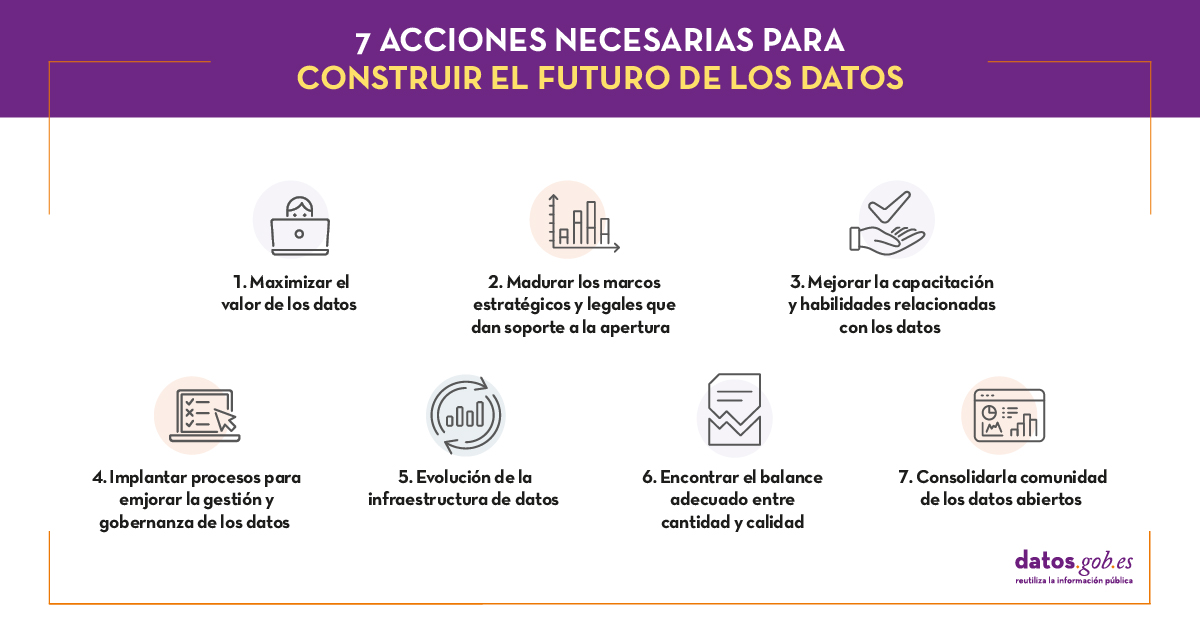
The future of open data
"Information and data are more valuable when they are shared and the opening of government data could allow [...] to examine and use public information in a more transparent, collaborative, efficient and productive way". This was, in general terms, the idea that revolutionized more than ten years…
- Reports and studies
Tendencias y buenas prácticas en la implementación de políticas de datos abiertos
En esta unidad se recorren y analizan distintas iniciativas open data que tienen como objetivo conseguir la armonización, construir un marco común que permita combinar datos de distintas fuentes. Se describen los principales índices internacionales que monitorizan y valoran las distintas…
- Materiales formativos

Data processing and visualization tools
Visualization is critical for data analysis. It provides a first line of attack, revealing intricate structures in data that cannot be absorbed otherwise. We discover unimaginable effects and question those that have been imagined."
William S. Cleveland (de Visualizing Data, Hobart Press)
Over the…
- Reports and studies