7 posts found
How to present open data accessibly
Open data should be inherently accessible, meaning it must be available for free and without barriers that could restrict access and reuse. Accessibility is a fundamental and complex issue because it means that these data sets should not only be available in reusable formats but also that anyone sho…
The importance of the Telco sector in the deployment of a Digital Europe
Building Europe's digital infrastructure of tomorrow
As a global technology race unfolds, Europe is deploying the regulatory framework and investments needed to foster innovation and technological leadership in areas such as online platforms, artificial intelligence, data, cloud, quantum technologie…
Artificial Intelligence applied to the identification and classification of diseases detected by radiodiagnosis
In this post we have described step-by-step a data science exercise in which we try to train a deep learning model with a view to automatically classifying medical images of healthy and sick people.
Diagnostic imaging has been around for many years in the hospitals of develo…
Edge computing and its importance in real-time data management
Autonomous vehicles, smart waste management services, trainers that monitor how much we exercise... We live in an increasingly digital and connected environment, with greater similarities to the future we dreamed of as children. It is the so-called Internet of Things (IoT), a network of physical obj…
Low coding tools for data analysis
The democratisation of technology in all areas is an unstoppable trend. With the spread of smartphones and Internet access, an increasing number of people can access high-tech products and services without having to resort to advanced knowledge or specialists. The world of data is no stranger to thi…
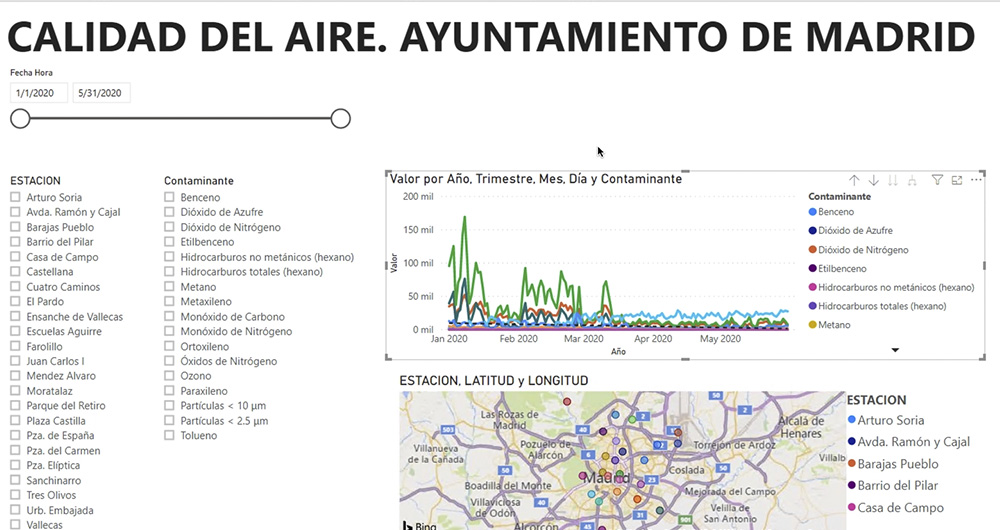
What is an interactive display? Here is an example
The visual representation of data helps our brain to digest large amounts of information quickly and easily. Interactive visualizations make it easier for non-experts to analyze complex situations represented as data.
As we introduced in our last post on this topic, graphical data visualization is a…
How to improve the daily lives of people with disabilities using open data
Close your eyes and try to get on without seeing what is around you. Seat you in a wheelchair and determine if it is easy to access public transport and visit your favourite restaurant.
Perhaps you have not tried to live these experiences, but you could imagine the result. Public administrations are…


