6 posts found
How Google, Moovit and Citymapper reuse open mobility data
Many people use apps to get around in their daily lives. Apps such as Google Maps, Moovit or CityMapper provide the fastest and most efficient route to a destination. However, what many users are unaware of is that behind these platforms lies a valuable source of information: open data. By reusing p…

Data activism: an increasingly relevant practice in the age of platforms
Data activism is an increasingly significant citizen practice in the platform era for its growing contribution to democracy, social justice and rights. It is an activism that uses data and data analysis to generate evidence and visualisations with the aim of revealing injustices, improving peop…

Artificial Intelligence applied to the identification and classification of diseases detected by radiodiagnosis
In this post we have described step-by-step a data science exercise in which we try to train a deep learning model with a view to automatically classifying medical images of healthy and sick people.
Diagnostic imaging has been around for many years in the hospitals of develo…

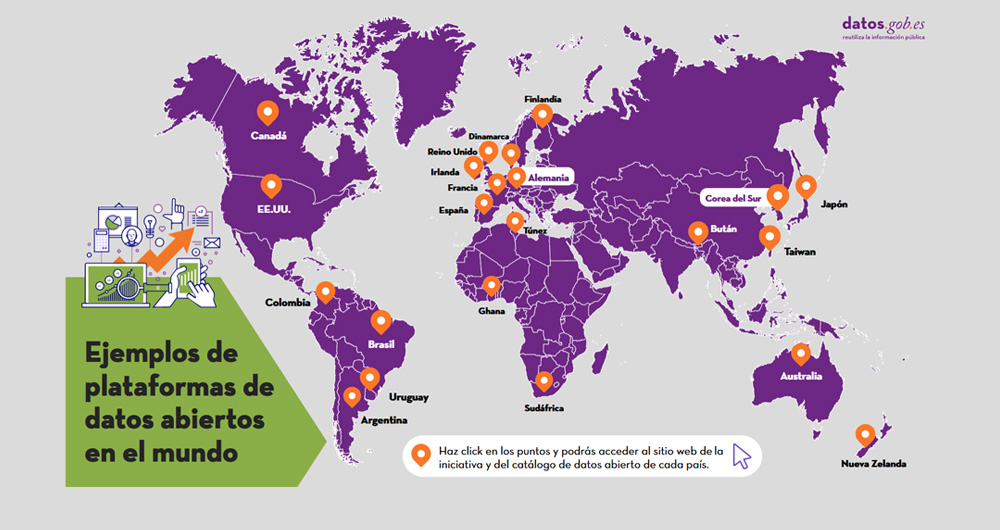
Trends in open data around the world
In view of the series of current and future trends around the future of open data indicated in our report, we wanted to check to what extent these - or similar - trends are already present in the global open data community. To this end, we have verified the current activities and future plans of sev…
Low coding tools for data analysis
The democratisation of technology in all areas is an unstoppable trend. With the spread of smartphones and Internet access, an increasing number of people can access high-tech products and services without having to resort to advanced knowledge or specialists. The world of data is no stranger to thi…

What is an interactive display? Here is an example
The visual representation of data helps our brain to digest large amounts of information quickly and easily. Interactive visualizations make it easier for non-experts to analyze complex situations represented as data.
As we introduced in our last post on this topic, graphical data visualization is a…
