6 posts found
Invisibilisation and algorithmic discrimination
Digital technology and algorithms have revolutionised the way we live, work and communicate. While promising efficiency, accuracy and convenience, these technologies can exacerbate prejudice and social inequalities exacerbate prejudice and social inequalities and create new forms of exclusion and cr…
Artificial Intelligence applied to the identification and classification of diseases detected by radiodiagnosis
In this post we have described step-by-step a data science exercise in which we try to train a deep learning model with a view to automatically classifying medical images of healthy and sick people.
Diagnostic imaging has been around for many years in the hospitals of develo…
The gender gap: inequality is also in the data
Today, 8 March is the day on which we commemorate women's struggle to achieve their full participation in society, as well as giving visibility to the current gender inequality and demanding global action for effective equality of rights in all areas.
However, the data seem to indicate that we still…
Low coding tools for data analysis
The democratisation of technology in all areas is an unstoppable trend. With the spread of smartphones and Internet access, an increasing number of people can access high-tech products and services without having to resort to advanced knowledge or specialists. The world of data is no stranger to thi…
Data vocabularies: why are they important?
Each individual, organization or group uses a number of common words in their daily communication, which would be their personal vocabularies. The greater the number of words we use, the greater our ability to communicate, but it can also be a barrier, increasing the difficulty of understanding othe…
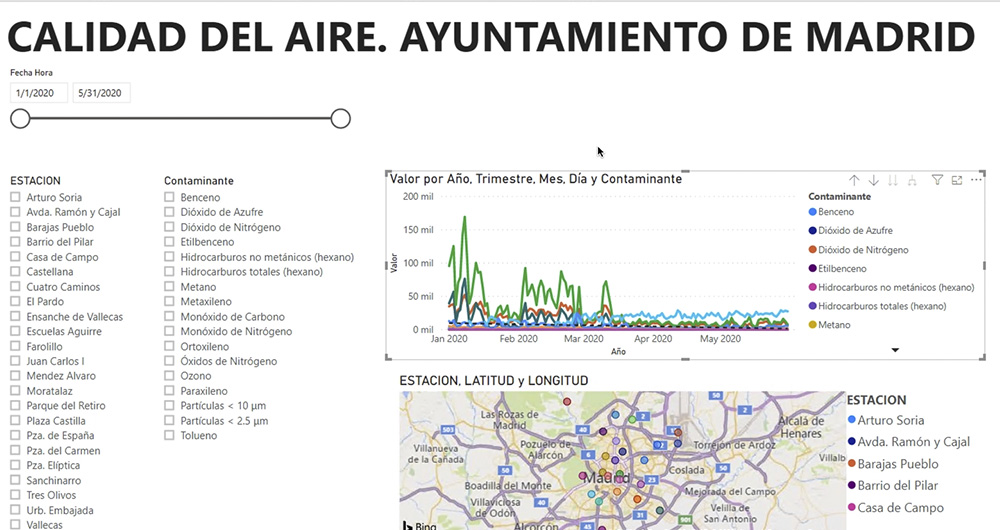
What is an interactive display? Here is an example
The visual representation of data helps our brain to digest large amounts of information quickly and easily. Interactive visualizations make it easier for non-experts to analyze complex situations represented as data.
As we introduced in our last post on this topic, graphical data visualization is a…


