


Documentation
Type
- Reports and studies (25) Apply Reports and studies filter
- Guides (17) Apply Guides filter
- Data science exercises (13) Apply Data science exercises filter
- Training materials (10) Apply Training materials filter
- Infographics (6) Apply Infographics filter
- Regulations and strategies (1) Apply Regulations and strategies filter
Audience
Authorship
- (-) Remove Aporta initiative filter Aporta initiative (72)
Document date
- (-) Remove More than one year filter More than one year (72)
Tag
-
Infographics: The datos.gob.es platform and how it works

Thanks to these infographics you can learn a little more about the activity of datos.gob.es and the functionalities of the platform. New contents will be published periodically. 1. Dissemination of the data culture Published: January 2023...
-
Infographics: Disruptive technologies and open data

Open data can be the basis for various disruptive technologies, such as Artificial Intelligence, which can lead to improvements in society and the economy. These infographics address both tools for working with data and examples of the use of open data...
-
Infographics: Featured strategies and datasets
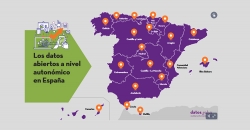
Discover which are the strategic frameworks that mark the publication and use of open data, as well as the most outstanding datasets at local, regional, national and international level through the various infographics that we will publish periodically...
-
The future of open data
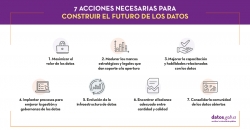
"Information and data are more valuable when they are shared and the opening of government data could allow [...] to examine and use public information in a more transparent, collaborative, efficient and productive way". This was, in general terms, the...
-
How many accidents occur in the city of Madrid?
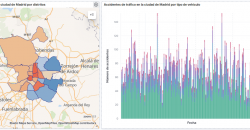
1. Introduction 2. Objetives 3. Resources 3.1. Datasets 3.2. Tools 4. Data processing 5. Visualizations 6. Conclusions 1. Introduction Data visualization is a task linked to data analysis that aims to...
-
Teachers of public schools in Castilla y León
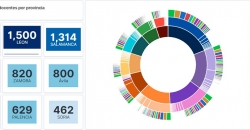
1. Introductionction 2. Objetiveses 3. Resources 3.1. Datasets 3.2. Tools 4. Data processing 5. Visualizationtion 6. Conclusions 1. Introduction Data visualization is a task linked to data analysis that aims to...
-
A practical introductory guide to exploratory data analysis
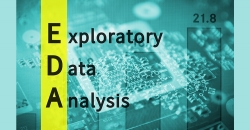
Before performing data analysis, for statistical or predictive purposes, for example through machine learning techniques, it is necessary to understand the raw material with which we are going to work. It is necessary to understand and evaluate the...
-
Characterization of the employment demand and registered contracting in Spain

1. Introductiontion 2. Objetiveses 3. Resources 3.1. Datasets 3.2. Tools 4. Data processing 5. Visualizations 6. Conclusionss 1. Introduction Data visualization is a task linked to data analysis...
-
Data processing and visualization tools
Visualization is critical for data analysis. It provides a first line of attack, revealing intricate structures in data that cannot be absorbed otherwise. We discover unimaginable effects and question those that have been imagined." William S....
-
Data-driven education technology to improve learning in the classroom and at home

The pandemic that originated last year has brought about a significant change in the way we see the world and how we relate to it. As far as the education sector is concerned, students and teachers at all levels have been forced to change the face-to-...


