


Documentation
-
Characteristics of the Spanish University students and most demanded degrees

1. Introduction 2. Objetives 3. Resources 3.1. Datasets 3.2. Tools 4. Data pre-processing 5. Visualizations 6. Conclusions 1. Introduction Visualizations are graphical representations of data that allow to transmit in a...
-
How to deal with a data analysis project?

By analysing data, we can discover meaningful patterns and gain insights that lead to informed decision making. But good data analysis needs to be methodical and follow a series of steps in an orderly fashion. In this video (in Spanish) we give you some...
-
Creating word clouds from the text data with NLP techniques
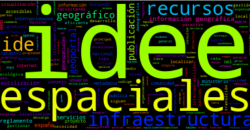
1. Introduction 2. Objetives 3. Resources 3.1. Tools 3.2. Datasets 4. Data processing 5. Creation of the world cloud 6. Conclusions 1. Introduction Visualizations are a graphic representation that allow us to comprehend in...
-
Help videos for data reusers in datos.gob.es

In a platform such as datos.gob.es, where the frequency of dataset updates is constant, it is necessary to have mechanisms that facilitate massive and automatic queries. In datos.gob.es we have an API and a SPARQL point to facilitate this task. Both...
-
How many accidents occur in the city of Madrid?
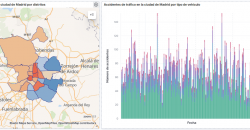
1. Introduction 2. Objetives 3. Resources 3.1. Datasets 3.2. Tools 4. Data processing 5. Visualizations 6. Conclusions 1. Introduction Data visualization is a task linked to data analysis that aims to...
-
Teachers of public schools in Castilla y León
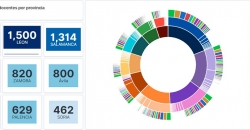
1. Introductionction 2. Objetiveses 3. Resources 3.1. Datasets 3.2. Tools 4. Data processing 5. Visualizationtion 6. Conclusions 1. Introduction Data visualization is a task linked to data analysis that aims to...
-
A practical introductory guide to exploratory data analysis

Before performing data analysis, for statistical or predictive purposes, for example through machine learning techniques, it is necessary to understand the raw material with which we are going to work. It is necessary to understand and evaluate the...
-
Characterization of the employment demand and registered contracting in Spain

1. Introductiontion 2. Objetiveses 3. Resources 3.1. Datasets 3.2. Tools 4. Data processing 5. Visualizations 6. Conclusionss 1. Introduction Data visualization is a task linked to data analysis...
-
Data processing and visualization tools
Visualization is critical for data analysis. It provides a first line of attack, revealing intricate structures in data that cannot be absorbed otherwise. We discover unimaginable effects and question those that have been imagined." William S....
-
Guide to accelerate data-based businesses

The data economy in the European Union exceeded € 375,000 M in 2018, with a growth close to 12% compared to 2017, and it is expected to continue growing to € 555,000 M in 2025. Then, it will reach 4% of the GDP of the EU27. Given this situation, it is...


