


Documentation
Type
- Reports and studies (54) Apply Reports and studies filter
- Guides (39) Apply Guides filter
- Data science exercises (19) Apply Data science exercises filter
- Training materials (11) Apply Training materials filter
- Infographics (7) Apply Infographics filter
- Regulations and strategies (7) Apply Regulations and strategies filter
Audience
Authorship
Document date
Tag
-
How many accidents occur in the city of Madrid?
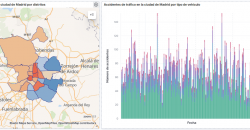
1. Introduction 2. Objetives 3. Resources 3.1. Datasets 3.2. Tools 4. Data processing 5. Visualizations 6. Conclusions 1. Introduction Data visualization is a task linked to data analysis that aims to...
-
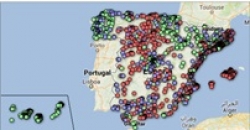
Teachers of public schools in Castilla y León
1. Introductionction 2. Objetiveses 3. Resources 3.1. Datasets 3.2. Tools 4. Data processing 5. Visualizationtion 6. Conclusions 1. Introduction Data visualization is a task linked to data analysis that aims to...
-
A practical introductory guide to exploratory data analysis

Before performing data analysis, for statistical or predictive purposes, for example through machine learning techniques, it is necessary to understand the raw material with which we are going to work. It is necessary to understand and evaluate the...
-
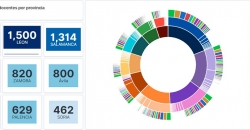
Characterization of the employment demand and registered contracting in Spain

1. Introductiontion 2. Objetiveses 3. Resources 3.1. Datasets 3.2. Tools 4. Data processing 5. Visualizations 6. Conclusionss 1. Introduction Data visualization is a task linked to data analysis...
-
Data processing and visualization tools
Visualization is critical for data analysis. It provides a first line of attack, revealing intricate structures in data that cannot be absorbed otherwise. We discover unimaginable effects and question those that have been imagined." William S....
-
Emerging Technologies and Open Data: Predictive Analytics

In order to extract the full value of data, it is necessary to classify, filter and cross-reference it through analytics processes that help us draw conclusions, turning data into information and knowledge. Traditionally, data analytics is divided into 3...
-
Data-driven education technology to improve learning in the classroom and at home

The pandemic that originated last year has brought about a significant change in the way we see the world and how we relate to it. As far as the education sector is concerned, students and teachers at all levels have been forced to change the face-to-...
-
How to integrate a visualization tool into a data platform

The saying "a picture is worth a thousand words" is a clear example of popular wisdom based on science. 90% of the information we process is visual, thanks to a million nerve fibers that link the eye to the brain and more than 20,000 million neurons...
-
How to implement Linked Data: real case of the Aragon Open Data portal
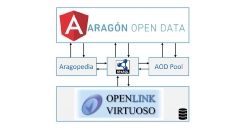
A large number of different data sources with different contents and formats coexist in an open data portal. It is therefore necessary to provide each file, resource or content on the network with a context or definition that allows people, and also...
-
How to implement CKAN: real case of the Aragon Open Data portal
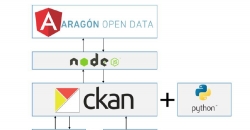
Aragon Open Data is one of the most active open data initiatives on the Spanish scene. In addition to the implementation, management and maintenance of an interoperable data catalogue, since its inception Aragon Open Data has carried out actions to bring...


