Noticia
Spain is taking a key step towards the data economy with the launch of the Data Spaces Kit, an aid programme that will subsidise the integration of public and private entities in sectoral data spaces.
Data spaces are secure ecosystems in which organizations, both public and private, share information in an interoperable way, under common rules and with privacy guarantees. These allow new products to be developed, decision-making to be improved and operational efficiency to be increased, in sectors such as health, mobility or agri-food, among others.
Today, the Ministry for Digital Transformation and Public Function, through the Secretary of State for Digitalisation and Artificial Intelligence, has published in the Official State Gazette the rules governing the granting of aid to entities interested in effectively joining a data space.
This programme, which is called the "Data Spaces Kit", will be managed by Red.es and will subsidise the costs incurred by the beneficiary entities to achieve their incorporation into an eligible data space, i.e. one that meets the requirements set out in the bases, from the day of their publication.
Recipients and Funding
This aid plan is aimed at both public and private entities, as well as Public Administrations. Among the beneficiaries of these grants are the participants, which are those entities that seek to integrate into these ecosystems to share and take advantage of data and services.
For the execution of this plan, the Government has launched aid of up to 60 million euros that will be distributed, depending on the type of entity or the level of integration as follows:
- Private and public entities with economic activity will have an aid of up to €15,000 under the effective incorporation regime or up to €30,000 if they join as a supplier.
- On the other hand, Public Administrations will have funding of up to €25,000 if they are effectively incorporated, or up to €50,000 if they do so as a supplier.
The incorporation of companies from different sectors in the data spaces will generate benefits both at the business level and for the national economy, such as increasing the innovation capacity of the beneficiary companies, the creation of new products and services based on data analysis and the improvement of operational efficiency and decision-making.
The call is expected to be published during the fourth quarter of 2025. The subsidies will be applied for on a non-competitive basis, on a first-come, first-served basis and until the available funds are exhausted.
The publication of these regulatory bases in the Official State Gazette (BOE) aims to boost the data ecosystem in Spain, strengthen the competitiveness of the economy at the global level and consolidate the financial sustainability of innovative business models.
More information:
Regulatory bases in the BOE.
Data Space Reference Center LinkedIn page.
Blog
Imagine a machine that can tell if you're happy, worried, or about to make a decision, even before you know clearly. Although it sounds like science fiction, that future is already starting to take shape. Thanks to advances in neuroscience and technology, today we can record, analyze, and even predict certain patterns of brain activity. The data that is generated from these records is known as neurodata.
In this article we will explain this concept, as well as potential use cases, based on the report "TechDispatch on Neurodata", of the Spanish Data Protection Agency (AEPD).
What is neurodata and how is it collected?
The term neurodata refers to data that is collected directly from the brain and nervous system, using technologies such as electroencephalography (EEG), functional magnetic resonance imaging (fMRI), neural implants, or even brain-computer interfaces. In this sense, its uptake is driven by neurotechnologies.
According to the OECD, neurotechnologies are identified with "devices and procedures that are used to access, investigate, evaluate, manipulate, and emulate the structure and function of neural systems." Neurotechnologies can be invasive (if they require brain-computer interfaces that are surgically implanted in the brain) or non-invasive, with interfaces that are placed outside the body (such as glasses or headbands).
There are also two common ways to collect data:
- Passive collection, where data is captured on a regular basis without the subject having to perform any specific activity.
- Active collection, where data is collected while users perform a specific activity. For example, thinking explicitly about something, answering questions, performing physical tasks, or receiving certain stimuli.
Potential use cases
Once the raw data has been collected, it is stored and processed. The treatment will vary according to the purpose and the intended use of the neurodata.
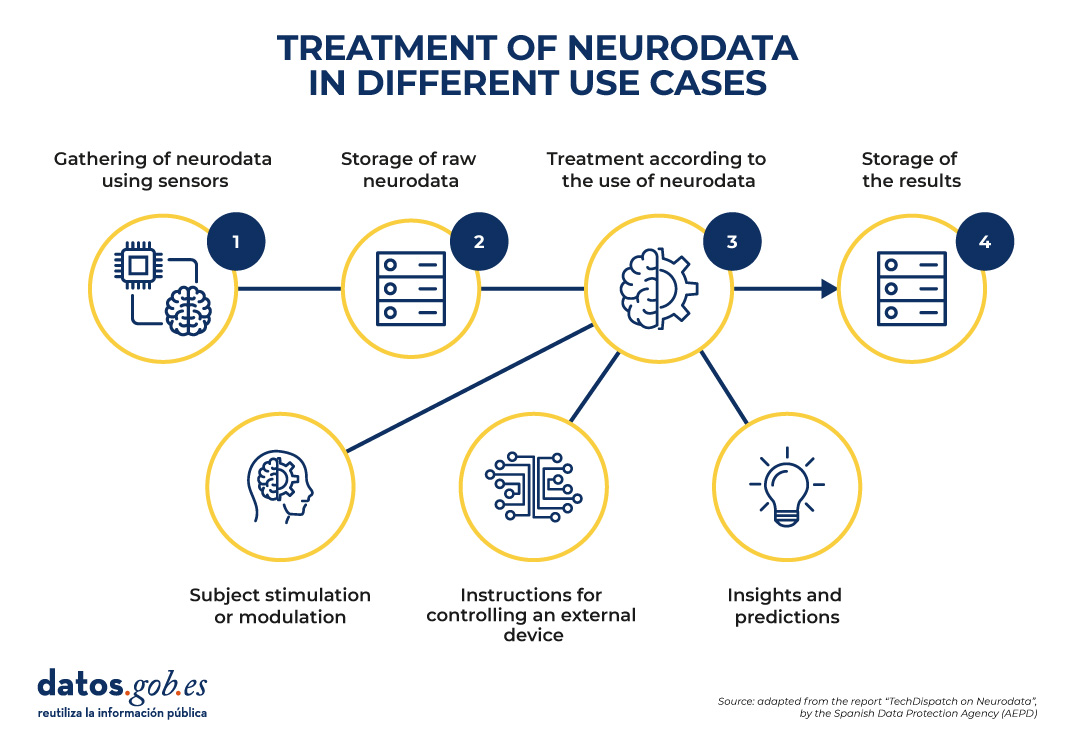
Figure 1. Common structure to understand the processing of neurodata in different use cases. Source: "TechDispatch Report on Neurodata", by the Spanish Data Protection Agency (AEPD).
As can be seen in the image above, the Spanish Data Protection Agency has identified 3 possible purposes:
-
Neurodata processing to acquire direct knowledge and/or make predictions.
Neurodata can uncover patterns that decode brain activity in a variety of industries, including:
-
Health: Neurodata facilitates research into the functioning of the brain and nervous system, making it possible to detect signs of neurological or mental diseases, make early diagnoses, and predict their behavior. This facilitates personalized treatment from very early stages. Its impact can be remarkable, for example, in the fight against Alzheimer's, epilepsy or depression.
-
Education: through brain stimuli, students' performance and learning outcomes can be analyzed. For example, students' attention or cognitive effort can be measured. By cross-referencing this data with other internal (such as student preferences) and external (such as classroom conditions or teaching methodology) aspects, decisions can be made aimed at adapting the pace of teaching.
-
Marketing, economics and leisure: the brain's response to certain stimuli can be analysed to improve leisure products or advertising campaigns. The objective is to know the motivations and preferences that impact decision-making. They can also be used in the workplace, to track employees, learn about their skills, or determine how they perform under pressure.
- Safety and surveillance: Neurodata can be used to monitor factors that affect drivers or pilots, such as drowsiness or inattention, and thus prevent accidents.
-
Neurodata processing to control applications or devices.
As in the previous stage, it involves the collection and analysis of information for decision-making, but it also involves an additional operation: the generation of actions through mental impulses. Let's look at several examples:
-
Orthopaedic or prosthetic aids, medical implants or environment-assisted living: thanks to technologies such as brain-computer interfaces, it is possible to design prostheses that respond to the user's intention through brain activity. In addition, neurodata can be integrated with smart home systems to anticipate needs, adjust the environment to the user's emotional or cognitive states, and even issue alerts for early signs of neurological deterioration. This can lead to an improvement in patients' autonomy and quality of life.
- Robotics: The user's neural signals can be interpreted to control machinery, precision devices or applications without the need to use hands. This allows, for example, a person to operate a robotic arm or a surgical tool simply with their thinking, which is especially valuable in environments where extreme precision is required or when the operator has reduced mobility.
- Video games, virtual reality and metaverse: since neurodata allows software devices to be controlled, brain-computer interfaces can be developed that make it possible to manage characters or perform actions within a game, only with the mind, without the need for physical controls. This not only increases player immersion, but opens the door to more inclusive and personalized experiences.
- Defense: Soldiers can operate weapons systems, unmanned vehicles, drones, or explosive ordnance disposal robots remotely, increasing personal safety and operational efficiency in critical situations.
-
Neurodata treatment for the stimulation or modulation of the subject, achieving neurofeedback.
In this case, signals from the brain (outputs) are used to generate new signals that feed back into the brain (such as inputs), which involves the control of brain waves. It is the most complex field from an ethical point of view, since actions could be generated that the user is not aware of. Some examples are:
-
Psychology: Neurodata has the potential to change the way the brain responds to certain stimuli. They can therefore be used as a therapy method to treat ADHD (Attention Deficit Hyperactivity Disorder), anxiety, depression, epilepsy, autism spectrum disorder, insomnia or drug addiction, among others.
- Neuroenhancement: They can also be used to improve cognitive and affective abilities in healthy people. Through the analysis and personalized stimulation of brain activity, it is possible to optimize functions such as memory, concentration, decision-making or emotional management.
Ethical challenges of the use of neurodata
As we have seen, although the potential of neurodata is enormous, it also poses great ethical and legal challenges. Unlike other types of data, neurodata can reveal deeply intimate aspects of a person, such as their desires, emotions, fears, or intentions. This opens the door to potential misuses, such as manipulation, covert surveillance, or discrimination based on neural features. In addition, they can be collected remotely and acted upon without the subject being aware of the manipulation.
This has generated a debate about the need for new rights, such as neurorights, which seek to protect mental privacy, personal identity and cognitive freedom. Various international organizations, including the European Union, are taking measures to address these challenges and advance in the creation of regulatory and ethical frameworks that protect fundamental rights in the use of neurotechnological technologies. We will soon publish an article that will delve into these aspects.
In conclusion, neurodata is a very promising advance, but not without challenges. Its ability to transform sectors such as health, education or robotics is undeniable, but so are the ethical and legal challenges posed by its use. As we move towards a future where mind and machine are increasingly connected, it is crucial to establish regulatory frameworks that ensure the protection of human rights, especially mental privacy and individual autonomy. In this way, we will be able to harness the full potential of neurodata in a fair, safe and responsible way, for the benefit of society as a whole.
Documentación
Data sharing has become a critical pillar for the advancement of analytics and knowledge exchange, both in the private and public sectors. Organizations of all sizes and industries—companies, public administrations, research institutions, developer communities, and individuals—find strong value in the ability to share information securely, reliably, and efficiently.
This exchange goes beyond raw data or structured datasets. It also includes more advanced data products such as trained machine learning models, analytical dashboards, scientific experiment results, and other complex artifacts that have significant impact through reuse. In this context, the governance of these resources becomes essential. It is not enough to simply move files from one location to another; it is necessary to guarantee key aspects such as access control (who can read or modify a given resource), traceability and auditing (who accessed it, when, and for what purpose), and compliance with regulations or standards, especially in enterprise and governmental environments.
To address these requirements, Unity Catalog emerges as a next-generation metastore, designed to centralize and simplify the governance of data and data-related resources. Originally part of the services offered by the Databricks platform, the project has now transitioned into the open source community, becoming a reference standard. This means that it can now be freely used, modified, and extended, enabling collaborative development. As a result, more organizations are expected to adopt its cataloging and sharing model, promoting data reuse and the creation of analytical workflows and technological innovation.

Figure 1. Image. Source: https://docs.unitycatalog.io/
Access the data lab repository on Github.
Run the data preprocessing code on Google Colab
Objectives
In this exercise, we will learn how to configure Unity Catalog, a tool that helps us organize and share data securely in the cloud. Although we will use some code, each step will be explained clearly so that even those with limited programming experience can follow along through a hands-on lab.
We will work with a realistic scenario in which we manage public transportation data from different cities. We’ll create data catalogs, configure a database, and learn how to interact with the information using tools like Docker, Apache Spark, and MLflow.
Difficulty level: Intermediate.

Figure 2: Unity catalogue schematic
Required Resources
In this section, we’ll explain the prerequisites and resources needed to complete this lab. The lab is designed to be run on a standard personal computer (Windows, macOS, or Linux).
We will be using the following tools and environments:
- Docker Desktop: Docker allows us to run applications in isolated environments called containers. A container is like a "box" that includes everything needed for the application to run properly, regardless of the operating system.
- Visual Studio Code: Our main working environment will be a Python Notebook, which we will run and edit using the widely adopted code editor Visual Studio Code (VS Code).
- Unity Catalog: Unity Catalog is a data governance tool that allows us to organize and control access to resources such as tables, data volumes, functions, and machine learning models. In this lab, we will use its open source version, which can be deployed locally, to learn how to manage data catalogs with permission control, traceability, and hierarchical structure. Unity Catalog acts as a centralized metastore, making data collaboration and reuse more secure and efficient.
- Amazon Web Services (AWS): AWS will serve as our cloud provider to host some of the lab’s data—specifically, raw data files (such as JSON) that we will manage using data volumes. We’ll use the Amazon S3 service to store these files and configure the necessary credentials and permissions so that Unity Catalog can interact with them in a controlled manner
Key Learnings from the Lab
Throughout this hands-on exercise, participants will deploy the application, understand its architecture, and progressively build a data catalog while applying best practices in organization, access control, and data traceability.
Deployment and First Steps
-
We clone the Unity Catalog repository and launch it using Docker.
-
We explore its architecture: a backend accessible via API and CLI, and an intuitive graphical user interface.
- We navigate the core resources managed by Unity Catalog: catalogs, schemas, tables, volumes, functions, and models.
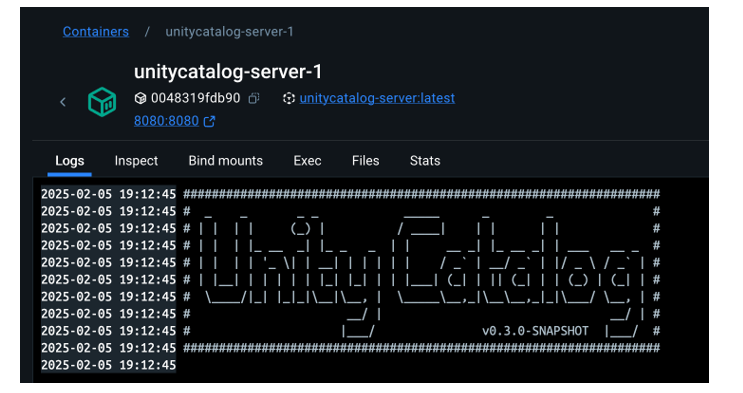
Figure 2. Screenshot
What Will We Learn Here?
How to launch theapplication, understand its core components, and start interacting with it through different interfaces: the web UI, API, and CLI.
Resource Organization
-
We configure an external MySQL database as the metadata repository.
-
We create catalogs to represent different cities and schemas for various public services.

Figure 3. Screenshot
What Will We Learn Here?
How to structure data governance at different levels (city, service, dataset) and manage metadata in a centralized and persistent way.
Data Construction and Real-World Usage
-
We create structured tables to represent routes, buses, and bus stops.
-
We load real data into these tables using PySpark.
-
We set up an AWS S3 bucket as raw data storage (volumes).
- We upload JSON telemetry event files and govern them from Unity Catalog.
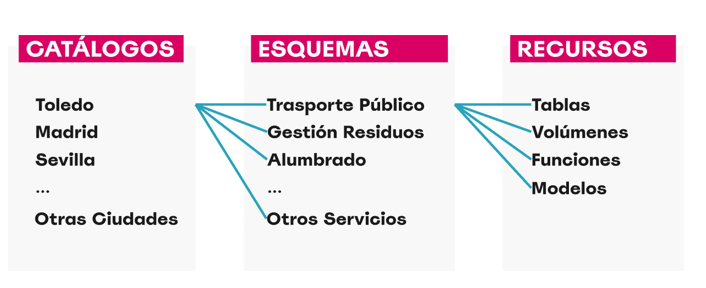
Figure 4. Diagram
What Will We Learn Here?
How to work with different types of data (structured and unstructured), and how to integrate them with external sources like AWS S3.
Reusable Functions and AI Models
-
We register custom functions (e.g., distance calculation) directly in the catalog.
-
We create and register machine learning models using MLflow.
- We run predictions from Unity Catalog just like any other governed resource.
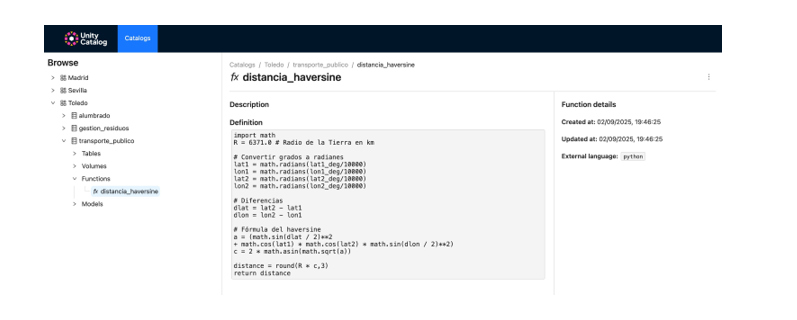
Figure 5. Screenshot
What Will We Learn Here?
How to extend data governance to functions and models, and how to enable their reuse and traceability in collaborative environments.
Results and Conclusions
As a result of this hands-on lab, we gained practical experience with Unity Catalog as an open platform for the governance of data and data-related resources, including machine learning models. We explored its capabilities, deployment model, and usage through a realistic use case and a tool ecosystem similar to what you might find in an actual organization.
Through this exercise, we configured and used Unity Catalog to organize public transportation data. Specifically, you will be able to:
- Learn how to install tools like Docker and Spark.
- Create catalogs, schemas, and tables in Unity Catalog.
- Load data and store it in an Amazon S3 bucket.
- Implement a machine learning model using MLflow.
In the coming years, we will see whether tools like Unity Catalog achieve the level of standardization needed to transform how data resources are managed and shared across industries.
We encourage you to keep exploring data science! Access the full repository here
Content prepared by Juan Benavente, senior industrial engineer and expert in technologies linked to the data economy. The contents and points of view reflected in this publication are the sole responsibility of the author.
Blog
Cities account for more than two-thirds of Europe's population and consume around 80% of energy. In this context, climate change is having a particularly severe impact on urban environments, not only because of their density, but also because of their construction characteristics, their energy metabolism and the scarcity of vegetation in many consolidated areas. One of the most visible and worrying effects is the phenomenon known as urban heat island (UHI).
Heat islands occur when the temperature in urban areas is significantly higher than in nearby rural or peri-urban areas, especially at night. This thermal differential can easily exceed five degrees Celsius under certain conditions. The consequences of this phenomenon go beyond thermal discomfort: it directly affects health, air quality, energy consumption, urban biodiversity and social equity.
In recent years, the availability of open data—especially geospatial data—has made it possible to characterize, map, and analyze urban heat islands with unprecedented accuracy. This article explores how this data can be used to design urban solutions adapted to climate change, with heat island mitigation as its focus.
What are urban heat islands and why do they occur?
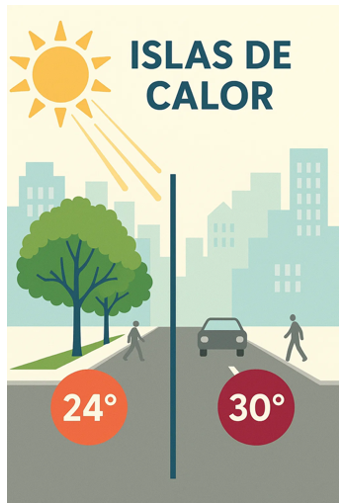
Figure 1. Illustrative element on heat islands.
To intervene effectively in heat islands, it is necessary to know where, when and how they occur. Unlike other natural hazards, the heat island effect is not visible to the naked eye, and its intensity varies depending on the time of day, time of year, and specific weather conditions. It therefore requires a solid and dynamic knowledge base, which can only be built through the integration of diverse, up-to-date and territorialized data.
At this point, open geospatial data is a critical tool. Through satellite images, urban maps, meteorological data, cadastral cartography and other publicly accessible sets, it is possible to build urban thermal models, identify critical areas, estimate differential exposures and evaluate the impact of the measures adopted.
The main categories of data that allow us to address the phenomenon of heat islands from a territorial and interdisciplinary perspective are detailed below.
Types of geoespatial data applicable to the study of the phenomenon
1. Earth observation satellite data
Thermal sensors on satellites such as Landsat 8/9 (NASA/USGS) or Sentinel-3 (Copernicus) make it possible to generate urban surface temperature maps with resolutions ranging from 30 to 1,000 metres. Although these images have spatial and temporal limitations, they are sufficient to detect patterns and trends, especially if combined with time series.
This data, accessible through platforms such as the Copernicus Open Access Hub or the USGS EarthExplorer, is essential for comparative studies between cities or for observing the temporal evolution of the same area.
2. Urban weather data
The network of AEMET stations, together with other automatic stations managed by autonomous communities or city councils, allows the evolution of air temperatures in different urban points to be analysed. In some cases, there are also citizen sensors or networks of sensors distributed in the urban space that allow real-time heat maps to be generated with high resolution.
3. Urban mapping and digital terrain models
Digital surface models (DSM), digital terrain models (DTM) and mappings derived from LIDAR allow the study of urban morphology, building density, street orientation, terrain slope and other factors that affect natural ventilation and heat accumulation. In Spain, this data is accessible through the National Center for Geographic Information (CNIG).
4. Land cover and land use databases
Databases such as Corine Land Cover of the Copernicus Programme, or land use maps at the regional level make it possible to distinguish between urbanised areas, green areas, impermeable surfaces and bodies of water. This information is key to calculating the degree of artificialization of an area and its relationship with the heat balance.
5. Inventories of urban trees and green spaces
Some municipalities publish on their open data portals the detailed inventory of urban trees, parks and gardens. These georeferenced data make it possible to analyse the effect of vegetation on thermal comfort, as well as to plan new plantations or green corridors.
6. Socioeconomic and vulnerability data
Data from the National Institute of Statistics (INE), together with the social information systems of autonomous communities and city councils, make it possible to identify the most vulnerable neighbourhoods from a social and economic point of view. Its cross-referencing with thermal data allows a climate justice dimension to be incorporated into decision-making.
Practical applications: how open data is used to act
Once the relevant data has been gathered and integrated, multiple analysis strategies can be applied to support public policies and urban projects with sustainability and equity criteria. Some of the main applications are described below.
· Heat zone mapping and vulnerability maps: Using thermal imagery, weather data, and urban layers together, heat island intensity maps can be generated at the neighborhood or block level. If these maps are combined with social, demographic and public health indicators, it is possible to build thermal vulnerability maps, which prioritize intervention in areas where high temperatures and high levels of social risk intersect. These maps allow, for example:
· Identify priority neighborhoods for urban greening.
· Plan evacuation routes or shaded areas during heat waves.
· Determine the optimal location of climate refuges.
· Assessing the impact of nature-based solutions: Open data also makes it possible to monitor the effects of certain urban actions. For example, using time series of satellite images or temperature sensors, it is possible to assess how the creation of a park or the planting of trees on a street has modified the surface temperature. This ex-post evaluation approach allows justifying public investments, adjusting designs and scaling effective solutions to other areas with similar conditions.
· Urban modelling and climate simulations: three-dimensional urban models, built from open LIDAR data or cadastral mapping, make it possible to simulate the thermal behaviour of a neighbourhood or city under different climatic and urban scenarios. These simulations, combined with tools such as ENVI-met or Urban Weather Generator, are essential to support decision-making in urban planning.
Existing studies and analysis on urban heat islands: what has been done and what we can learn
During the last decade, multiple studies have been carried out in Spain and Europe that show how open data, especially geospatial data, allow the phenomenon of urban heat islands to be characterised and analysed. These works are fundamental not only because of their specific results, but also because they illustrate replicable and scalable methodologies. Some of the most relevant are described below.
Polytechnic University of Madrid study on surface temperature in Madrid
A team from the Department of Topographic Engineering and Cartography of the UPM analysed the evolution of surface temperature in the municipality of Madrid using thermal images from the Landsat 8 satellite in the summer period. The study focused on detecting spatial changes in warmer areas and relating them to land use, urban vegetation and building density.
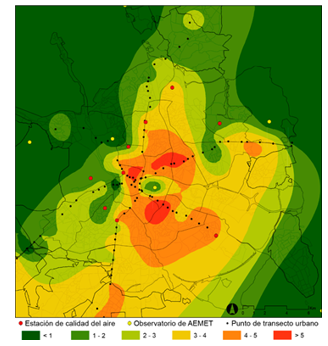
Figure 2. Illustrative image. Source: generated with AI
Methodology:
Remote sensing techniques were applied to extract the surface temperature from the TIRS thermal channel of the Landsat. Subsequently, a statistical analysis of correlation between thermal values and variables such as NDVI (vegetation index), type of land cover (CORINE data) and urban morphology was carried out.
Main results:
Areas with higher building density, such as the central and southern neighborhoods, showed higher surface temperatures. The presence of urban parks reduced the temperature of their immediate surroundings by 3 to 5 °C. It was confirmed that the heat island effect intensifies at night, especially during persistent heat waves.
This type of analysis is especially useful for designing urban greening strategies and for justifying interventions in vulnerable neighbourhoods.
Barcelona Climate Vulnerability Atlas
Barcelona City Council, in collaboration with experts in public health and urban geography, developed a Climate Vulnerability Atlas which includes detailed maps of heat exposure, population sensitivity, and adaptive capacity. The objective was to guide municipal policies against climate change, especially in the field of health and social services.

Figure 3. Image containing fence, exterior, buildings and grass. Source: generated with AI
Methodology:
The atlas was developed by combining open and administrative data at the census tract level. Three dimensions were analysed: exposure (air temperature and surface data), sensitivity (advanced age, density, morbidity) and adaptive capacity (access to green areas, quality of housing, facilities). The indicators were normalized and combined through multi-criteria spatial analysis to generate a climate vulnerability index. The result made it possible to locate the neighbourhoods most at risk from extreme heat and to guide municipal measures.
Main results:
Based on the atlas, the network of "climate shelters" was designed, which includes libraries, civic centers, schools and conditioned parks, activated during episodes of extreme heat. The selection of these spaces was based directly on the atlas data.
Multitemporal analysis of the heat island effect in Seville
Researchers from the University of Seville used satellite data from Sentinel-3 and Landsat 8 to study the evolution of the heat island phenomenon in the city between 2015 and 2022. The aim was to evaluate the effectiveness of certain urban actions – such as the "Green your neighbourhood" plan – and to anticipate the effects of climate change on the city.
Methodology:
Thermal imaging and NDVI data were used to calculate temperature differences between urban areas and surrounding rural areas. Supervised classification techniques were also applied to identify land uses and their evolution. Open data from tree inventories and urban shade maps were used to interpret the results.
Main results:
Specific renaturation actions have a very positive local impact, but their effect on the city as a whole is limited if they are not integrated into a metropolitan-scale strategy. The study concluded that a continuous network of vegetation and bodies of water is more effective than isolated actions.
European comparison of the Urban Heat Island Atlas (Copernicus) project
Although it is not a Spanish study, the viewer developed by Copernicus for the European Urban Atlas programme offers a comparative analysis between European cities.
Methodology:
The viewer integrates Sentinel-3 thermal imagery, land cover data, and urban mapping to assess the severity of the heat island effect.

Figure 4. Illustration: Infographic showing the main factors causing the urban heat island effect (UHI). Urban areas retain heat due to tall buildings, impermeable surfaces and heat-retaining materials, while green areas are cooler Source: Urban heat islands.
Main results:
This type of tool allows smaller cities to have a first approximation of the phenomenon without the need to develop their own models. As it is based on open and free data, the viewer allows direct consultations by technicians and citizens.
Current limitations and challenges
Despite progress in opening up data, there are still significant challenges:
-
Territorial inequality: not all cities have the same quality and quantity of data.
-
Irregular update: Some sets are released on a one-off basis and are not updated regularly.
-
Low granularity: Data is often aggregated by districts or census tracts, making street-scale interventions difficult.
-
Lack of technical capacities: Many local governments do not have staff specialized in geospatial analysis.
- Little connection with citizens: the knowledge generated from data does not always translate into visible or understandable actions for the population.
Conclusion: building climate resilience from geoespatial data
Urban heat islands are not a new phenomenon, but in the context of climate change they take on a critical dimension. Cities that do not plan based on data will be increasingly exposed to episodes of extreme heat, with unequal impacts among their populations.
Open data—and in particular geospatial data—offers a strategic opportunity to transform this threat into a lever for change. With them we can identify, anticipate, intervene and evaluate. But for this to happen, it is essential to:
· Consolidate accessible, up-to-date and quality data infrastructures.
· To promote collaboration between levels of government, research centres and citizens.
· Train municipal technicians in the use of geospatial tools.
· Promote a culture of evidence-based decision-making and climate sensitivity.
Data does not replace politics, but it allows it to be founded, improved and made more equitable. In a global warming scenario, having open geospatial data is a key tool to make our cities more livable and better prepared for the future.
Content prepared by Mayte Toscano, Senior Consultant in Data Economy Technologies. The contents and points of view reflected in this publication are the sole responsibility of the author.
Blog
Sport has always been characterized by generating a lot of data, statistics, graphs... But accumulating figures is not enough. It is necessary to analyze the data, draw conclusions and make decisions based on it. The advantages of sharing data in this sector go beyond mere sports, having a positive impact on health and the economic sphere. they go beyond mere sports, having a positive impact on health and the economic sphere.
Artificial intelligence (AI) has also reached the professional sports sector and its ability to process huge amounts of data has opened the door to making the most of the potential of all that information. Manchester City, one of the best-known football clubs in the British Premier League, was one of the pioneers in using artificial intelligence to improve its sporting performance: it uses AI algorithms for the selection of new talent and has collaborated in the development of WaitTime, an artificial intelligence platform that manages the attendance of crowds in large sports and leisure venues. In Spain, Real Madrid, for example, incorporated the use of artificial intelligence a few years ago and promotes forums on the impact of AI on sport.
Artificial intelligence systems analyze extensive volumes of data collected during training and competitions, and are able to provide detailed evaluations on the effectiveness of strategies and optimization opportunities. In addition, it is possible to develop alerts on injury risks, allowing prevention measures to be established, or to create personalized training plans that are automatically adapted to each athlete according to their individual needs. These tools have completely changed contemporary high-level sports preparation. In this post we are going to review some of these use cases.
From simple observation to complete data management to optimize results
Traditional methods of sports evaluation have evolved into highly specialized technological systems. Artificial intelligence and machine learning tools process massive volumes of information during training and competitions, converting statistics, biometric data and audiovisual content into strategic insights for the management of athletes' preparation and health.
Real-time performance analysis systems are one of the most established implementations in the sports sector. To collect this data, it is common to see athletes training with bands or vests that monitor different parameters in real time. Both these and other devices and sensors record movements, speeds and biometric data. Heart rate, speed or acceleration are some of the most common data. AI algorithms process this information, generating immediate results that help optimize personalized training programs for each athlete and tactical adaptations, identifying patterns to locate areas for improvement.
In this sense, sports artificial intelligence platforms evaluate both individual performance and collective dynamics in the case of team sports. To evaluate the tactical area, different types of data are analyzed according to the sports modality. In endurance disciplines, speed, distance, rhythm or power are examined, while in team sports data on the position of the players or the accuracy of passes or shots are especially relevant.
Another advance is AI cameras, which allow you to follow the trajectory of players on the field and the movements of different elements, such as the ball in ball sports. These systems generate a multitude of data on positions, movements and patterns of play. The analysis of these historical data sets allows us to identify strategic strengths and vulnerabilities both our own and those of our opponents. This helps to generate different tactical options and improve decision-making before a competition.
Health and well-being of athletes
Sports injury prevention systems analyze historical data and metrics in real-time. Its algorithms identify injury risk patterns, allowing personalized preventive measures to be taken for each athlete. In the case of football, teams such as Manchester United, Liverpool, Valencia CF and Getafe CF have been implementing these technologies for several years.
In addition to the data we have seen above, sports monitoring platforms also record physiological variables continuously: heart rate, sleep patterns, muscle fatigue and movement biomechanics. Wearable devices with artificial intelligence capabilities detect indicators of fatigue, imbalances, or physical stress that precede injuries. With this data, the algorithms predict patterns that detect risks and make it easier to act preventively, adjusting training or developing specific recovery programs before an injury occurs. In this way, training loads, rep volume, intensity and recovery periods can be calibrated according to individual profiles. This predictive maintenance for athletes is especially relevant for teams and clubs in which athletes are not only sporting assets, but also economic ones. In addition, these systems also optimise sports rehabilitation processes, reducing recovery times in muscle injuries by up to 30% and providing predictions on the risk of relapse.
While not foolproof, the data indicates that these platforms predict approximately 50% of injuries during sports seasons, although they cannot predict when they will occur. The application of AI to healthcare in sport thus contributes to the extension of professional sports careers, facilitating optimal performance and the athlete's athletic well-being in the long term.
Improving the audience experience
Artificial intelligence is also revolutionizing the way fans enjoy sport, both in stadiums and at home. Thanks to natural language processing (NLP) systems, viewers can follow comments and subtitles in real time, facilitating access for people with hearing impairments or speakers of other languages. Manchester City has recently incorporated this technology for the generation of real-time subtitles on the screens of its stadium. These applications have also reached other sports disciplines: IBM Watson has developed a functionality that allows Wimbledon fans to watch the videos with highlighted commentary and AI-generated subtitles.
In addition, AI optimises the management of large capacities through sensors and predictive algorithms, speeding up access, improving security and customising services such as seat locations. Even in broadcasts, AI-powered tools offer instant statistics, automated highlights, and smart cameras that follow the action without human intervention, making the experience more immersive and dynamic. The NBA uses Second Spectrum, a system that combines cameras with AI to analyze player movements and create visualizations, such as passing routes or shot probabilities. Other sports, such as golf or Formula 1, also use similar tools that enhance the fan experience.
Data privacy and other challenges
The application of AI in sport also poses significant ethical challenges. The collection and analysis of biometric information raises doubts about the security and protection of athletes' personal data, so it is necessary to establish protocols that guarantee the management of consent, as well as the ownership of such data.
Equity is another concern, as the application of artificial intelligence gives competitive advantages to teams and organizations with greater economic resources, which can contribute to perpetuating inequalities.
Despite these challenges, artificial intelligence has radically transformed the professional sports landscape. The future of sport seems to be linked to the evolution of this technology. Its application promises to continue to elevate athlete performance and the public experience, although some challenges need to be overcome.
Blog
Imagine you want to know how many terraces there are in your neighbourhood, how the pollen levels in the air you breathe every day are evolving or whether recycling in your city is working well. All this information exists in your municipality's databases, but it sits in spreadsheets and technical documents that only experts know how to interpret.
This is where open data visualisation initiativescome in: they transform those seemingly cold numbers into stories that anyone can understand at a glance. A colourful graph showing the evolution of traffic on your street, an interactive map showing the green areas of your city, or an infographic explaining how the municipal budget is spent. These tools make public information accessible, useful and, moreover, comprehensible to all citizens.
Moreover, the advantages of this type of solution are not only for the citizens, but also benefit the Administration that carries out the exercise, because it allows:
- Detect and correct data errors.
- Add new sets to the portal.
- Reduce the number of questions from citizens.
- Generate more trust on the part of society.
Therefore, visualising open data brings government closer to citizens, facilitates informed decision-making, helps public administrations to improve their open data offer and creates a more participatory society where we can all better understand how the public sector works. In this post, we present some examples of open data visualisation initiatives in regional and municipal open data portals.
Visualiza Madrid: bringing data closer to the public
Madrid City Council's open data portal has developed the initiative "Visualiza Madrid", a project born with the specific objective of making open data and its potential reach the general public , transcending specialised technical profiles. As Ascensión Hidalgo Bellota, Deputy Director General for Transparency of Madrid City Council, explained during the IV National Meeting on Open Data, "this initiative responds to the need to democratise access to public information".
Visualiza Madrid currently has 29 visualisations that cover different topics of interest to citizens, from information on hotel and restaurant terraces to waste management and urban traffic analysis. This thematic diversity demonstrates the versatility of visualisations as a tool for communicating information from very diverse sectors of public administration.
In addition, the initiative has received external recognition this year through the Audaz 2,025 Awards, an initiative of the Spanish chapter of the Open Government Academic Network (RAGA Spain).The initiative has also received external recognition through the Audaz 2,025 Awards.
Castilla y León: comprehensive analysis of regional data
The Junta de Castilla y León has also developed a portal specialised in analysis and visualisations that stands out for its comprehensive approach to the presentation of regional data. Its visualisation platform offers a systematic approach to the analysis of regional information, allowing users to explore different dimensions of the reality of Castilla y Leónthrough interactive and dynamic tools.
This initiative allows complex information to be presented in a structured and understandable way, facilitating both academic analysis and citizen use of the data. The platform integrates different sources of regional information, creating a coherent ecosystem of visualisations that provides a panoramic view of different aspects of regional management. Among the topics it offers are data on tourism, the labour market and budget execution. All the visualisations are made with open data sets from the regional portal of Castilla y León .
The Castilla y León approach demonstrates how visualisations can serve as a tool for territorial analysis, providing valuable insights on economic, social and demographic dynamics that are fundamental for the planning and evaluation of regional public policies.
Canary Islands: technological integration with interactive widgets .
On the other hand, the Government of the Canary Islands has opted for an innovative strategy through the implementation of widgets that allow the integration of open data visualisations of the Instituto Canario de Estadística (ISTAC) in different platforms and contexts. This technological approach represents a qualitative leap in the distribution and reuse of public data visualisations.
The widgets developed by the Canary Islands make it easier for third parties to embed official visualisations in their own applications, websites or analyses, exponentially expanding the scope and usefulness of Canary Islands open data. This strategy not only multiplies the points of access to public information, but also fosters the creation of a collaborative ecosystem where different actors can benefit from and contribute to the value of open data.
The Canarian initiative illustrates how technology can be used to create scalable and flexible solutions that maximise the impact of investments in open data visualisation, establishing a replicable model for other administrations seeking to amplify the reach of their transparency initiatives.
Lessons learned and best practices
By way of example, the cases analysed reveal common patterns that can serve as a guide for future initiatives. The orientation towards the general public, beyond specialised technical users, emerges as an opportunity factor for the success of these platforms. To maintain the interest and relevance of the visualisations, it is important to offer thematic diversity and to update the data regularly.
Technological integration and interoperability, as demonstrated in the case of the Canary Islands, open up new possibilities to maximise the impact of public investments in data visualisation. Likewise, external recognition and participation in professional networks, as evidenced in the case of Madrid, contribute to continuous improvement and the exchange of best practices between administrations.
In general terms, open data visualisation initiatives represent a very valuable opportunity in the transparency and open government strategy of Spanish public administrations. The cases of Madrid, Castilla y León, as well as the Canary Islands, are examples of the enormous potential for transforming public data into tools for citizen empowerment and improved public management.
The success of these initiatives lies in their ability to connect government information with the real needs of citizens, creating bridges of understanding that strengthen the relationship between administration and society. As these experiences mature and consolidate, it will be crucial to keep the focus on the usability, accessibility and relevance of visualisations, ensuring that open data truly delivers on its promise to contribute to a more informed, participatory and democratic society.
Open data visualisation is not just a technical issue, but a strategic opportunity to redefine public communication and strengthen the foundations of a truly open and transparent administration.
Blog
In an increasingly interconnected and complex world, geospatial intelligence (GEOINT) has become an essential tool for defence and security decision-making . The ability to collect, analyse and interpret geospatial data enables armed forces and security agencies to better understand the operational environment, anticipate threats and plan operations more effectively.
In this context, satellite data, classified but also open data, have acquired significant relevance. Programmes such as Copernicus of the European Union provide free and open access to a wide range of Earth observation data, which democratises access to critical information and fosters collaboration between different actors.
This article explores the role of data in geospatial intelligence applied to defence, highlighting its importance, applications and Spain's leadership in this field.
Geospatial intelligence (GEOINT) is a discipline that combines the collection, analysis and interpretation of geospatial data to support decision making in a variety of areas, including defence, security and emergency management. This data may include satellite imagery, remotely sensed information, geographic information system (GIS) data and other sources that provide information on the location and characteristics of the terrain.
In the defence domain, GEOINT enables military analysts and planners to gain a detailed understanding of the operational environment, identify potential threats and plan operations with greater precision. It also facilitates coordination between different units and agencies, improving the effectiveness of joint operations.
Defence application
The integration of open satellite data into geospatial intelligence has significantly expanded defence capabilities. Some of the most relevant applications are presented below:

Figure 1. GEOINT applications in defence. Source: own elaboration
Geospatial intelligence not only supports the military in making tactical decisions, but also transforms the way military, surveillance and emergency response operations are planned and executed. Here we present concrete use cases where GEOINT, supported by open satellite data, has had a decisive impact.
Monitoring of military movements in conflicts
Case. Ukraine War (2,022-2,024)
Organisations such as the EU Satellite Centre (SatCen) and NGOs such as the Conflict Intelligence Team have used Sentinel-1 and Sentinel-2 (Copernicus) imagery for the Conflict Intelligence Team :
- Detect concentrations of Russian troops and military equipment.
- Analyse changes to airfields, bases or logistics routes.
- Support independent verification of events on the ground.
This has been key to EU and NATO decision-making, without the need to resort to classified data.
Maritime surveillance and border control
Case. FRONTEX operations in the Mediterranean
GEOINT powered by Sentinel-1 (radar) and Sentinel-3 (optical + altimeter) allows:
- Identify unauthorised vessels, even under cloud cover or at night.
- Integrate alerts with AIS (automatic ship identification system).
- Coordinate rescue and interdiction operations.
Advantage: Sentinel-1's synthetic aperture radar (SAR) can see through clouds, making it ideal for continuous surveillance.
Support to peace missions and humanitarian aid
Case. Earthquake in Syria/Turkey (2,023)
Open data (Sentinel-2, Landsat-8, PlanetScope free after catastrophe) were used for:
- Detect collapsed areas and assess damage.
- Plan safe access routes.
Coordinate camps and resources with military support.
Spain's role
Spain has demonstrated a significant commitment to the development and application of geospatial intelligence in defence.
|
European Union Satellite Centre (SatCen) |
Project Zeus of the Spanish Army |
Participation in European Programmes | National capacity building |
|
Located in Torrejón de Ardoz, SatCen is a European Union agency that provides geospatial intelligence products and services to support security and defence decision-making. Spain, as host country, plays a central role in SatCen operations. |
The Spanish Army has launched the Zeus project, a technological initiative that integrates artificial intelligence, 5G networks and satellite data to improve operational capabilities. This project aims to create a tactical combat cloud to enable greater interoperability and efficiency in military operations. |
Spain actively participates in European programmes related to Earth observation and geospatial intelligence, such as Copernicus and MUSIS. In addition, it collaborates in bilateral and multilateral initiatives for satellite capacity building and data sharing. |
At the national level, Spain has invested in the development of its own geospatial intelligence capabilities, including the training of specialised personnel and the acquisition of advanced technologies. These investments reinforce the country's strategic autonomy and its ability to contribute to international operations. |
Figure 2. Comparative table of Spain's participation in different satellite projects. Source: own elaboration
Challenges and opportunities
While open satellite data offers many advantages, it also presents certain challenges that need to be addressed to maximise its usefulness in the defence domain.
-
Data quality and resolution: While open data is valuable, it often has limitations in terms of spatial and temporal resolution compared to commercial or classified data. This may affect its applicability in certain operations requiring highly accurate information.
-
Data integration: The integration of data from multiple sources, including open, commercial and classified data, requires systems and processes to ensure interoperability and consistency of information. This involves technical and organisational challenges that must be overcome.
-
Security and confidentiality: The use of open data in defence contexts raises questions about the security and confidentiality of information. It is essential to establish security protocols and measures to protect sensitive information and prevent its misuse.
- Opportunities for collaboration: Despite these challenges, open satellite data offer significant opportunities for collaboration between different actors, including governments, international organisations, the private sector and civil society. Such collaboration can improve the effectiveness of defence operations and contribute to greater global security.
Recommendations for strengthening the use of open data in defence
Based on the above analysis, some key recommendations can be drawn to better exploit the potential of open data:
-
Strengthening open data infrastructures: consolidate national platforms integrating open satellite data for both civilian and military use, with a focus on security and interoperability.
-
Promotion of open geospatial standards (OGC, INSPIRE): Ensure that defence systems integrate international standards that allow the combined use of open and classified sources.
-
Specialised training: foster the development of capabilities in GEOINT analysis with open data, both in the military domain and in collaboration with universities and technology centres.
-
Civil-military cooperation: establish protocols to facilitate the exchange of data between civilian agencies (AEMET, IGN, Civil Protection) and defence actors in crisis or emergency situations.
- Support to R&D&I: to foster research projects exploring the advanced use of open data (e.g. AI applied to Sentinel) with dual applications (civilian and security).
Conclusion
Geospatial intelligence and the use of open satellite data have transformed the way armed forces and security agencies plan and execute their operations. In a context of multidimensional threats and constantly evolving scenarios, having accurate, accessible and up-to-date information is more than an advantage: it is a strategic necessity.
Open data has established itself as a fundamental asset not only because it is free of charge, but also because of its ability to democratise access to critical information, foster transparency and enable new forms of collaboration between military, civilian and scientific actors. In particular:
- Improve the resilience of defence systems by enabling broader, cross-cutting analysis of the operating environment.
- Increase interoperability, as open formats and standards facilitate exchange between countries and agencies.
- They drive innovationby providing startups, research centres and universities with access to quality data that would otherwise be inaccessible.
In this context, Spain has demonstrated a clear commitment to this strategic vision, both through its national institutions and its active role in European programmes such as Copernicus, Galileo and the common defence missions.
Content prepared by Mayte Toscano, Senior Consultant in Data Economy Technologies. The contents and points of view reflected in this publication are the sole responsibility of the author.
Blog
Data is a fundamental resource for improving our quality of life because it enables better decision-making processes to create personalised products and services, both in the public and private sectors. In contexts such as health, mobility, energy or education, the use of data facilitates more efficient solutions adapted to people's real needs. However, in working with data, privacy plays a key role. In this post, we will look at how data spaces, the federated computing paradigm and federated learning, one of its most powerful applications, provide a balanced solution for harnessing the potential of data without compromising privacy. In addition, we will highlight how federated learning can also be used with open data to enhance its reuse in a collaborative, incremental and efficient way.
Privacy, a key issue in data management
As mentioned above, the intensive use of data requires increasing attention to privacy. For example, in eHealth, secondary misuse of electronic health record data could violate patients' fundamental rights. One effective way to preserve privacy is through data ecosystems that prioritise data sovereignty, such as data spaces. A dataspace is a federated data management system that allows data to be exchanged reliably between providers and consumers. In addition, the data space ensures the interoperability of data to create products and services that create value. In a data space, each provider maintains its own governance rules, retaining control over its data (i.e. sovereignty over its data), while enabling its re-use by consumers. This implies that each provider should be able to decide what data it shares, with whom and under what conditions, ensuring compliance with its interests and legal obligations.
Federated computing and data spaces
Data spaces represent an evolution in data management, related to a paradigm called federated computing, where data is reused without the need for data flow from data providers to consumers. In federated computing, providers transform their data into privacy-preserving intermediate results so that they can be sent to data consumers. In addition, this enables other Data Privacy-Enhancing Technologies(Privacy-Enhancing Technologies)to be applied. Federated computing aligns perfectly with reference architectures such as Gaia-X and its Trust Framework, which sets out the principles and requirements to ensure secure, transparent and rule-compliant data exchange between data providers and data consumers.
Federated learning
One of the most powerful applications of federated computing is federated machine learning ( federated learning), an artificial intelligence technique that allows models to be trained without centralising data. That is, instead of sending the data to a central server for processing, what is sent are the models trained locally by each participant.
These models are then combined centrally to create a global model. As an example, imagine a consortium of hospitals that wants to develop a predictive model to detect a rare disease. Every hospital holds sensitive patient data, and open sharing of this data is not feasible due to privacy concerns (including other legal or ethical issues). With federated learning, each hospital trains the model locally with its own data, and only shares the model parameters (training results) centrally. Thus, the final model leverages the diversity of data from all hospitals without compromising the individual privacy and data governance rules of each hospital.
Training in federated learning usually follows an iterative cycle:
- A central server starts a base model and sends it to each of the participating distributed nodes.
- Each node trains the model locally with its data.
- Nodes return only the parameters of the updated model, not the data (i.e. data shuttling is avoided).
- The central server aggregates parameter updates, training results at each node and updates the global model.
- The cycle is repeated until a sufficiently accurate model is achieved.
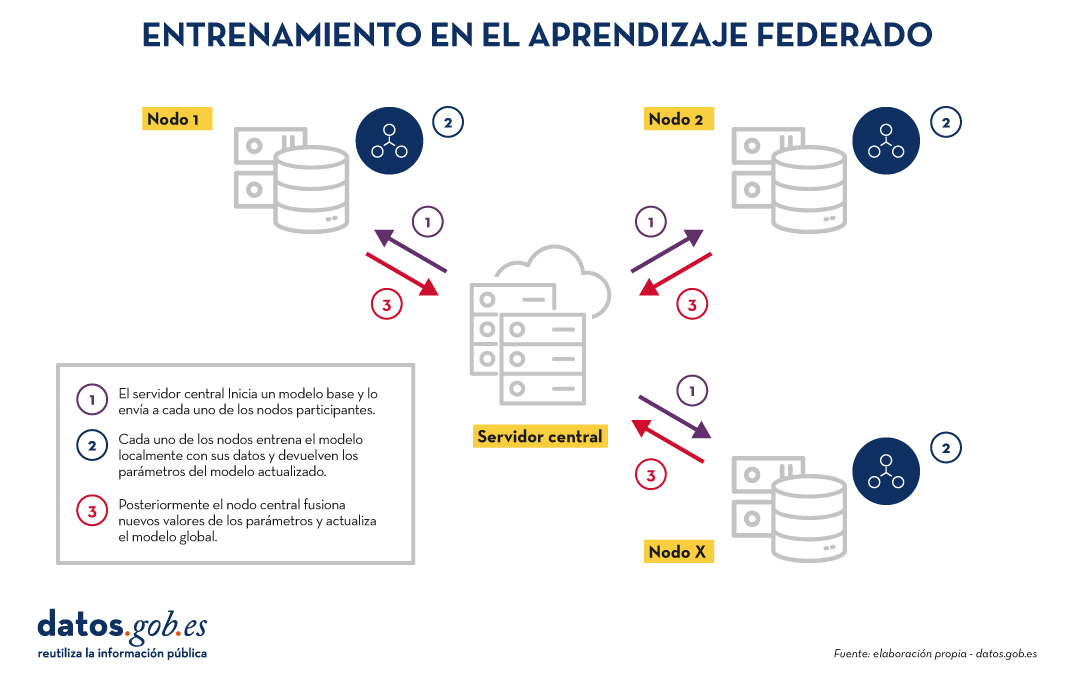
Figure 1. Visual representing the federated learning training process. Own elaboration
This approach is compatible with various machine learning algorithms, including deep neural networks, regression models, classifiers, etc.
Benefits and challenges of federated learning
Federated learning offers multiple benefits by avoiding data shuffling. Below are the most notable examples:
- Privacy and compliance: by remaining at source, data exposure risks are significantly reduced and compliance with regulations such as the General Data Protection Regulation (GDPR) is facilitated.
- Data sovereignty: Each entity retains full control over its data, which avoids competitive conflicts.
- Efficiency: avoids the cost and complexity of exchanging large volumes of data, speeding up processing and development times.
- Trust: facilitates frictionless collaboration between organisations.
There are several use cases in which federated learning is necessary, for example:
- Health: Hospitals and research centres can collaborate on predictive models without sharing patient data.
- Finance: banks and insurers can build fraud detection or risk-sharing analysis models, while respecting the confidentiality of their customers.
- Smart tourism: tourist destinations can analyse visitor flows or consumption patterns without the need to unify the databases of their stakeholders (both public and private).
- Industry: Companies in the same industry can train models for predictive maintenance or operational efficiency without revealing competitive data.
While its benefits are clear in a variety of use cases, federated learning also presents technical and organisational challenges:
- Data heterogeneity: Local data may have different formats or structures, making training difficult. In addition, the layout of this data may change over time, which presents an added difficulty.
- Unbalanced data: Some nodes may have more or higher quality data than others, which may skew the overall model.
- Local computational costs: Each node needs sufficient resources to train the model locally.
- Synchronisation: the training cycle requires good coordination between nodes to avoid latency or errors.
Beyond federated learning
Although the most prominent application of federated computing is federated learning, many additional applications in data management are emerging, such as federated data analytics (federated analytics). Federated data analysis allows statistical and descriptive analyses to be performed on distributed data without the need to move the data to the consumers; instead, each provider performs the required statistical calculations locally and only shares the aggregated results with the consumer according to their requirements and permissions. The following table shows the differences between federated learning and federated data analysis.
|
Criteria |
Federated learning |
Federated data analysis |
|
Target |
Prediction and training of machine learning models. | Descriptive analysis and calculation of statistics. |
| Task type | Predictive tasks (e.g. classification or regression). | Descriptive tasks (e.g. means or correlations). |
| Example | Train models of disease diagnosis using medical images from various hospitals. | Calculation of health indicators for a health area without moving data between hospitals. |
| Expected output | Modelo global entrenado. | Resultados estadísticos agregados. |
| Nature | Iterativa. | Directa. |
| Computational complexity | Alta. | Media. |
| Privacy and sovereignty | High | Average |
| Algorithms | Machine learning. | Statistical algorithms. |
Figure 1. Comparative table. Source: own elaboration
Federated learning and open data: a symbiosis to be explored
In principle, open data resolves privacy issues prior to publication, so one would think that federated learning techniques would not be necessary. Nothing could be further from the truth. The use of federated learning techniques can bring significant advantages in the management and exploitation of open data. In fact, the first aspect to highlight is that open data portals such as datos.gob.es or data.europa.eu are federated environments. Therefore, in these portals, the application of federated learning on large datasets would allow models to be trained directly at source, avoiding transfer and processing costs. On the other hand, federated learning would facilitate the combination of open data with other sensitive data without compromising the privacy of the latter. Finally, the nature of a wide variety of open data types is very dynamic (such as traffic data), so federated learning would enable incremental training, automatically considering new updates to open datasets as they are published, without the need to restart costly training processes.
Federated learning, the basis for privacy-friendly AI
Federated machine learning represents a necessary evolution in the way we develop artificial intelligence services, especially in contexts where data is sensitive or distributed across multiple providers. Its natural alignment with the concept of the data space makes it a key technology to drive innovation based on data sharing, taking into account privacy and maintaining data sovereignty.
As regulation (such as the European Health Data Space Regulation) and data space infrastructures evolve, federated learning, and other types of federated computing, will play an increasingly important role in data sharing, maximising the value of data, but without compromising privacy. Finally, it is worth noting that, far from being unnecessary, federated learning can become a strategic ally to improve the efficiency, governance and impact of open data ecosystems.
Jose Norberto Mazón, Professor of Computer Languages and Systems at the University of Alicante. The contents and views reflected in this publication are the sole responsibility of the author.
Documentación
In the current landscape of data analysis and artificial intelligence, the automatic generation of comprehensive and coherent reports represents a significant challenge. While traditional tools allow for data visualization or generating isolated statistics, there is a need for systems that can investigate a topic in depth, gather information from diverse sources, and synthesize findings into a structured and coherent report.
In this practical exercise, we will explore the development of a report generation agent based on LangGraph and artificial intelligence. Unlike traditional approaches based on templates or predefined statistical analysis, our solution leverages the latest advances in language models to:
- Create virtual teams of analysts specialized in different aspects of a topic.
- Conduct simulated interviews to gather detailed information.
- Synthesize the findings into a coherent and well-structured report.
Access the data laboratory repository on Github.
Run the data preprocessing code on Google Colab.
As shown in Figure 1, the complete agent flow follows a logical sequence that goes from the initial generation of questions to the final drafting of the report.

Figure 1. Agent flow diagram.
Application Architecture
The core of the application is based on a modular design implemented as an interconnected state graph, where each module represents a specific functionality in the report generation process. This structure allows for a flexible workflow, recursive when necessary, and with capacity for human intervention at strategic points.
Main Components
The system consists of three fundamental modules that work together:
1. Virtual Analysts Generator
This component creates a diverse team of virtual analysts specialized in different aspects of the topic to be investigated. The flow includes:
- Initial creation of profiles based on the research topic.
- Human feedback point that allows reviewing and refining the generated profiles.
- Optional regeneration of analysts incorporating suggestions.
This approach ensures that the final report includes diverse and complementary perspectives, enriching the analysis.
2. Interview System
Once the analysts are generated, each one participates in a simulated interview process that includes:
- Generation of relevant questions based on the analyst's profile.
- Information search in sources via Tavily Search and Wikipedia.
- Generation of informative responses combining the obtained information.
- Automatic decision on whether to continue or end the interview based on the information gathered.
- Storage of the transcript for subsequent processing.
The interview system represents the heart of the agent, where the information that will nourish the final report is obtained. As shown in Figure 2, this process can be monitored in real time through LangSmith, an open observability tool that allows tracking each step of the flow.

Figure 2. System monitoring via LangGraph. Concrete example of an analyst-interviewer interaction.
3. Report Generator
Finally, the system processes the interviews to create a coherent report through:
- Writing individual sections based on each interview.
- Creating an introduction that presents the topic and structure of the report.
- Organizing the main content that integrates all sections.
- Generating a conclusion that synthesizes the main findings.
- Consolidating all sources used.
The Figure 3 shows an example of the report resulting from the complete process, demonstrating the quality and structure of the final document generated automatically.

Figure 3. View of the report resulting from the automatic generation process to the prompt "Open data in Spain".
What can you learn?
This practical exercise allows you to learn:
Integration of advanced AI in information processing systems:
- How to communicate effectively with language models.
- Techniques to structure prompts that generate coherent and useful responses.
- Strategies to simulate virtual teams of experts.
Development with LangGraph:
- Creation of state graphs to model complex flows.
- Implementation of conditional decision points.
- Design of systems with human intervention at strategic points.
Parallel processing with LLMs:
- Parallelization techniques for tasks with language models.
- Coordination of multiple independent subprocesses.
- Methods for consolidating scattered information.
Good design practices:
- Modular structuring of complex systems.
- Error handling and retries.
- Tracking and debugging workflows through LangSmith.
Conclusions and future
This exercise demonstrates the extraordinary potential of artificial intelligence as a bridge between data and end users. Through the practical case developed, we can observe how the combination of advanced language models with flexible architectures based on graphs opens new possibilities for automatic report generation.
The ability to simulate virtual expert teams, perform parallel research and synthesize findings into coherent documents, represents a significant step towards the democratization of analysis of complex information.
For those interested in expanding the capabilities of the system, there are multiple promising directions for its evolution:
- Incorporation of automatic data verification mechanisms to ensure accuracy.
- Implementation of multimodal capabilities that allow incorporating images and visualizations.
- Integration with more sources of information and knowledge bases.
- Development of more intuitive user interfaces for human intervention.
- Expansion to specialized domains such as medicine, law or sciences.
In summary, this exercise not only demonstrates the feasibility of automating the generation of complex reports through artificial intelligence, but also points to a promising path towards a future where deep analysis of any topic is within everyone's reach, regardless of their level of technical experience. The combination of advanced language models, graph architectures and parallelization techniques opens a range of possibilities to transform the way we generate and consume information.
Blog
The evolution of generative AI has been dizzying: from the first great language models that impressed us with their ability to reproduce human reading and writing, through the advanced RAG (Retrieval-Augmented Generation) techniques that quantitatively improved the quality of the responses provided and the emergence of intelligent agents, to an innovation that redefines our relationship with technology: Computer use.
At the end of April 2020, just one month after the start of an unprecedented period of worldwide home confinement due to the SAR-Covid19 global pandemic, we spread from datos.gob.es the large GPT-2 and GPT-3 language models. OpenAI, founded in 2015, had presented almost a year earlier (February 2019) a new language model that was able to generate written text virtually indistinguishable from that created by a human. GPT-2 had been trained on a corpus (set of texts prepared to train language models) of about 40 GB (Gigabytes) in size (about 8 million web pages), while the latest family of models based on GPT-4 is estimated to have been trained on TB (Terabyte) sized corpora; a thousand times more.
In this context, it is important to talk about two concepts:
- LLLMs (Large Language Models ): are large-scale language models, trained on vast amounts of data and capable of performing a wide range of linguistic tasks. Today, we have countless tools based on these LLMs that, by field of expertise, are able to generate programming code, ultra-realistic images and videos, and solve complex mathematical problems. All major companies and organisations in the digital-technology sector have embarked on integrating these tools into their different software and hardware products, developing use cases that solve or optimise specific tasks and activities that previously required a high degree of human intervention.
- Agents: The user experience with artificial intelligence models is becoming more and more complete, so that we can ask our interface not only to answer our questions, but also to perform complex tasks that require integration with other IT tools. For example, we not only ask a chatbot for information on the best restaurants in the area, but we also ask them to search for table availability for specific dates and make a reservation for us. This extended user experience is what artificial intelligence agentsprovide us with. Based on the large language models, these agents are able to interact with the outside world (to the model) and "talk" to other services via APIs and programming interfaces prepared for this purpose.
Computer use
However, the ability of agents to perform actions autonomously depends on two key elements: on the one hand, their concrete programming - the functionality that has been programmed or configured for them; on the other hand, the need for all other programmes to be ready to "talk" to these agents. That is, their programming interfaces must be ready to receive instructions from these agents. For example, the restaurant reservation application has to be prepared, not only to receive forms filled in by a human, but also requests made by an agent that has been previously invoked by a human using natural language. This fact imposes a limitation on the set of activities and/or tasks that we can automate from a conversational interface. In other words, the conversational interface can provide us with almost infinite answers to the questions we ask it, but it is severely limited in its ability to interact with the outside world due to the lack of preparation of the rest of computer applications.
This is where Computer use comes in. With the arrival of the Claude 3.5 Sonnet model, Anthropic has introduced Computer use, a beta capability that allows AI to interact directly with graphical user interfaces.
How does Computer use work?
Claude can move your computer cursor as if it were you, click buttons and type text, emulating the way humans operate a computer. The best way to understand how Computer use works in practice is to see it in action. Here is a link directly to the YouTube channel of the specific Computer use section.

Figure 1. Screenshot from Anthropic's YouTube channel, Computer use specific section.
Would you like to try it?
If you've made it this far, you can't miss out without trying it with your own hands.
Here is a simple guide to testing Computer use in an isolated environment. It is important to take into account the security recommendations that Antrophic proposes in its Computer use guidelines. This feature of the Claude Sonet model can perform actions on a computer and this can be potentially dangerous, so it is recommended to carefully review the security warning of Computer use.
All official developer documentation can be found in the antrophic's official Github repository. In this post, we have chosen to run Computer use in a Docker container environment. It is the easiest and safest way to test it. If you don't already have it, you can follow the simple official guidelines to pre-install it on your system.
To reproduce this test we propose to follow this script step by step:.
- Anthropic API Key. To interact with Claude Sonet you need an Anthropic account which you can create for free here. Once inside, you can go to the API Keys section and create a new one for your test
- Once you have your API Key, you must run this command in your terminal, substituting your key where it says "%your_api_key%":

3. If everything went well, you will see these messages in your terminal and now you just have to open your browser and type this url in the navigation bar: htttp://localhost:8080/.
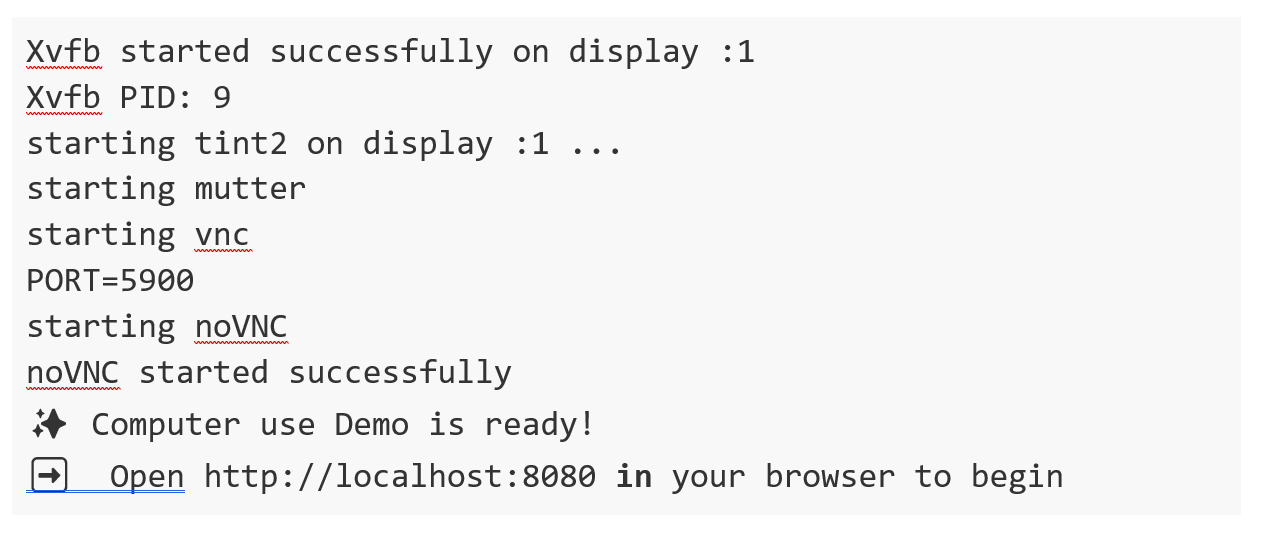
You will see your interface open:

Figure 2. Computer use interface.
You can now go to explore how Computer use works. We suggest the following prompt to get you started:
We suggest you start small. For example, ask them to open a browser and search for something. You can also ask him to give you information about your computer or operating system. Gradually, you can ask for more complex tasks. We have tested this prompt and after several trials we have managed to get Computer use to perform the complete task.
Open a browser, navigate to the datos.gob.es catalogue, use the search engine to locate a dataset on: Public security. Traffic accidents. 2014; Locate the file in csv format; download and open it with free Office.
Potential uses in data platforms such as datos.gob.es
In view of this first experimental version of Computer use, it seems that the potential of the tool is very high. We can imagine how many more things we can do thanks to this tool. Here are some ideas:
- We could ask the system to perform a complete search of datasets related to a specific topic and summarise the main results in a document. In this way, if for example we write an article on traffic data in Spain, we could unattended obtain a list of the main open datasets of traffic data in Spain in the datos.gob.es catalogue.
- In the same way, we could request a summary in the same way, but in this case, not of dataset, but of platform items.
- A slightly more sophisticated example would be to ask Claude, through the conversational interface of Computer use, to make a series of calls to the data API.gob.es to obtain information from certain datasets programmatically. To do this, we open a browser and log into an application such as Postman (remember at this point that Computer use is in experimental mode and does not allow us to enter sensitive data such as user credentials on web pages). We can then ask you to search for information about the datos.gob.es API and execute an http call, taking advantage of the fact that this API does not require authentication.
Through these simple examples, we hope that we have introduced you to a new application of generative AI and that you have understood the paradigm shift that this new capability represents. If the machine is able to emulate the use of a computer as we humans do, unimaginable new opportunities will open up in the coming months.
Content prepared by Alejandro Alija, expert in Digital Transformation and Innovation. The contents and points of view reflected in this publication are the sole responsibility of the author.