Blog
It is possible that our ability to be surprised by new generative artificial intelligence (AI) tools is beginning to wane. The best example is GPT-o1, a new language model with the highest reasoning ability achieved so far, capable of verbalising - something similar to - its own logical processes, but which did not arouse as much enthusiasm at its launch as might have been expected. In contrast to the previous two years, in recent months we have had less of a sense of disruption and have reacted less massively to new developments.
One possible reflection is that we do not need, for now, more intelligence in the models, but to see with our own eyes a landing in concrete uses that make our lives easier: how do I use the power of a language model to consume content faster, to learn something new or to move information from one format to another? Beyond the big general-purpose applications, such as ChatGPT or Copilot, there are free and lesser-known tools that help us think better, and offer AI-based capabilities to discover, understand and share knowledge.
Generate podcasts from a file: NotebookLM
The NotebookLM automated podcasts first arrived in Spain in the summer of 2024 and did raise a significant stir, despite not even being available in Spanish. Following Google's style, the system is simple: simply upload a PDF file as a source to obtain different variations of the content provided by Gemini 2.0 (Google's AI system), such as a summary of the document, a study guide, a timeline or a list of frequently asked questions. In this case, we have used a report on artificial intelligence and democracy published by UNESCO in 2024 as an example.
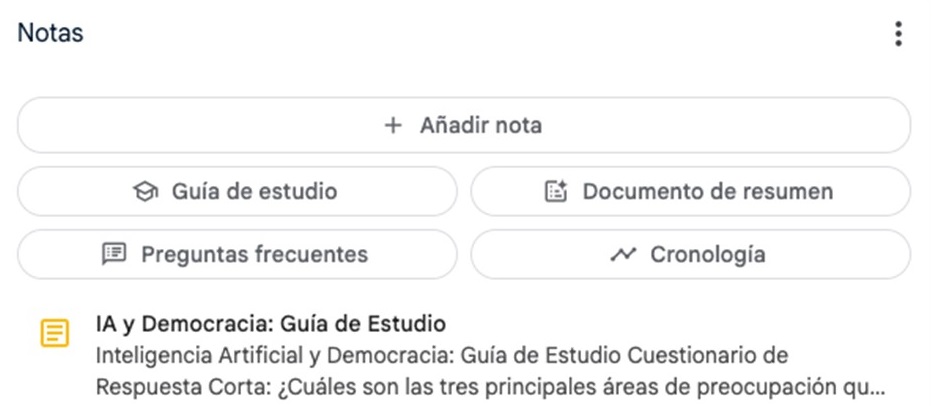
Figure 1. Different summary options in NotebookLM.
While the study guide is an interesting output, offering a system of questions and answers to memorise and a glossary of terms, the star of NotebookLM is the so-called "audio summary": a completely natural conversational podcast between two synthetic interlocutors who comment in a pleasant way on the content of the PDF.

Figure 2. Audio summary in NotebookLM.
The quality of the content of this podcast still has room for improvement, but it can serve as a first approach to the content of the document, or help us to internalise it more easily from the audio while we take a break from screens, exercise or move around.
The trick: apparently, you can't generate the podcast in Spanish, only in English, but you can try with this prompt: "Make an audio summary of the document in Spanish". It almost always works.
Create visualisations from text: Napkin AI
Napkin offers us something very valuable: creating visualisations, infographics and mind maps from text content. In its free version, the system only asks you to log in with an email address. Once inside, it asks us how we want to enter the text from which we are going to create the visualisations. We can paste it or directly generate with AI an automatic text on any topic.
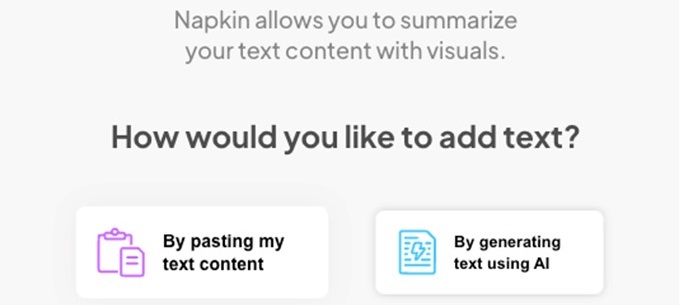
Figure 3. Starting points in Napkin.ai.
In this case, we will copy and paste an excerpt from the UNESCO report which contains several recommendations for the democratic governance of AI. From the text it receives, Napkin.ai provides illustrations and various types of diagrams. We can find from simpler proposals with text organised in keys and quadrants to others illustrated with drawings and icons.
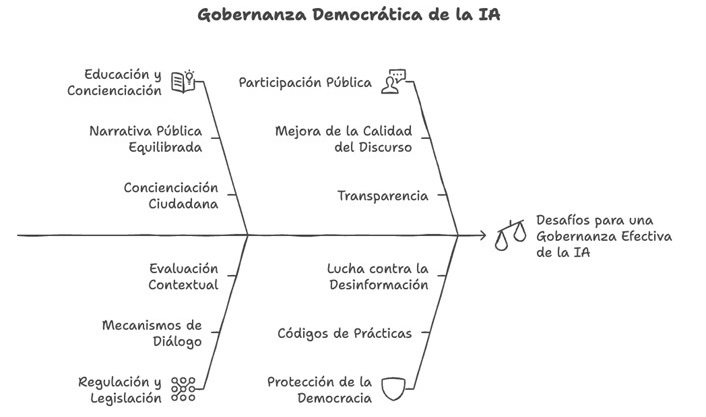
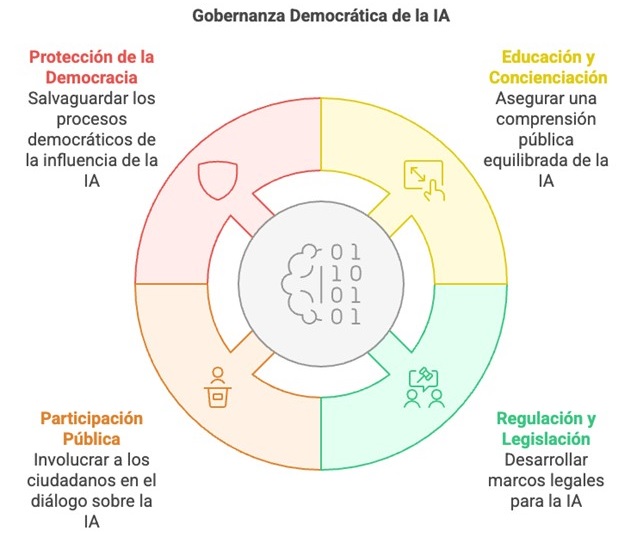
Figure 4. Proposed scheme in Napkin.ai.
Although they are far from the quality of professional infographics, these visualisations can be useful on a personal and learning level, to illustrate a post in networks, to explain concepts internally to our team or to enrich our own content in the educational field.
The trick: if you click on Stylesin each scheme proposal, you will find more variations of the scheme with different colours and lines. You can also modify the texts by simply clicking on them once you select a visualisation.
Automatic presentations and slides: Gamma
Of all the content formats that AI is capable of generating, slideshows are probably the least successful. Sometimes the designs are not too elaborate, sometimes we don't get the template we want to use to be respected, almost always the texts are too simple. The particularity of Gamma, and what makes it more practical than other options such as Beautiful.ai, is that we can create a presentation directly from a text content that we can paste, generate with AI or upload in a file.

Figure 5. Starting points for Gamma.
If we paste the same text as in the previous example, about UNESCO's recommendations for democratic governance of AI, in the next step Gamma gives us the choice between "free form" or "card by card". In the first option, the system's AI organises the content into slides while preserving the full meaning of each slide. In the second, it proposes that we divide the text to indicate the content we want on each slide.
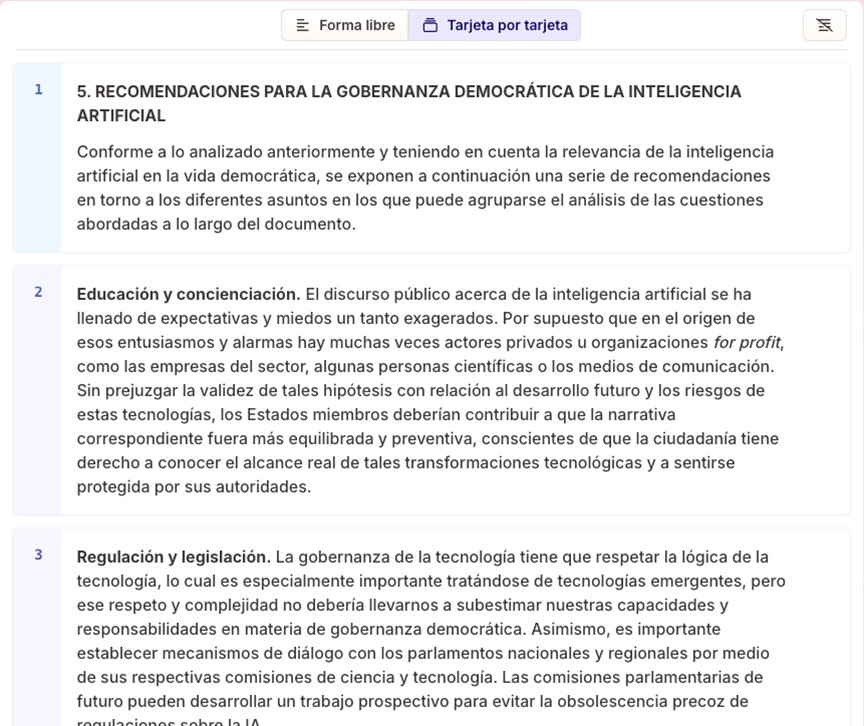
Figure 6. Text automatically split into slides by Gamma.
We select the second option, and the text is automatically divided into different blocks that will be our future slides. By clicking on "Continue", we are asked to select a base theme. Finally, by clicking on "Generate", the complete presentation is automatically created.
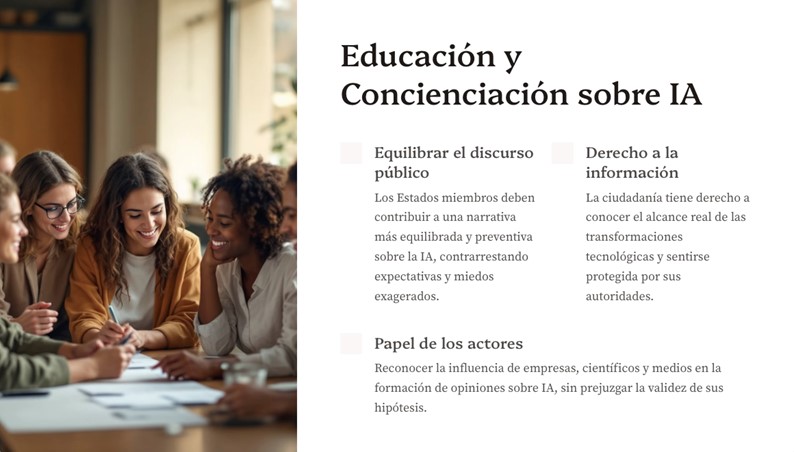
Figure 7. Example of a slide created with Gamma.
Gamma accompanies the slides with AI-created images that keep a certain coherence with the content, and gives us the option of modifying the texts or generating different images. Once ready, we can export it directly to Power Point format.
A trick: in the "edit with AI" button on each slide we can ask it to automatically translate it into another language, correct the spelling or even convert the text into a timeline.
Summarise from any format: NoteGPT
The aim of NoteGPT is very clear: to summarise content that we can import from many different sources. We can copy and paste a text, upload a file or an image, or directly extract the information from a link, something very useful and not so common in AI tools. Although the latter option does not always work well, it is one of the few tools that offer it.
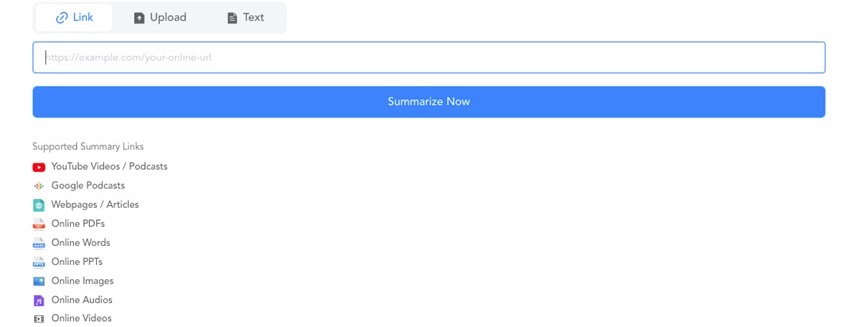
Figure 8. Starting points for NoteGPT.
In this case, we introduce the link to a YouTube video containing an interview with Daniel Innerarity on the intersection between artificial intelligence and democratic processes. On the results screen, the first thing you get on the left is the full transcript of the interview, in good quality. We can locate the transcript of a specific fragment of the video, translate it into different languages, copy it or download it, even in an SRT file of time-mapped subtitles.
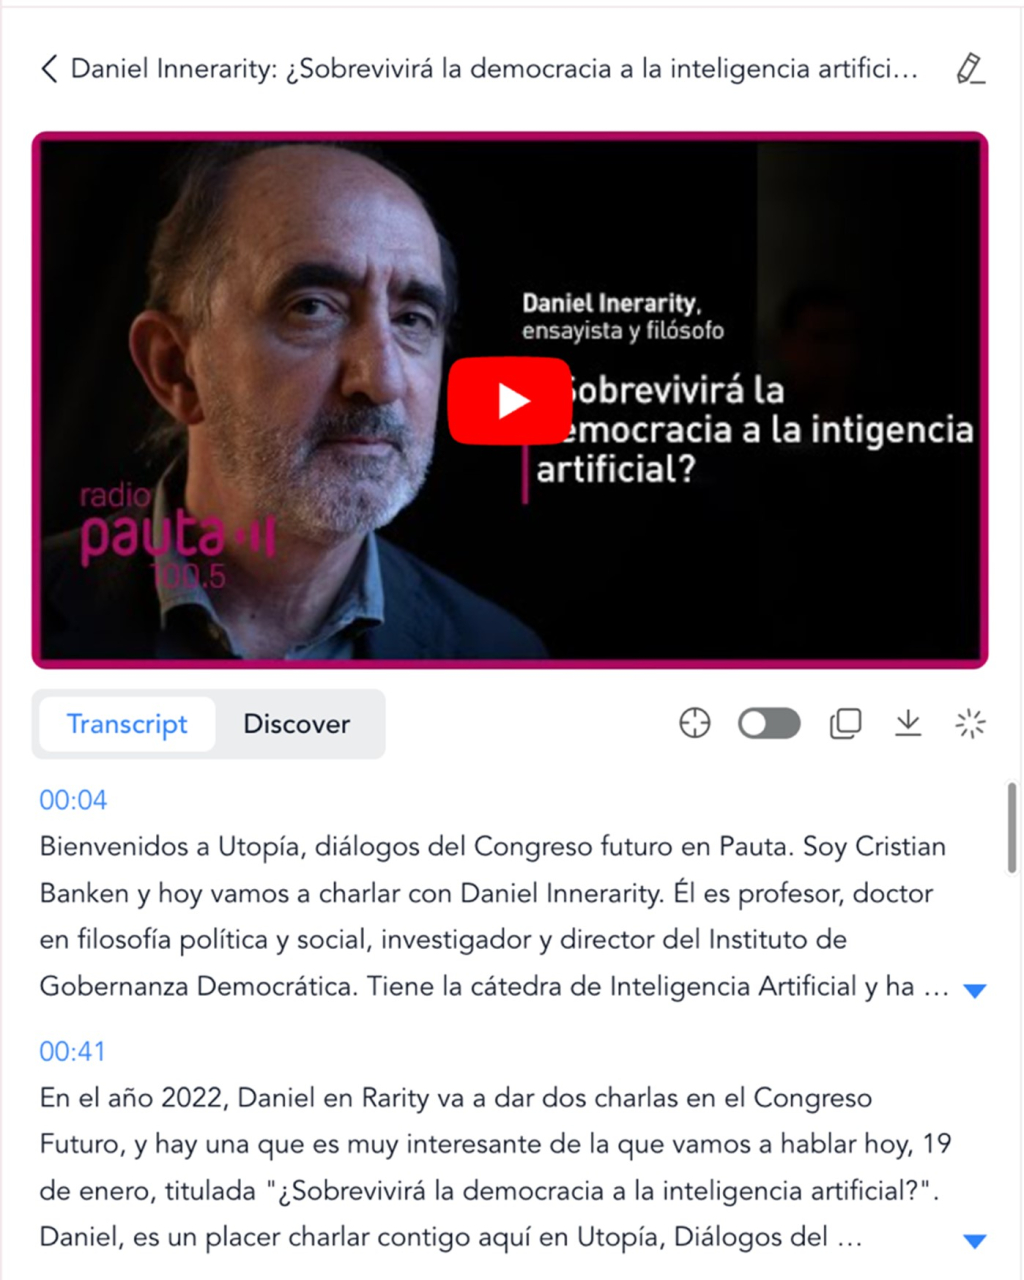
Figure 9. Example of transcription with minutes in NoteGPT
Meanwhile, on the right, we find the summary of the video with the most important points, sorted and illustrated with emojis. Also in the "AI Chat" button we can interact with a conversational assistant and ask questions about the content.
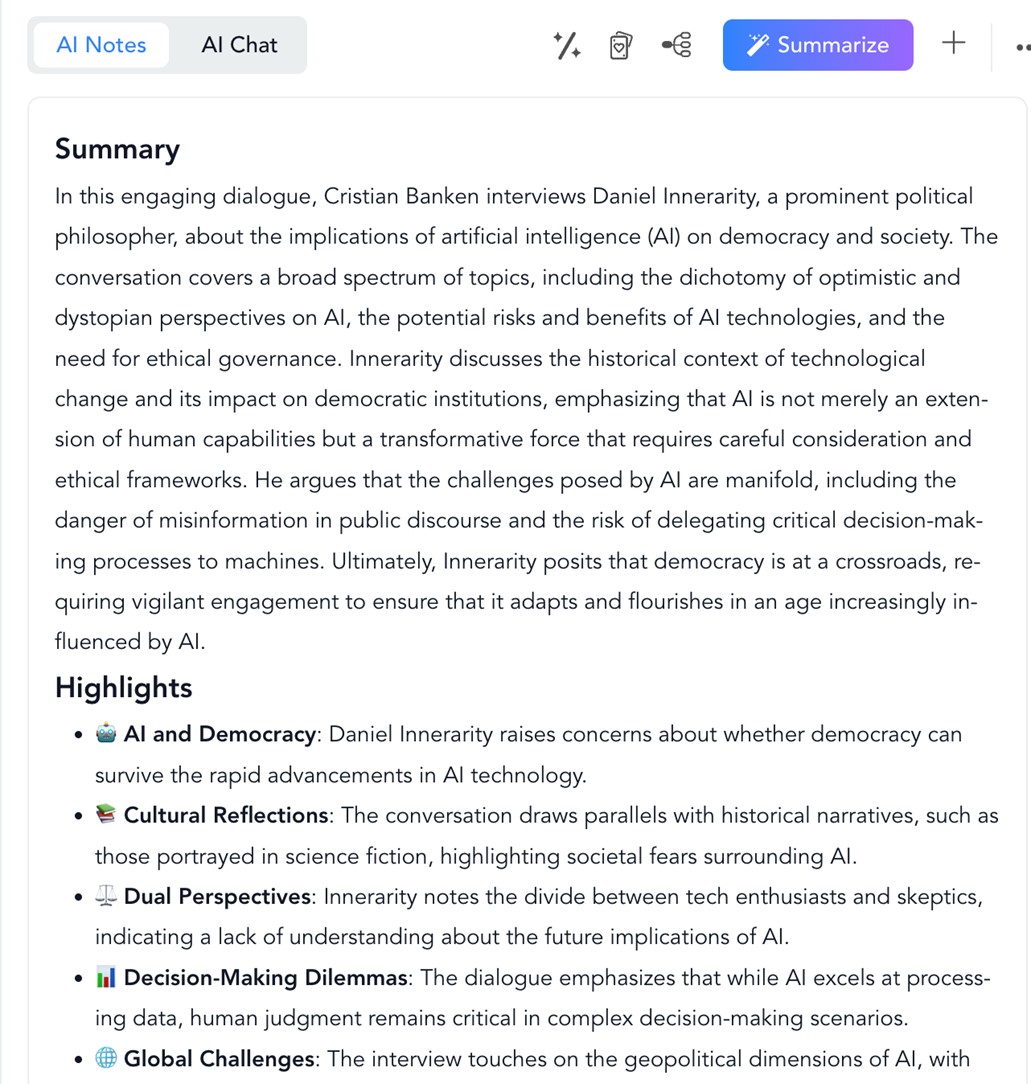
Figure 10. NoteGPT summary from a YouTube interview.
And although this is already very useful, the best thing we can find in NoteGPT are the flashcards, learning cards with questions and answers to internalise the concepts of the video.
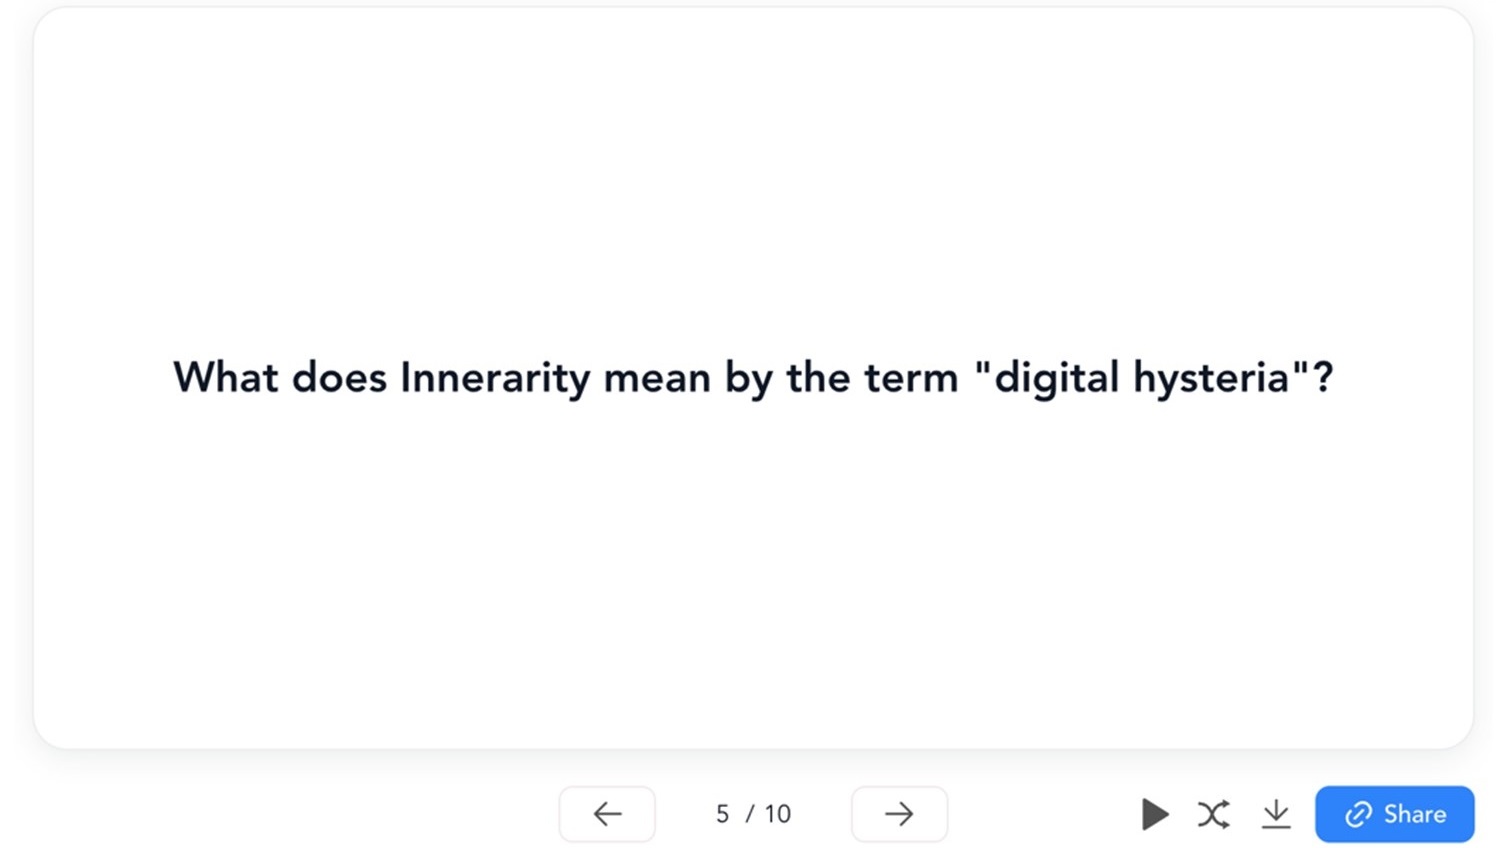
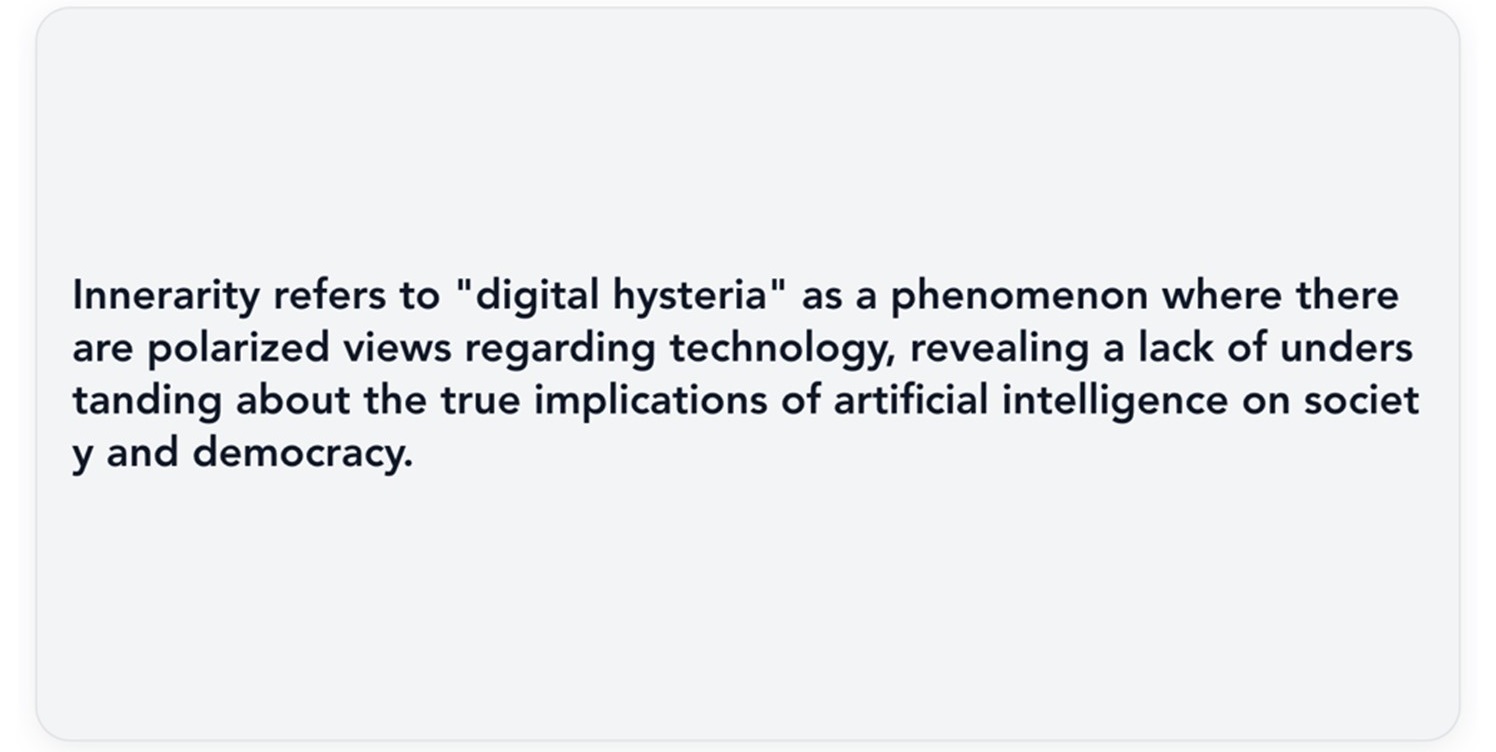
Figure 11. NoteGPT learning card (question and answer).
A trick: if the summary only appears in English, try changing the language in the three dots on the right, next to "Summarize" and click "Summarize" again. The summary will appear in English below. In the case of flashcards, to generate them in English, do not try from the home page, but from "AI flashcards". Under "Create" you can select the language.
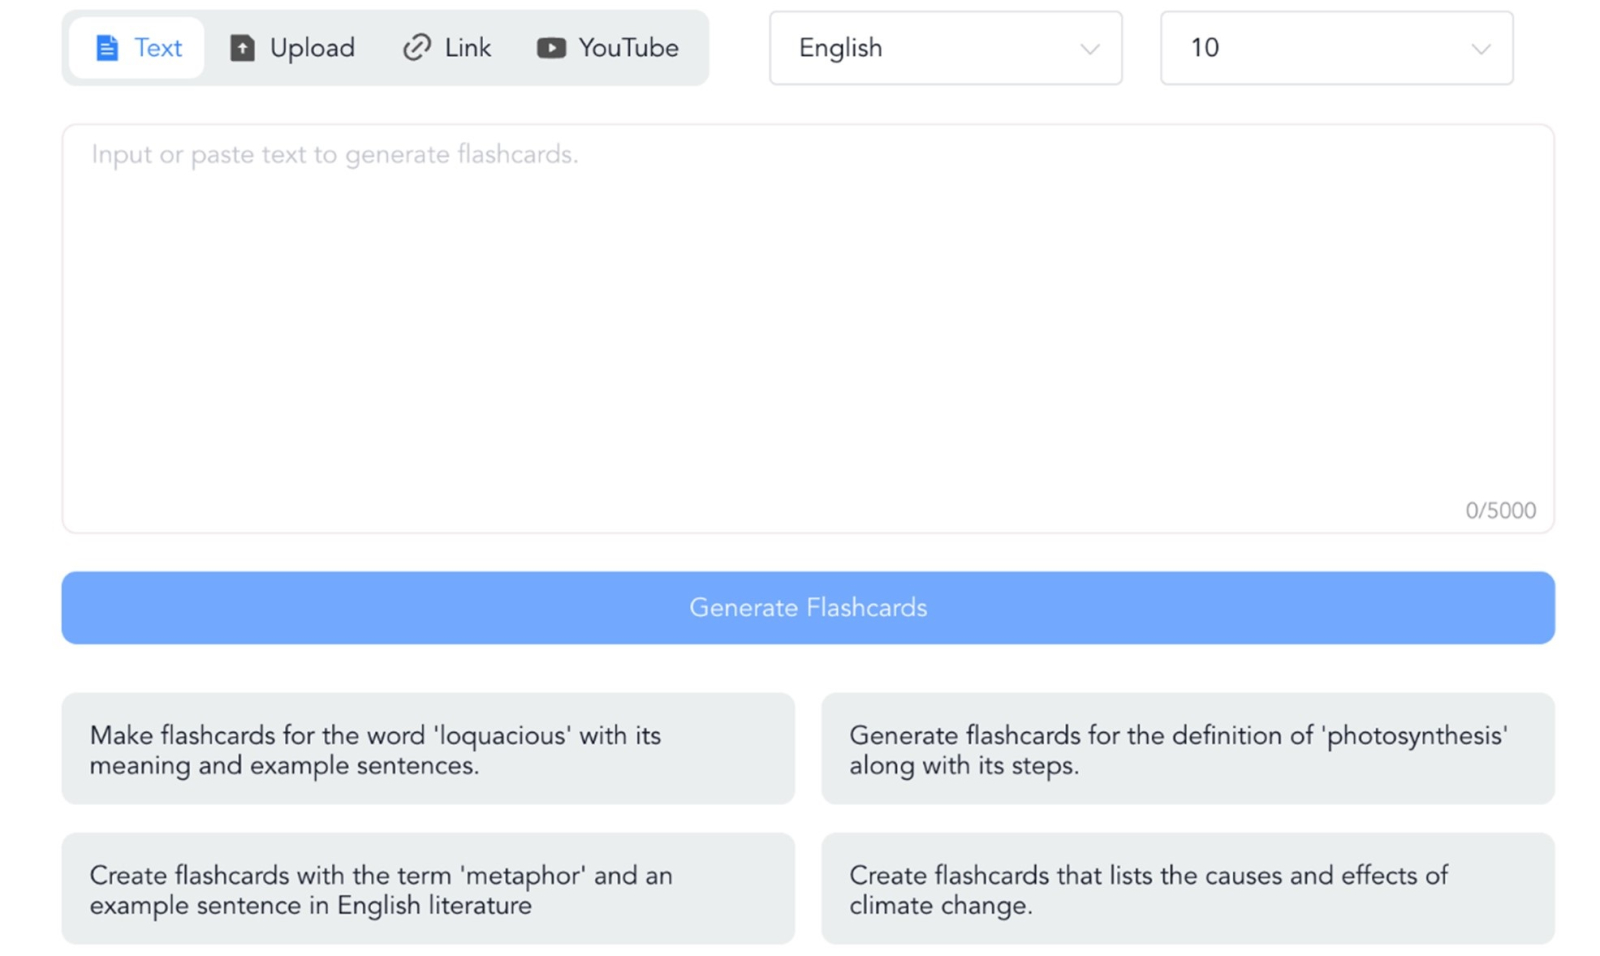
Figure 12. Creation of flashcards in NoteGPT.
Create videos about anything: Lumen5
Lumen5 makes it easy to create videos with AI by creating the script and images automatically from text or voice content. The most interesting thing about Lumen5 is the starting point, which can be a text, a document, simply an idea or also an existing audio recording or video.

Figure 13. Lumen5 options.
The system allows us, before creating the video and also once created, to change the format from 16:9 (horizontal) to 1:1 (square) or 9:16 (vertical), even with a special 9:16 option for Instagram stories.
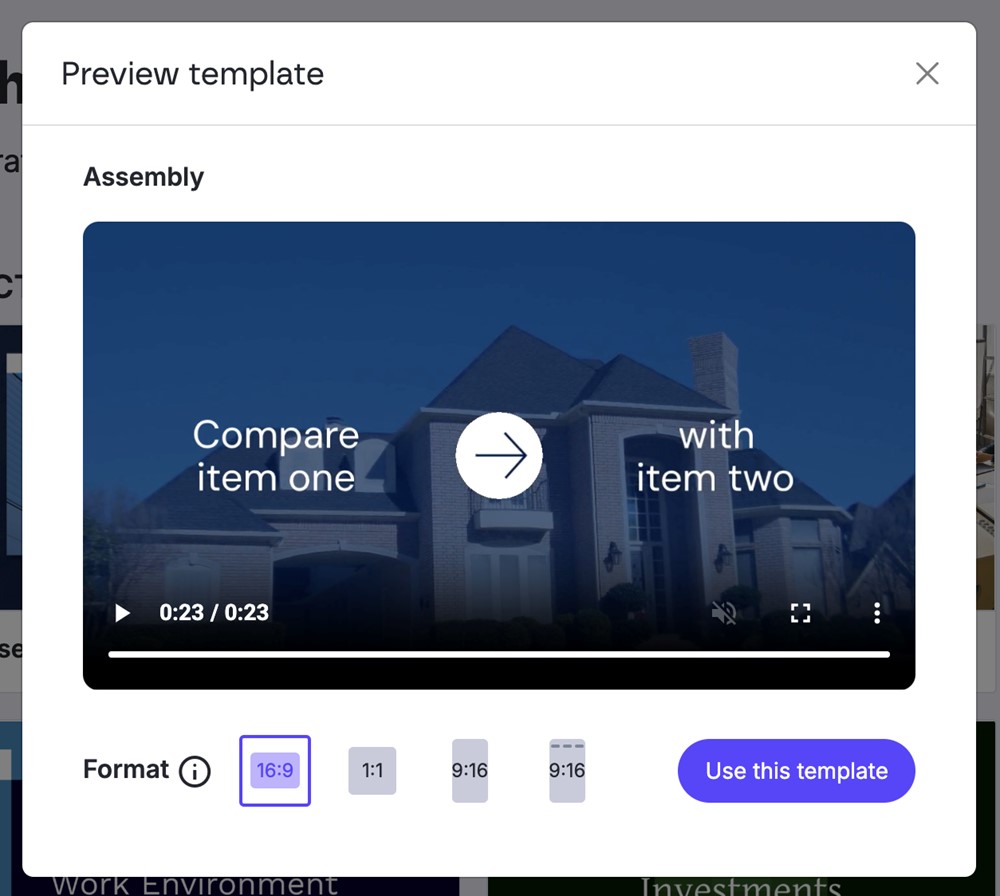
Figure 14. Video preview and aspect ratio options.
In this case, we will start from the same text as in previous tools: UNESCO's recommendations for democratic governance of AI. Select the starting option "Text on media", paste it directly into the box and click on "Compose script". The result is a very simple and schematic script, divided into blocks with the basic points of the text, and a very interesting indication: a prediction of the length of the video with that script, approximately 1 minute and 19 seconds.
An important note: the script is not a voice-over, but the text that will be written on the different screens. Once the video is finished, you can translate the whole video into any other language.

Figure 15. Script proposal in Lumen5.
Clicking on "Continue" will take you to the last opportunity to modify the script, where you can add new text blocks or delete existing ones. Once ready, click on "Convert to video" and you will find the story board ready to modify images, colours or the order of the screens. The video will have background music, which you can also change, and at this point you can record your voice over the music to voice the script. Without too much effort, this is the end result:
Figura 16. Resultado final de un vídeo creado con Lumen5.
From the wide range of AI-based digital products that have flourished in recent years, perhaps thousands of them, we have gone through just five examples that show us that individual and collaborative knowledge and learning are more accessible than ever before. The ease of converting content from one format to another and the automatic creation of study guides and materials should promote a more informed and agile society, not only through text or images but also through information condensed in files or databases.
It would be a great boost to collective progress if we understood that the value of AI-based systems is not as simple as writing or creating content for us, but to support our reasoning processes, objectify our decision-making and enable us to handle much more information in an efficient and useful way. Harnessing new AI capabilities together with open data initiatives may be key to the next step in the evolution of human thinking.
Content prepared by Carmen Torrijos, expert in AI applied to language and communication. The contents and points of view reflected in this publication are the sole responsibility of the author.
Evento
The EU Open Data Days 2025 is an essential event for all those interested in the world of open data and innovation in Europe and the world. This meeting, to be held on 19-20 March 2025, will bring together experts, practitioners, developers, researchers and policy makers to share knowledge, explore new opportunities and address the challenges facing the open data community.
The event, organised by the European Commission through data.europa.eu, aims to promote the re-use of open data. Participants will have the opportunity to learn about the latest trends in the use of open data, discover new tools and discuss the policies and regulations that are shaping the digital landscape in Europe.
Where and when does it take place?
El evento se celebrará en el Centro Europeo de Convenciones de Luxemburgo, aunque también se podrá seguir online, con el siguiente horario:
- Wednesday 19 March 2025, from 13:30 to 18:30.
- Thursday 20 March 2025, from 9:00 to 15:30.
What issues will be addressed?
The agenda of the event is already available, where we find different themes, such as, for example:
- Success stories and best practices: the event will be attended by professionals working at the frontline of European data policy to share their experience. Among other issues, these experts will provide practical guidance on how to inventory and open up a country's public sector data, address the work involved in compiling high-value datasets or analyse perspectives on data reuse in business models. Good practices for quality metadata or improved data governance and interoperability will also be explained.
- Focus on the use of artificial intelligence (AI): open data offers an invaluable source for the development and advancement of AI. In addition, AI can optimise the location, management and use of this data, offering tools to help streamline processes and extract greater insight. In this regard, the event will address the potential of AI to transform open government data ecosystems, fostering innovation, improving governance and enhancing citizen participation. The managers of Norway's national data portal will tell how they use an AI-based search engine to improve data localisation. In addition, the advances in linguistic data spaces and their use in language modelling will be explained, and how to creatively combine open data for social impact will be explored.
- Learning about data visualisation: event attendees will be able to explore how data visualisation is transforming communication, policy making and citizen engagement. Through various cases (such as the family tree of 3,000 European royals or UNESCO's Intangible Cultural Heritage relationships) it will show how iterative design processes can uncover hidden patterns in complex networks, providing insights into storytelling and data communication. It will also address how design elements such as colour, scale and focus influence the perception of data.
- Examples and use cases: multiple examples of concrete projects based on the reuse of data will be shown, in fields such as energy, urban development or the environment. Among the experiences that will be shared is a Spanish company, Tangible Data, which will tell how physical data sculptures turn complex datasets into accessible and engaging experiences.
These are just some of the topics to be addressed, but there will also be discussions on open science, the role of open data in transparency and accountability, etc.
Why are EU Open Data Days so important?
Access to open data has proven to be a powerful tool for improving decision-making, driving innovation and research, and improving the efficiency of organisations. At a time when digitisation is advancing rapidly, the importance of sharing and reusing data is becoming increasingly crucial to address global challenges such as climate change, public health or social justice.
The EU Open Data Days 2025 are an opportunity to explore how open data can be harnessed to build a more connected, innovative and participatory Europe.
In addition, for those who choose to attend in person, the event will also be an opportunity to establish contacts with other professionals and organisations in the sector, creating new collaborations that can lead to innovative projects.
How can I attend?
To attend in person, it is necessary to register through this link. However, registration is not required to attend the event online.
If you have any queries, an e-mail address has been set up to answer any questions you may have about the event: EU-Open-Data-Days@ec.europa.eu.
More information on the event website.
Noticia
Promoting the data culture is a key objective at the national level that is also shared by the regional administrations. One of the ways to achieve this purpose is to award those solutions that have been developed with open datasets, an initiative that enhances their reuse and impact on society.
On this mission, the Junta de Castilla y León and the Basque Government have been organising open data competitions for years, a subject we talked about in our first episode of the datos.gob.es podcast that you can listen to here.
In this post, we take a look at the winning projects in the latest editions of the open data competitions in the Basque Country and Castilla y León.
Winners of the 8th Castile and Leon Open Data Competition
In the eighth edition of this annual competition, which usually opens at the end of summer, 35 entries were submitted, from which 8 winners were chosen in different categories.
Ideas category: participants had to describe an idea to create studies, services, websites or applications for mobile devices. A first prize of 1,500€ and a second prize of 500€ were awarded.
- First prize: Green Guardians of Castilla y León presented by Sergio José Ruiz Sainz. This is a proposal to develop a mobile application to guide visitors to the natural parks of Castilla y León. Users can access information (such as interactive maps with points of interest) as well as contribute useful data from their visit, which enriches the application.
- Second prize: ParkNature: intelligent parking management system in natural spaces presented by Víctor Manuel Gutiérrez Martín. It consists of an idea to create an application that optimises the experience of visitors to the natural areas of Castilla y León, by integrating real-time data on parking and connecting with nearby cultural and tourist events.
Products and Services Category: Awarded studies, services, websites or applications for mobile devices, which must be accessible to all citizens via the web through a URL. In this category, first, second and third prizes of €2,500, €1,500 and €500 respectively were awarded, as well as a specific prize of €1,500 for students.
- First prize: AquaCyL from Pablo Varela Vázquez. It is an application that provides information about the bathing areas in the autonomous community.
- Second prize: ConquistaCyL presented by Markel Juaristi Mendarozketa and Maite del Corte Sanz. It is an interactive game designed for tourism in Castilla y León and learning through a gamified process.
- Third prize: All the sport of Castilla y León presented by Laura Folgado Galache. It is an app that presents all the information of interest associated with a sport according to the province.
- Student prize: Otto Wunderlich en Segovia by Jorge Martín Arévalo. It is a photographic repository sorted according to type of monuments and location of Otto Wunderlich's photographs.
Didactic Resource Category: consisted of the creation of new and innovative open didactic resources to support classroom teaching. These resources were to be published under Creative Commons licences. A single first prize of €1,500 was awarded in this category.
- First prize: StartUp CyL: Business creation through Artificial Intelligence and Open Data presented by José María Pérez Ramos. It is a chatbot that uses the ChatGPT API to assist in setting up a business using open data.
Data Journalism category: awarded for published or updated (in a relevant way) journalistic pieces, both in written and audiovisual media, and offered a prize of €1,500.
- First prize: Codorniz, perdiz y paloma torcaz son las especies más cazadas en Burgos, presented by Sara Sendino Cantera, which analyses data on hunting in Burgos.
Winners of the 5th edition of the Open Data Euskadi Open Data Competition
As in previous editions, the Basque open data portal opened two prize categories: an ideas competition and an applications competition, each of which was divided into several categories. On this occasion, 41 applications were submitted for the ideas competition and 30 for the applications competition.
Idea competition: In this category, two prizes of €3,000 and €1,500 have been awarded in each category.
Health and Social Category
- First prize: Development of a Model for Predicting the Volume of Patients attending the Emergency Department of Osakidetza by Miren Bacete Martínez. It proposes the development of a predictive model using time series capable of anticipating both the volume of people attending the emergency department and the level of severity of cases.
- Second prize: Euskoeduca by Sandra García Arias. It is a proposed digital solution designed to provide personalised academic and career guidance to students, parents and guardians.
Category Environment and Sustainability
- First prize: Baratzapp by Leire Zubizarreta Barrenetxea. The idea consists of the development of a software that facilitates and assists in the planning of a vegetable garden by means of algorithms that seek to enhance the knowledge related to the self-consumption vegetable garden, while integrating, among others, climatological, environmental and plot information in a personalised way for the user.
- Second prize: Euskal Advice by Javier Carpintero Ordoñez. The aim of this proposal is to define a tourism recommender based on artificial intelligence.
General Category
- First prize: Lanbila by Hodei Gonçalves Barkaiztegi. It is a proposed app that uses generative AI and open data to match curriculum vitae with job offers in a semantic way.. It provides personalised recommendations, proactive employment and training alerts, and enables informed decisions through labour and territorial indicators.
- Second prize: Development of an LLM for the interactive consultation of Open Data of the Basque Government by Ibai Alberdi Martín. The proposal consists in the development of a Large Scale Language Model (LLM) similar to ChatGPT, specifically trained with open data, focused on providing a conversational and graphical interface that allows users to get accurate answers and dynamic visualisations.
Applications competition: this modality has selected one project in the web services category, awarded with €8,000, and two more in the General Category, which have received a first prize of €8,000 and a second prize of €5,000.
Category Web Services
- First prize: Bizidata: Plataforma de visualización del uso de bicicletas en Vitoria-Gasteiz by Igor Díaz de Guereñu de los Ríos. It is a platform that visualises, analyses and downloads data on bicycle use in Vitoria-Gasteiz, and explores how external factors, such as the weather and traffic, influence bicycle use.
General Category
- First prize: Garbiñe AI by Beatriz Arenal Redondo. It is an intelligent assistant that combines Artificial Intelligence (AI) with open data from Open Data Euskadi to promote the circular economy and improve recycling rates in the Basque Country.
- Second prize: Vitoria-Gasteiz Businessmap by Zaira Gil Ozaeta. It is an interactive visualisation tool based on open data, designed to improve strategic decisions in the field of entrepreneurship and economic activity in Vitoria-Gasteiz.
All these award-winning solutions reuse open datasets from the regional portal of Castilla y León or Euskadi, as the case may be. We encourage you to take a look at the proposals that may inspire you to participate in the next edition of these competitions. Follow us on social media so you don't miss out on this year's calls!
Noticia
The Ministry for the Digital Transformation and Civil Service, on 17 December, announced the publication of the call for proposals for products and services for data spaces, an initiative that seeks to promote innovation and development in various sectors through financial aid. These grants are designed to support companies and organisations in the implementation of advanced technological solutions, thus promoting competitiveness and digital transformation in Spain.
In addition, on 30 December, the Ministry also launched the second call for proposals for demonstrators and use cases. This call aims to encourage the creation and development of sectoral data spaces, promoting collaboration and the exchange of information between the different actors in the sector.
The Ministry has been conducting promotions through online workshops to inform and prepare stakeholders about the opportunities and benefits of the data space sector. It is expected that these events will continue throughout January, providing further opportunities for stakeholders to inform themselves and participate.
The following material is of interest to you:
Call for demonstrators and use cases
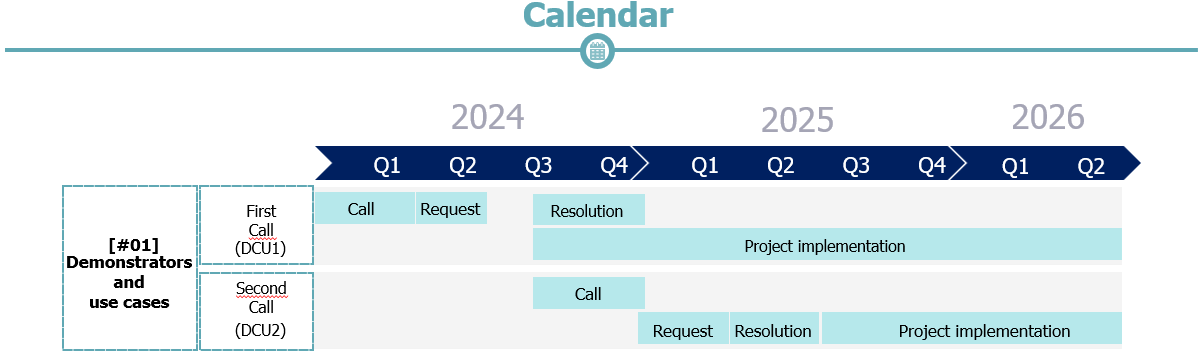
- Data space demonstrators and use cases (2nd call for proposals).
- Enquiry mailbox: dcu2.espaciosdedatos@digital.gob.es
- Presentations and helpful videos:
Products and services

- Call for proposals for products and services for data spaces.
- Consultation mailbox: ps.espaciosdedatos@digital.gob.es
- Presentations and helpful videos:
Noticia
Researchers and students from various centers have also reported advances resulting from working with data:The last days of the year are always a good time to look back and assess the progress made. If a few weeks ago we took stock of what happened in the Aporta initiative, now it is time to compile the news related to data sharing, open data and the technologies linked to them.
Six months ago, we already made a first collection of milestones in the sector. On this occasion, we will summarise some of the innovations, improvements and achievements of the last half of the year.
Regulating and driving artificial intelligence
La inteligencia artificial (IA) continúa siendo uno de los campos donde cada día se aprecian nuevos avances. Se trata de un sector cuyo auge es relativamente nuevo y que necesita regulación. Por ello, la Unión Europea publicó el pasado julio el Reglamento de inteligencia artificial, una norma que marcará el entorno regulatorio europeo y global. Alineada con Europa, España ya presentó unos meses antes su nueva Estrategia de inteligencia artificial 2024, con el fin de establecer un marco para acelerar el desarrollo y expansión de la IA en España.
Artificial intelligence (AI) continues to be one of the fields where new advances are being made every day. This is a relatively new and booming sector in need of regulation. Therefore, last July, the European Union published the Artificial Intelligence Regulation, a standard that will shape the European and global regulatory environment. Aligned with Europe, Spain had already presented its new Artificial Intelligence Strategy 2024 a few months earlier, with the aim of establishing a framework to accelerate the development and expansion of AI in Spain.
On the other hand, in October, Spain took over the co-presidency of the Open Government Partnership. Its roadmap includes promoting innovative ideas, taking advantage of the opportunities offered by open data and artificial intelligence. As part of the position, Spain will host the next OGP World Summit in Vitoria.
Innovative new data-driven tools
Data drives a host of disruptive technological tools that can generate benefits for all citizens. Some of those launched by public bodies in recent months include:
- The Ministry of Transport and Sustainable Mobility has started to use Big Data technology to analyse road traffic and improve investments and road safety.
- The Principality of Asturias announces a plan to use Artificial Intelligence to end traffic jams during the summer, through the development of a digital twin.
- The Government of Aragon presented a new tourism intelligence system, which uses Big Data and AI to improve decision-making in the sector.
- The Region of Murcia has launched “Murcia Business Insight”, a business intelligence application that allows dynamic analysis of data on the region's companies: turnover, employment, location, sector of activity, etc.
- The Granada City Council has used Artificial Intelligence to improve sewerage. The aim is to achieve "more efficient" maintenance planning and execution, with on-site data.
- The Segovia City Council and Visa have signed a collaboration agreement to develop an online tool with real, aggregated and anonymous data on the spending patterns of foreign Visa cardholders in the capital. This initiative will provide relevant information to help tailor strategies to promote international tourism.
Researchers and students from various centers have also reported advances resulting from working with data:
- Researchers from the Center for Genomic Regulation (CRG) in Barcelona, the University of the Basque Country (UPV/EHU), the Donostia International Physics Center (DIPC) and the Fundación Biofísica Bizkaia have trained an algorithm to detect tissue alterations in the early stages and improve cancer diagnosis.
- Researchers from the Spanish National Research Council (CSIC) and KIDO Dynamics have launched a project to extract metadata from mobile antennas to understand the flow of people in natural landscapes. The objective is to identify and monitor the impact of tourism.
- A student at the University of Valladolid (UVa) has designed a project to improve the management and analysis of forest ecosystems in Spain at the local level, by converting municipal boundaries into a linked open data format. The results are available for re-use.
Advances in data spaces
The Ministry for Digital Transformation and the Civil Service and, specifically, the Secretariat of State for Digitalisation and Artificial Intelligence continues to make progress in the implementation of data spaces, through various actions:
- A Plan for the Promotion of Sectoral Data Spaces has been presented to promote secure data sharing.
- The development of Data Spaces for Intelligent Urban Infrastructures (EDINT) has been launched. This project, which will be carried out through the Spanish Federation of Municipalities and Provinces (FEMP), contemplates the creation of a multi-sectoral data space that will bring together all the information collected by local entities.
- In the field of digitalisation, aid has been launched for the digital transformation of strategic productive sectors through the development of technological products and services for data spaces.
Functionalities that bring data closer to reusers
The open data platforms of the various agencies have also introduced new developments, as new datasets, functionalities, strategies or reports:
- The Ministry for Ecological Transition and the Demographic Challenge has launched a new application for viewing the National Air Quality Index (AQI) in real time. It includes health recommendations for the general population and the sensitive population.
- The Andalusian Government has published a "Guide for the design of Public Policy Pilot Studies". It proposes a methodology for designing pilot studies and a system for collecting evidence for decision-making.
- The Government of Catalonia has initiated steps to implement a new data governance model that will improve relations with citizens and companies.
- The Madrid City Council is implementing a new 3D cartography and thermal map. In the Blog IDEE (Spatial Data Infrastructure of Spain) they explain how this 3D model of the capital was created using various data capture technologies.
- The Canary Islands Statistics Institute (ISTAC) has published 6,527 thematic maps with labor indicators on the Canary Islands in its open data catalog.
- Open Data Initiative and the Democratic Union of Pensioners and Retirees of Spain, with support from the Ministry of Social Rights, Consumption and Agenda 2030, presented the first Data website of the Data Observatory x Seniors. Its aim is to facilitate the analysis of healthy ageing in Spain and strategic decision-making. The Barcelona Initiative also launched a challenge to identify 50 datasets related to healthy ageing, a project supported by the Barcelona Provincial Council.
- The Centre for Technological Development and Innovation (CDTI) has presented a dashboard in beta phase with open data in exploitable format.
In addition, work continues to promote the opening up of data from various institutions:
- Asedie and the King Juan Carlos University (Madrid) have launched the Open Data Reuse Observatory to promote the reuse of open data. It already has the commitment of the Madrid City Council and they are looking for more institutions to join their Manifesto.
- The Cabildo of Tenerife and the University of La Laguna have developed a Sustainable Mobility Strategy in the Macizo de Anaga Biosphere Reserve. The aim is to obtain real-time data in order to take measures adapted to demand.
Data competitions and events to encourage the use of open data
Summer was the time chosen by various public bodies to launch competitions for products and/or services based on open data. This is the case of:
- The Community of Madrid held DATAMAD 2024 at the Universidad Rey Juan Carlos de Madrid. The event included a workshop on how to reuse open data and a datathon.
- More than 200 students registered for the I Malackathon, organised by the University of Malaga, a competition that awarded projects that used open data to propose solutions for water resource management.
- The Junta de Castilla y León held the VIII Open Data Competition, whose winners were announced in November.
- The II UniversiData Datathon was also launched. 16 finalists have been selected. The winners will be announced on 13 February 2025.
- The Cabildo of Tenerife also organised its I Open Data Competition: Ideas for reuse. They are currently evaluating the applications received. They will later launch their 2nd Open Data Competition: APP development.
- The Government of Euskadi held its V Open Data Competition. The finalists in both the Applications and Ideas categories are now known.
Also in these months there have been multiple events, which can be seen online, such as:
- The III GeoEuskadi Congress and XVI Iberian Conference on Spatial Data Infrastructures (JIIDE).
- DATAforum Justice 2024.
Other examples of events that were held but are not available online are the III Congress & XIV Conference of R Users, the Novagob 2024 Public Innovation Congress, DATAGRI 2024 or the Data Governance for Local Entities Conference, among others.
These are just a few examples of the activity carried out during the last six months in the Spanish data ecosystem. We encourage you to share other experiences you know of in the comments or via our email address dinamizacion@datos.gob.es.
Blog
The ability to collect, analyse and share data plays a crucial role in the context of the global challenges we face as a society today. From pollution and climate change, through poverty and pandemics, to sustainable mobility and lack of access to basic services. Global problems require solutions that can be adapted on a large scale. This is where open data can play a key role, as it allows governments, organisations and citizens to work together in a transparent way, and facilitates the process of achieving effective, innovative, adaptable and sustainable solutions.
The World Bank as a pioneer in the comprehensive use of open data
One of the most relevant examples of good practices that we can find when it comes to expressing the potential of open data to tackle major global challenges is, without a doubt, the case of the World Bank, a benchmark in the use of open data for more than a decade now as a fundamental tool for sustainable development.
Since the launch of its open data portal in 2010, the institution has undergone a complete transformation process in terms of data access and use. This portal, totally innovative at the time, quickly became a reference model by offering free and open access to a wide range of data and indicators covering more than 250 economies. Moreover, its platform is constantly being updated and bears little resemblance to the initial version at present, as it is continuously improving and providing new datasets and complementary and specialised tools with the aim of making data always accessible and useful for decision making. Examples of such tools include:
- The Poverty and Inequality Platform (PIP): designed to monitor and analyse global poverty and inequality. With data from more than 140 countries, this platform allows users to access up-to-date statistics and better understand the dynamics of collective well-being. It also facilitates data visualisation through interactive graphs and maps, helping users to gain a clear and quick understanding of the situation in different regions and over time.
- The Microdata Library: provides access to household and enterprise level survey and census data in several countries. The library has more than 3,000 datasets from studies and surveys conducted by the Bank itself, as well as by other international organisations and national statistical agencies. The data is freely available and fully accessible for downloading and analysis.
- The World Development Indicators (WDI): are an essential tool for tracking progress on the global development agenda. This database contains a vast collection of economic, social and environmental development indicators, covering more than 200 countries and territories. It has data covering areas such as poverty, education, health, environmental sustainability, infrastructure and trade. The WDIs provide us with a reliable frame of reference for analysing global and regional development trends.

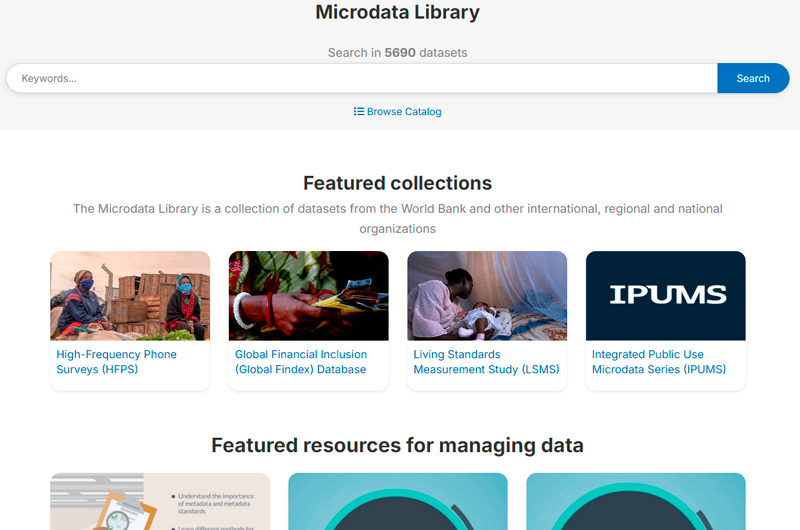

Figure 1. Screenshots of the web portals Poverty and Inequality Platform (PIP), Microdata Library and World Development Indicators (WDI).
Data as a transformative element for change
A major milestone in the World Bank's use of data was the publication of the World Development Report 2021, entitled "data for better lives". This report has become a flagship publication that explores the transformative potential of data to address humanity's grand challenges, improve the results of development efforts and promote inclusive and equitable growth. Through the report, the institution advocates a new social agenda for data, including robust, ethical and responsible governance of data, maximising its value in order to generate significant economic and social benefit.
The report examines how data can be integrated into public policy and development programmes to address global challenges in areas such as education, health, infrastructure and climate change. But it also marked a turning point in reinforcing the World Bank's commitment to data as a driver of change in tackling major challenges, and has since adopted a new roadmap with a more innovative, transformative and action-oriented approach to data use. Since then, they have been moving from theory to practice through their own projects, where data becomes a fundamental tool throughout the strategic cycle, as in the following examples:
- Open Data and Disaster Risk Reduction: the report "Digital Public Goods for Disaster Risk Reduction in a Changing Climate" highlights how open access to geospatial and meteorological data facilitates more effective decision-making and strategic planning. Reference is also made to tools such as OpenStreetMap that allow communities to map vulnerable areas in real time. This democratisation of data strengthens emergency response and builds the resilience of communities at risk from floods, droughts and hurricanes.
- Open data in the face of agri-food challenges: the report "What's cooking?" shows how open data is revolutionising global agri-food systems, making them more inclusive, efficient and sustainable. In agriculture, access to open data on weather patterns, soil quality and market prices empowers smallholder farmers to make informed decisions. In addition, platforms that provide open geospatial data serve to promote precision agriculture, enabling the optimisation of key resources such as water and fertilisers, while reducing costs and minimising environmental impact.
- Optimising urban transport systems: in Tanzania, the World Bank has supported a project that uses open data to improve the public transport system. The rapid urbanisation of Dar es Salaam has led to considerable traffic congestion in several areas, affecting both urban mobility and air quality. This initiative addresses traffic congestion through a real-time information system that improves mobility and reduces environmental impact. This approach, based on open data, not only increases transport efficiency, but also contributes to a better quality of life for city dwellers.
Leading by example
Finally, and within this same comprehensive vision, it is worth noting how this international organization closes the circle of open data through its use as a tool for transparency and communication of its own activities.That is why among the outstanding data tools in its catalogue we can find some of them:
- Its project and operations portal: a tool that provides detailed access to the development projects that the institution funds and implements around the world. This portal acts as a window into all its global initiatives, providing information on objectives, funding, expected results and progress for the Bank's thousands of projects.
- The Finances One platform: on which they centralise all their financial data of public interest and those corresponding to the project portfolio of all the group's entities. It aims to simplify the presentation of financial information, facilitating its analysis and sharing by customers and partners.
The future impact of open data on major global challenges
As we have also seen above, opening up data offers immense potential to advance the sustainable development agenda and thus be able to address global challenges more effectively. The World Bank has been demonstrating how this practice can evolve and adapt to current challenges. Its leadership in this area has served as a model for other institutions, showing the positive impact that open data can have on sustainable development and in tackling the major challenges affecting the lives of millions of people around the world.
However, there is still a long way to go, as transparency and access to information policies need to be further improved so that data can reach the benefit of society as a whole in a more equitable way. In addition, another key challenge is to strengthen the capacities needed to maximise the use and impact of this data, particularly in developing countries. This implies not only going beyond facilitating access, but also working on data literacy and supporting the creation of the right tools to enable information to be used effectively.
The use of open data is enabling more and more actors to participate in the creation of innovative solutions and bring about real change. All this gives rise to a new and expanding area of work that, in the right hands and with the right support, can play a crucial role in creating a safer, fairer and more sustainable future for all. We hope that many organisations will follow the World Bank's example and also adopt a holistic approach to using data to address humanity's grand challenges.
Content prepared by Carlos Iglesias, Open data Researcher and consultant, World Wide Web Foundation. The contents and views reflected in this publication are the sole responsibility of the author.
Noticia
TheMinistry for the Digital Transformation and Civil Service has presented an ambitious Plan for the Promotion of Sectorial Data Spaces. Its objective is to foster innovation and improve competitiveness and added-value in all economic sectors, promoting the deployment of data spaces where data can be securely shared. Thanks to them, companies, and the economy in general, will be able to benefit from the full potential of a European data single market.
The Plan has a 500 million euros budget from the Recovery, Transformation and Resilience Plan, and will be developed in 6 axes and 11 initiatives with a planned duration until 2026.
Data spaces
Data sharing in data spaces offers enormous benefits to all the participating companies, both individually and collectively. These benefits include improved efficiency, cost reduction, increased competitiveness, innovation in business models and better adaptation to regulations. These benefits cannot be achieved by companies in isolation but requires the sharing of data among all the actors involved.
Some examples of these benefits would be:
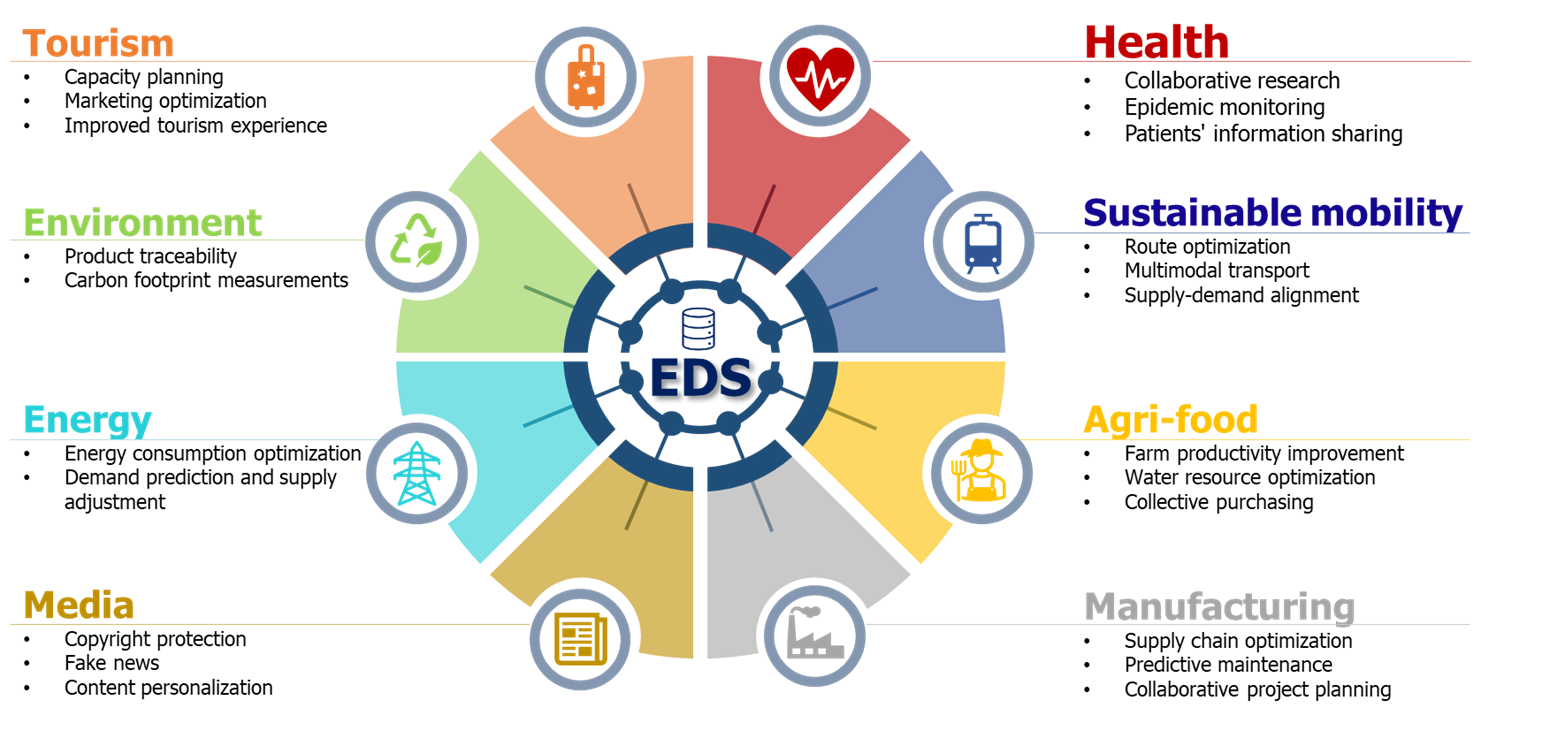
Figure 1. Impact of data spaces on various sectors.
Some specific initiatives include:
- The AgriDataSpace project ensures food quality and safety through full traceability of products.
- The Mobility Data Space project improves urban planning and transportation efficiency by integrating mobility data.
Benefits of the Plan for the Promotion of Sectorial Data Spaces
The Plan will offer more than €287 million in grants for the creation and maintenance of data spaces, the development of high-value use cases and the reduction of costs for participating companies when consuming, sharing or providing data. It will also offer up to 44 million euros in grants to the technology industry to facilitate the adaptation of their digital products and services to the needs of data spaces and the entities that participate in them by sharing data and making our industry more competitive in data technologies.
Finally, with a budget of up to 169 million euros, several unique projects of public interest will be developed that will act as enablers for digital transformation focused on data and data spaces in all economic sectors. These enablers will contribute to accelerate the process of deploying use cases and data spaces, as well as stimulate companies to actively share data and obtain the expected benefits. To this end, a network of common infrastructures and data space demonstrators will be developed, a National Reference Center for data spaces will be set up, and the entire non-open public data sets held by public administrations which are of high interest to businesses will be made available to the economic sectors.
Learn more about the Plan and its measures


The set of initiatives to be developed by the Plan is summarized in the following table:

Figure 2. Summary table with the initiatives included in the Plan for the Promotion of Sectorial Data Spaces.
Discover the grants that are currently active, and the planned schedule to benefit from them:
More information about data spaces here.
Links of interest


Noticia
Tourism is one of Spain's economic engines. In 2022, it accounted for 11.6% of Gross Domestic Product (GDP), exceeding €155 billion, according to the Instituto Nacional de Estadística (INE). A figure that grew to 188,000 million and 12.8% of GDP in 2023, according to Exceltur, an association of companies in the sector. In addition, Spain is a very popular destination for foreigners, ranking second in the world and growing: by 2024 it is expected to reach a record number of international visitors, reaching 95 million.
In this context, the Secretariat of State for Tourism (SETUR), in line with European policies, is developing actions aimed at creating new technological tools for the Network of Smart Tourist Destinations, through SEGITTUR (Sociedad Mercantil Estatal para la Gestión de la Innovación y las Tecnologías Turísticas), the body in charge of promoting innovation (R&D&I) in this industry. It does this by working with both the public and private sectors, promoting:
- Sustainable and more competitive management models.
- The management and creation of smart destinations.
- The export of Spanish technology to the rest of the world.
These are all activities where data - and the knowledge that can be extracted from it - play a major role. In this post, we will review some of the actions SEGITTUR is carrying out to promote data sharing and openness, as well as its reuse. The aim is to assist not only in decision-making, but also in the development of innovative products and services that will continue to position our country at the forefront of world tourism.
Dataestur, an open data portal
Dataestur is a web space that gathers in a unique environment open data on national tourism. Users can find figures from a variety of public and private information sources.
The data are structured in six categories:
- General: international tourist arrivals, tourism expenditure, resident tourism survey, world tourism barometer, broadband coverage data, etc.
- Economy: tourism revenues, contribution to GDP, tourism employment (job seekers, unemployment and contracts), etc.
- Transport: air passengers, scheduled air capacity, passenger traffic by ports, rail and road, etc.
- Accommodation: hotel occupancy, accommodation prices and profitability indicators for the hotel sector, etc.
- Sustainability: air quality, nature protection, climate values, water quality in bathing areas, etc.
- Knowledge: active listening reports, visitor behaviour and perception, scientific tourism journals, etc.
The data is available for download via API.
Dataestur is part of a more ambitious project in which data analysis is the basis for improving tourist knowledge, through actions with a wide scope, such as those we will see below.
Developing an Intelligent Destination Platform (IDP)
Within the fulfillment of the milestones set by the Next Generation funds, and corresponding to the development of the Digital Transformation Plan for Tourist Destinations, the Secretary of State for Tourism, through SEGITTUR, is developing an Intelligent Destination Platform (PID). It is a platform-node that brings together the supply of tourism services and facilitates the interoperability of public and private operators. Thanks to this platform it will be possible to provide services to integrate and link data from both public and private sources.
Some of the challenges of the Spanish tourism ecosystem to which the IDP responds are:
- Encourage the integration and development of the tourism ecosystem (academia, entrepreneurs, business, etc.) around data intelligence and ensure technological alignment, interoperability and common language.
- To promote the use of the data economy to improve the generation, aggregation and sharing of knowledge in the Spanish tourism sector, driving its digital transformation.
- To contribute to the correct management of tourist flows and tourist hotspots in the citizen space, improving the response to citizens' problems and offering real-time information for tourist management.
- Generate a notable impact on tourists, residents and companies, as well as other agents, enhancing the brand "sustainable tourism country" throughout the travel cycle (before, during and after).
- Establish a reference framework to agree on targets and metrics to drive sustainability and carbon footprint reduction in the tourism industry, promoting sustainable practices and the integration of clean technologies.
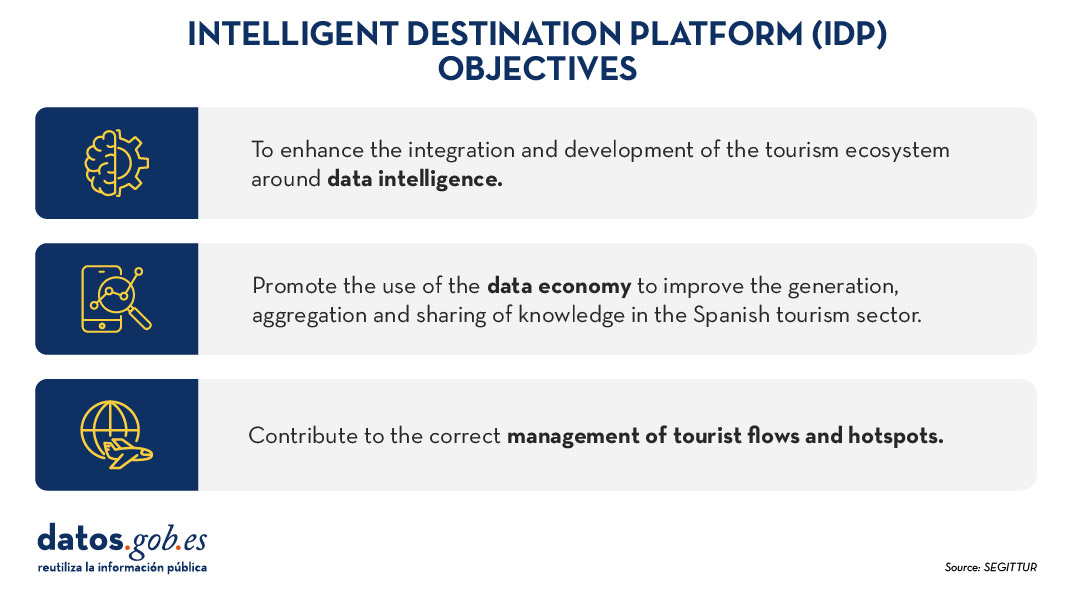
Figure 1. Objectives of the Intelligent Destination Platform (IDP).
New use cases and methodologies to implement them
To further harmonise data management, up to 25 use cases have been defined that enable different industry verticals to work in a coordinated manner. These verticals include areas such as wine tourism, thermal tourism, beach management, data provider hotels, impact indicators, cruises, sports tourism, etc.
To implement these use cases, a 5-step methodology is followed that seeks to align industry practices with a more structured approach to data:
- Identify the public problems to be solved.
- Identify what data are needed to be available to be able to solve them.
- Modelling these data to define a common nomenclature, definition and relationships.
- Define what technology needs to be deployed to be able to capture or generate such data.
- Analyse what intervention capacities, both public and private, are needed to solve the problem.
Boosting interoperability through a common ontology and data space
As a result of this definition of the 25 use cases, a ontology of tourism has been created, which they hope will serve as a global reference. The ontology is intended to have a significant impact on the tourism sector, offering a series of benefits:
- Interoperability: The ontology is essential to establish a homogeneous data structure and enable global interoperability, facilitating information integration and data exchange between platforms and countries. By providing a common language, definitions and a unified conceptual structure, data can be comparable and usable anywhere in the world. Tourism destinations and the business community can communicate more effectively and agilely, fostering closer collaboration.
- Digital transformation: By fostering the development of advanced technologies, such as artificial intelligence, tourism companies, the innovation ecosystem or academia can analyse large volumes of data more efficiently. This is mainly due to the quality of the information available and the systems' better understanding of the context in which they operate.
- Tourism competitiveness: Aligned with the previous question, the implementation of this ontology contributes to eliminating inequalities in the use and application of technology within the sector. By facilitating access to advanced digital tools, both public institutions and private companies can make more informed and strategic decisions. This not only raises the quality of the services offered, but also boosts the productivity and competitiveness of the Spanish tourism sector in an increasingly demanding global market.
- Tourist experience: Thanks to ontology, it is possible to offer recommendations tailored to the individual preferences of each traveller. This is achieved through more accurate profiling based on demographic and behavioural characteristics as well as specific motivations related to different types of tourism. By personalising offers and services, customer satisfaction before, during and after the trip is improved, and greater loyalty to tourist destinations is fostered.
- Governance: The ontology model is designed to evolve and adapt as new use cases emerge in response to changing market demands. SEGITTUR is actively working to establish a governance model that promotes effective collaboration between public and private institutions, as well as with the technology sector.
In addition, to solve complex problems that require the sharing of data from different sources, the Open Innovation Platform (PIA) has been created, a data space that facilitates collaboration between the different actors in the tourism ecosystem, both public and private. This platform enables secure and efficient data sharing, empowering data-driven decision making. The PIA promotes a collaborative environment where open and private data is shared to create joint solutions to address specific industry challenges, such as sustainability, personalisation of the tourism experience or environmental impact management.
Building consensus
SEGITTUR is also carrying out various initiatives to achieve the necessary consensus in the collection, management and analysis of tourism-related data, through collaboration between public and private actors. To this end, the Ente Promotor de la Plataforma Inteligente de Destinoswas created in 2021, which plays a fundamental role in bringing together different actors to coordinate efforts and agree on broad lines and guidelines in the field of tourism data.
In summary, Spain is making progress in the collection, management and analysis of tourism data through coordination between public and private actors, using advanced methodologies and tools such as the creation of ontologies, use cases and collaborative platforms such as PIA that ensure efficient and consensual management of the sector.
All this is not only modernising the Spanish tourism sector, but also laying the foundations for a smarter, more intelligent, connected and efficient future. With its focus on interoperability, digital transformation and personalisation of experiences, Spain is positioned as a leader in tourism innovation, ready to face the technological challenges of tomorrow.
Documentación
Open data portals play a fundamental role in accessing and reusing public information. A key aspect in these environments is the tagging of datasets, which facilitates their organization and retrieval.
Word embeddings represent a transformative technology in the field of natural language processing, allowing words to be represented as vectors in a multidimensional space where semantic relationships are mathematically preserved. This exercise explores their practical application in a tag recommendation system, using the datos.gob.es open data portal as a case study.
The exercise is developed in a notebook that integrates the environment configuration, data acquisition, and recommendation system processing, all implemented in Python. The complete project is available in the Github repository.
Access the data lab repository on GitHub.
Run the data preprocessing code on Google Colab.
In this video, the author explains what you will find both on Github and Google Colab (English subtitles available).
Understanding word embeddings
Word embeddings are numerical representations of words that revolutionize natural language processing by transforming text into a mathematically processable format. This technique encodes each word as a numerical vector in a multidimensional space, where the relative position between vectors reflects semantic and syntactic relationships between words. The true power of embeddings lies in three fundamental aspects:
- Context capture: unlike traditional techniques such as one-hot encoding, embeddings learn from the context in which words appear, allowing them to capture meaning nuances.
- Semantic algebra: the resulting vectors allow mathematical operations that preserve semantic relationships. For example, vector('Madrid') - vector('Spain') + vector('France') ≈ vector('Paris'), demonstrating the capture of capital-country relationships.
- Quantifiable similarity: similarity between words can be measured through metrics, allowing identification of not only exact synonyms but also terms related in different degrees and generalizing these relationships to new word combinations.
In this exercise, pre-trained GloVe (Global Vectors for Word Representation) embeddings were used, a model developed by Stanford that stands out for its ability to capture global semantic relationships in text. In our case, we use 50-dimensional vectors, a balance between computational complexity and semantic richness. To comprehensively evaluate its ability to represent Spanish language, multiple tests were conducted:
- Word similarity was analyzed using cosine similarity, a metric that evaluates the angle between two word vectors. This measure results in values between -1 and 1, where values close to 1 indicate high semantic similarity, while values close to 0 indicate little or no relationship. Terms like "amor" (love), "trabajo" (work), and "familia" (family) were evaluated to verify that the model correctly identified semantically related words.
- The model's ability to solve linguistic analogies was tested, for example, "hombre es a mujer lo que rey es a reina" (Man is to woman what king is to queen), confirming its ability to capture complex semantic relationships.
- Vector operations were performed (such as "rey - hombre + mujer") to check if the results maintained semantic coherence.
- Finally, dimensionality reduction techniques were applied to a representative sample of 40 Spanish words, allowing visualization of semantic relationships in a two-dimensional space. The results revealed natural grouping patterns among semantically related terms, as observed in the figure:
- Emotions: alegría (joy), felicidad (happiness) or pasión (passion) appear grouped in the upper right.
- Family-related terms: padre (father), hermano (brother) or abuelo (grandfather) concentrate at the bottom.
- Transport: coche (car), autobús (bus), or camión (truck) form a distinctive group.
- Colors: azul (blue), verde (green) or rojo (red) appear close to each other.
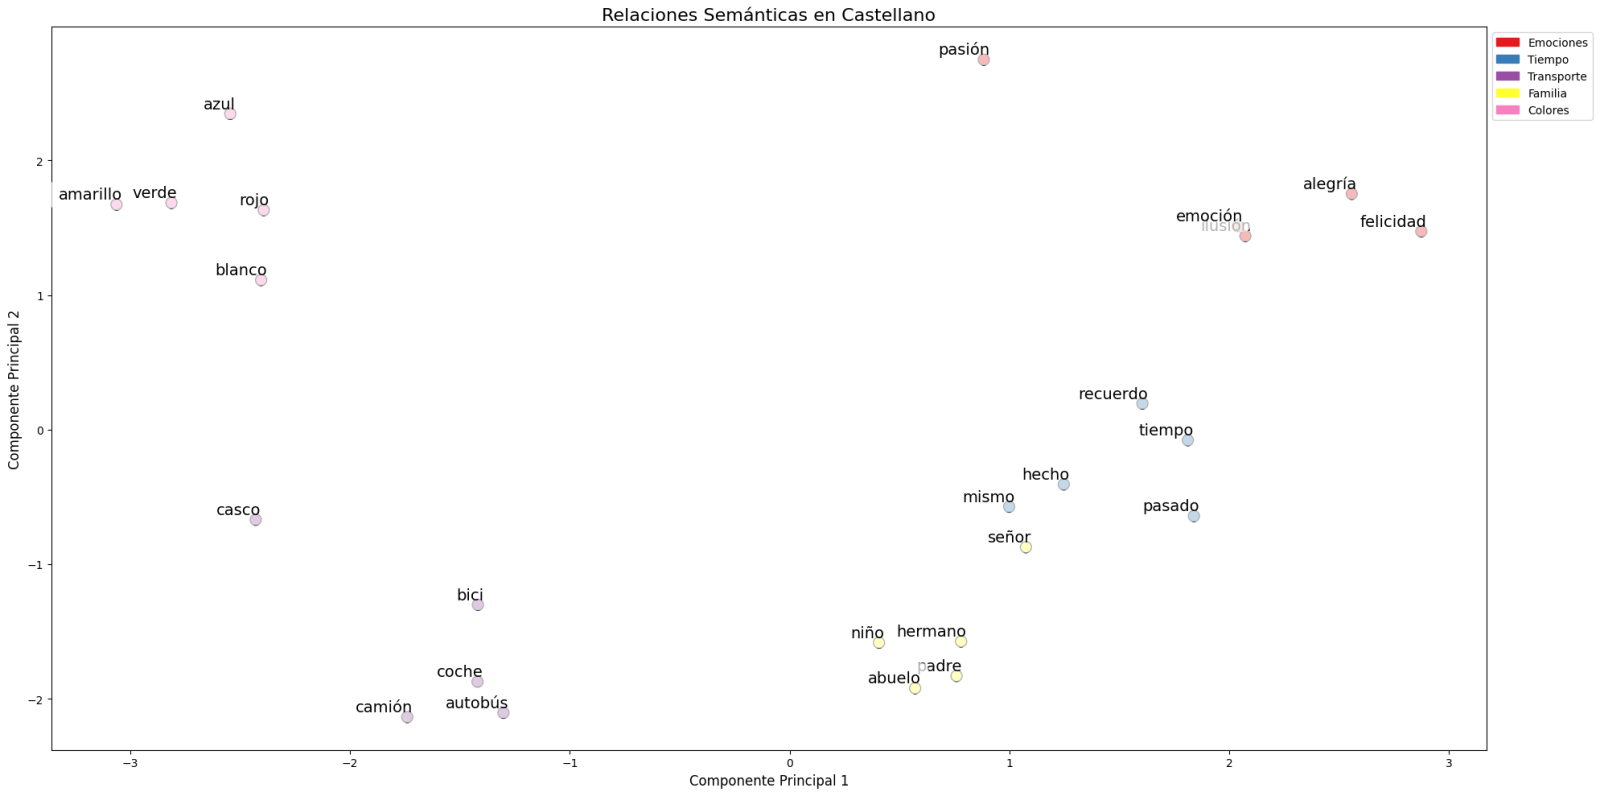
Figure 1. Principal Components Analysis on 50 dimensions (embeddings) with an explained variability percentage by the two components of 0.46
To systematize this evaluation process, a unified function has been developed that encapsulates all the tests described above. This modular architecture allows automatic and reproducible evaluation of different pre-trained embedding models, thus facilitating objective comparison of their performance in Spanish language processing. The standardization of these tests not only optimizes the evaluation process but also establishes a consistent framework for future comparisons and validations of new models by the public.
The good capacity to capture semantic relationships in Spanish language is what we leverage in our tag recommendation system.
Embedding-based Recommendation System
Leveraging the properties of embeddings, we developed a tag recommendation system that follows a three-phase process:
- Embedding generation: for each dataset in the portal, we generate a vector representation combining the title and description. This allows us to compare datasets by their semantic similarity.
- Similar dataset identification: using cosine similarity between vectors, we identify the most semantically similar datasets.
- Tag extraction and standardization: from similar sets, we extract their associated tags and map them with Eurovoc thesaurus terms. This thesaurus, developed by the European Union, is a multilingual controlled vocabulary that provides standardized terminology for cataloging documents and data in the field of European policies. Again, leveraging the power of embeddings, we identify the semantically closest Eurovoc terms to our tags, thus ensuring coherent standardization and better interoperability between European information systems.
The results show that the system can generate coherent and standardized tag recommendations. To illustrate the system's operation, let's take the case of the dataset "Tarragona City Activities Agenda":
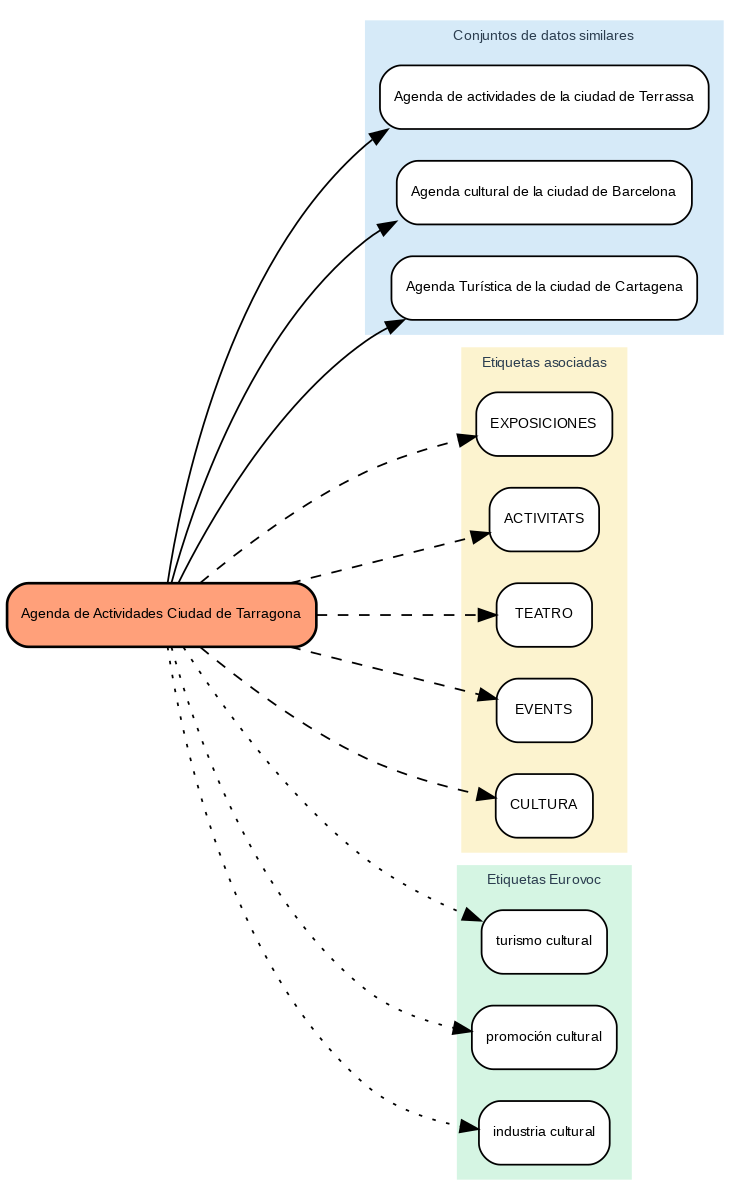
Figure 2. Tarragona City Events Guide
The system:
- Finds similar datasets like "Terrassa Activities Agenda" and "Barcelona Cultural Agenda".
- Identifies common tags from these datasets, such as "EXHIBITIONS", "THEATER", and "CULTURE".
- Suggests related Eurovoc terms: "cultural tourism", "cultural promotion", and "cultural industry".
Advantages of the Approach
This approach offers significant advantages:
- Contextual Recommendations: the system suggests tags based on the real meaning of the content, not just textual matches.
- Automatic Standardization: integration with Eurovoc ensures a controlled and coherent vocabulary.
- Continuous Improvement: the system learns and improves its recommendations as new datasets are added.
- Interoperability: the use of Eurovoc facilitates integration with other European systems.
Conclusions
This exercise demonstrates the great potential of embeddings as a tool for associating texts based on their semantic nature. Through the analyzed practical case, it has been possible to observe how, by identifying similar titles and descriptions between datasets, precise recommendations of tags or keywords can be generated. These tags, in turn, can be linked with keywords from a standardized thesaurus like Eurovoc, applying the same principle.
Despite the challenges that may arise, implementing these types of systems in production environments presents a valuable opportunity to improve information organization and retrieval. The accuracy in tag assignment can be influenced by various interrelated factors in the process:
- The specificity of dataset titles and descriptions is fundamental, as correct identification of similar content and, therefore, adequate tag recommendation depends on it.
- The quality and representativeness of existing tags in similar datasets directly determines the relevance of generated recommendations.
- The thematic coverage of the Eurovoc thesaurus, which, although extensive, may not cover specific terms needed to describe certain datasets precisely.
- The vectors' capacity to faithfully capture semantic relationships between content, which directly impacts the precision of assigned tags.
For those who wish to delve deeper into the topic, there are other interesting approaches to using embeddings that complement what we've seen in this exercise, such as:
- Using more complex and computationally expensive embedding models (like BERT, GPT, etc.)
- Training models on a custom domain-adapted corpus.
- Applying deeper data cleaning techniques.
In summary, this exercise not only demonstrates the effectiveness of embeddings for tag recommendation but also unlocks new possibilities for readers to explore all the possibilities this powerful tool offers.
Blog
Today's climate crisis and environmental challenges demand innovative and effective responses. In this context, the European Commission's Destination Earth (DestinE) initiative is a pioneering project that aims to develop a highly accurate digital model of our planet.
Through this digital twin of the Earth it will be possible to monitor and prevent potential natural disasters, adapt sustainability strategies and coordinate humanitarian efforts, among other functions. In this post, we analyse what the project consists of and the state of development of the project.
Features and components of Destination Earth
Aligned with the European Green Pact and the Digital Europe Strategy, Destination Earth integrates digital modeling and climate science to provide a tool that is useful in addressing environmental challenges. To this end, it has a focus on accuracy, local detail and speed of access to information.
In general, the tool allows:
- Monitor and simulate Earth system developments, including land, sea, atmosphere and biosphere, as well as human interventions.
- To anticipate environmental disasters and socio-economic crises, thus enabling the safeguarding of lives and the prevention of significant economic downturns.
- Generate and test scenarios that promote more sustainable development in the future.
To do this, DestinE is subdivided into three main components :
- Data lake:
- What is it? A centralised repository to store data from a variety of sources, such as the European Space Agency (ESA), EUMETSAT and Copernicus, as well as from the new digital twins.
- What does it provide? This infrastructure enables the discovery and access to data, as well as the processing of large volumes of information in the cloud.
·The DestinE Platform:.
- What is it? A digital ecosystem that integrates services, data-driven decision-making tools and an open, flexible and secure cloud computing infrastructure.
- What does it provide? Users have access to thematic information, models, simulations, forecasts and visualisations that will facilitate a deeper understanding of the Earth system.
- Digital cufflinks and engineering:
- What are they? There are several digital replicas covering different aspects of the Earth system. The first two are already developed, one on climate change adaptation and the other on extreme weather events.
- WHAT DOES IT PROVIDE? These twins offer multi-decadal simulations (temperature variation) and high-resolution forecasts.
Discover the services and contribute to improve DestinE
The DestinE platform offers a collection of applications and use cases developed within the framework of the initiative, for example:
- Digital twin of tourism (Beta): it allows to review and anticipate the viability of tourism activities according to the environmental and meteorological conditions of its territory.
- VizLab: offers an intuitive graphical user interface and advanced 3D rendering technologies to provide a storytelling experience by making complex datasets accessible and understandable to a wide audience..
- miniDEA: is an interactive and easy-to-use DEA-based web visualisation app for previewing DestinE data.
- GeoAI: is a geospatial AI platform for Earth observation use cases.
- Global Fish Tracking System (GFTS): is a project to help obtain accurate information on fish stocks in order to develop evidence-based conservation policies.
- More resilient urban planning: is a solution that provides a heat stress index that allows urban planners to understand best practices for adapting to extreme temperatures in urban environments..
- Danube Delta Water Reserve Monitoring: is a comprehensive and accurate analysis based on the DestinE data lake to inform conservation efforts in the Danube Delta, one of the most biodiverse regions in Europe.
Since October this year, the DestinE platform has been accepting registrations, a possibility that allows you to explore the full potential of the tool and access exclusive resources. This option serves to record feedback and improve the project system.
To become a user and be able to generate services, you must follow these steps..
Project roadmap:
The European Union sets out a series of time-bound milestones that will mark the development of the initiative:
- 2022 - Official launch of the project.
- 2023 - Start of development of the main components.
- 2024 - Development of all system components. Implementation of the DestinE platform and data lake. Demonstration.
- 2026 - Enhancement of the DestinE system, integration of additional digital twins and related services.
- 2030 - Full digital replica of the Earth.
Destination Earth not only represents a technological breakthrough, but is also a powerful tool for sustainability and resilience in the face of climate challenges. By providing accurate and accessible data, DestinE enables data-driven decision-making and the creation of effective adaptation and mitigation strategies.