Noticia
The 2024 Best Cases Awards of the Public Sector Tech Watch observatory now have finalists. These awards seek to highlight solutions that use emerging technologies, such as artificial intelligence or blockchain, in public administrations, through two categories:
- Solutions to improve the public services offered to citizens (Government-to-Citizen or G2C).
- Solutions to improve the internal processes of the administrations themselves (Government-to-Government or G2G).
The awards are intended to create a mechanism for sharing the best experiences on the use of emerging technologies in the public sector and thus give visibility to the most innovative administrations in Europe.
Almost 60% of the finalist solutions are Spanish.
In total, 32 proposals have been received, 14 of which have been pre-selected in a preliminary evaluation. Of these, more than half are solutions from Spanish organisations. Specifically, nine finalists have been shortlisted for the G2G category -five of them Spanish- and five for G2C -three of them linked to our country-.The following is a summary of what these Spanish solutions consist of.
Solutions to improve the internal processes of the administrations themselves.
- Innovation in local government: digital transformation and GeoAI for data management (Alicante Provincial Council).
Suma Gestión Tributaria, of the Diputación de Alicante, is the agency in charge of managing and collecting the municipal taxes of the city councils of its province. To optimise this task, they have developed a solution that combines geographic information systems and artificial intelligence (machine learning and deep learning) to improve training in detection of properties that do not pay taxes. This solution collects data from multiple administrations and entities in order to avoid delays in the collection of municipalities.
- Regional inspector of public infrastructures: monitoring of construction sites (Provincial Council of Bizkaia and Interbiak).
The autonomous road inspector and autonomous urban inspector help public administrations to automatically monitor roads. These solutions, which can be installed in any vehicle, use artificial or computer vision techniques along with information from sensors to automatically check the condition of traffic signs, road markings, protective barriers, etc. They also perform early forecasting of pavement degradation, monitor construction sites and generate alerts for hazards such as possible landslides.
- Application of drones for the transport of biological samples (Centre for Telecommunications and Information Technologies -CTTI-, Generalitat de Catalunya).
This pilot project implements and evaluates a health transport route in the Girona health region. Its aim is to transport biological samples (blood and urine) between a primary health centre and a hospital using drones. As a result, the journey time has been reduced from 20 minutes with ground transport to seven minutes with the use of drones. This has improved the quality of the samples transported, increased flexibility in scheduling transport times and reduced environmental impact.
- Robotic automation of processes in the administration of justice (Ministry of the Presidency, Justice and Relations with the Courts).
Ministry of the Presidency, Justice and Relations with the Courts has implemented a solution for the robotisation of administrative processes in order to streamline routine, repetitive and low-risk work. To date, more than 25 process automation lines have been implemented, including the automatic cancellation of criminal records, nationality applications, automatic issuance of life insurance certificates, etc. As a result, it is estimated that more than 500,000 working hourshave been saved.
- Artificial intelligence in the processing of official publications (Official Gazette of the Province of Barcelona and Official Documentation and Publications Service, Barcelona Provincial Council).
CIDO (Official Information and Documentation Search Engine) has implemented an AI system that automatically generates summaries of official publications of the public administrations of Barcelona. Using supervised machine learning and neural networkstechniques, the system generates summaries of up to 100 words for publications in Catalan or Spanish. The tool allows the recording of manual modifications to improve accuracy.
Solutions to improve the public services offered to citizens
- Virtual Desk of Digital Immediacy: bringing Justice closer to citizens through digitalisation (Ministry of the Presidency, Justice and Relations with the Courts).
The Virtual Digital Immediacy Desktop (EVID) allows remote hearings with full guarantees of legal certainty using blockchain technologies. The solution integrates the convening of the hearing, the provision of documentation, the identification of the participants, the acceptance of consents, the generation of the document justifying the action carried out, the signing of the document and the recording of the session. In this way, legal acts can be carried out from anywhere, without the need to travel and in a simple way, making justice more inclusive, accessible and environmentally friendly. By the end of June 2024, more than 370,000 virtual sessions had been held through EVID.
- Application of Generative AI to make it easier for citizens to understand legal texts (Entitat Autònoma del Diari Oficial i Publicacions -EADOP-, Generalitat de Catalunya).
Legal language is often a barrier that prevents citizens from easily understanding legal texts. To remove this obstacle, the Government is making available to users of the Legal Portal of Catalonia and to the general public the summaries of Catalan law in simple language obtained from generative artificial intelligence. The aim is to have summaries of the more than 14,000 14,000 existing regulatory provisions adapted to clear communication available by the end of the year. The abstracts will be published in Catalan and Spanish, with the prospect of also offering a version in Aranesein the future.
- Emi - Intelligent Employment (Consellería de Emprego, Comercio e Emigración de la Xunta de Galicia).
Emi, Intelligent Employment is an artificial intelligence and big data tool that helps the offices of the Public Employment Service of Galicia to orient unemployed people towards the skills required by the labour market, according to their abilities. AI models make six-month projections of contracts for a particular occupation for a chosen geographical area. In addition, they allow estimating the probability of finding employment for individuals in the coming months.
You can see all the solutions presented here. The winners will be announced at the final event on 28 November. The ceremony takes place in Brussels, but can also be followed online. To do so, you need to register here.
Public Sector Tech Watch: an observatory to inspire new projects
Public Sector Tech Watch (PSTW), managed by the European Commission, is positioned as a "one-stop shop" for all those interested - public sector, policy makers, private companies, academia, etc. - in the latest technological developments to improve public sector performance and service delivery. For this purpose, it has several sections where the following information of interest is displayed:
- Cases: contains examples of how innovative technologies and their associated data are used by public sector organisations in Europe.
- Stories: presents testimonials to show the challenges faced by European administrations in implementing technological solutions.
If you know of a case of interest that is not currently monitored by PSTW, you can register it here. Successful cases are reviewed and evaluated before being included in the database.
Documentación
The following presents a new guide to Exploratory Data Analysis (EDA) implemented in Python, which evolves and complements the version published in R in 2021. This update responds to the needs of an increasingly diverse community in the field of data science.
Exploratory Data Analysis (EDA) represents a critical step prior to any statistical analysis, as it allows:
- Comprehensive understanding of the data before analyzing it.
- Verification of statistical requirements that will ensure the validity of subsequent analyses.
To exemplify its importance, let's take the case of detecting and treating outliers, one of the tasks to be performed in an EDA. This phase has a significant impact on fundamental statistics such as the mean, standard deviation, or coefficient of variation.
This guide maintains as a practical case the analysis of air quality data from Castilla y León, demonstrating how to transform public data into valuable information through the use of fundamental Python libraries such as pandas, matplotlib, and seaborn, along with modern automated analysis tools like ydata-profiling.
In addition to explaining the different phases of an EDA, the guide illustrates them with a practical case. In this sense, the analysis of air quality data from Castilla y León is maintained as a practical case. Through explanations that users can replicate, public data is transformed into valuable information using fundamental Python libraries such as pandas, matplotlib, and seaborn, along with modern automated analysis tools like ydata-profiling.
Why a new guide in Python?
The choice of Python as the language for this new guide reflects its growing relevance in the data science ecosystem. Its intuitive syntax and extensive catalog of specialized libraries have made it a fundamental tool for data analysis. By maintaining the same dataset and analytical structure as the R version, understanding the differences between both languages is facilitated. This is especially valuable in environments where multiple technologies coexist. This approach is particularly relevant in the current context, where numerous organizations are migrating their analyses from traditional languages/tools like R, SAS, or SPSS to Python. The guide seeks to facilitate these transitions and ensure continuity in the quality of analyses during the migration process.
New features and improvements
The content has been enriched with the introduction to automated EDA and data profiling tools, thus responding to one of the latest trends in the field. The document delves into essential aspects such as environmental data interpretation, offers a more rigorous treatment of outliers, and presents a more detailed analysis of correlations between variables. Additionally, it incorporates good practices in code writing.
The practical application of these concepts is illustrated through the analysis of air quality data, where each technique makes sense in a real context. For example, when analyzing correlations between pollutants, it not only shows how to calculate them but also explains how these patterns reflect real atmospheric processes and what implications they have for air quality management.
Structure and contents
The guide follows a practical and systematic approach, covering the five fundamental stages of EDA:
- Descriptive analysis to obtain a representative view of the data.
- Variable type adjustment to ensure consistency.
- Detection and treatment of missing data.
- Identification and management of outliers.
- Correlation analysis between variables.

Figure 1. Phases of exploratory data analysis. Source: own elaboration.
As a novelty in the structure, a section on automated exploratory analysis is included, presenting modern tools that facilitate the systematic exploration of large datasets.
Who is it for?
This guide is designed for open data users who wish to conduct exploratory analyses and reuse the valuable sources of public information found in this and other data portals worldwide. While basic knowledge of the language is recommended, the guide includes resources and references to improve Python skills, as well as detailed practical examples that facilitate self-directed learning.
The complete material, including both documentation and source code, is available in the portal's GitHub repository. The implementation has been done using open-source tools such as Jupyter Notebook in Google Colab, which allows reproducing the examples and adapting the code according to the specific needs of each project.
The community is invited to explore this new guide, experiment with the provided examples, and take advantage of these resources to develop their own open data analyses.
Click to see the full infographic, in accessible version
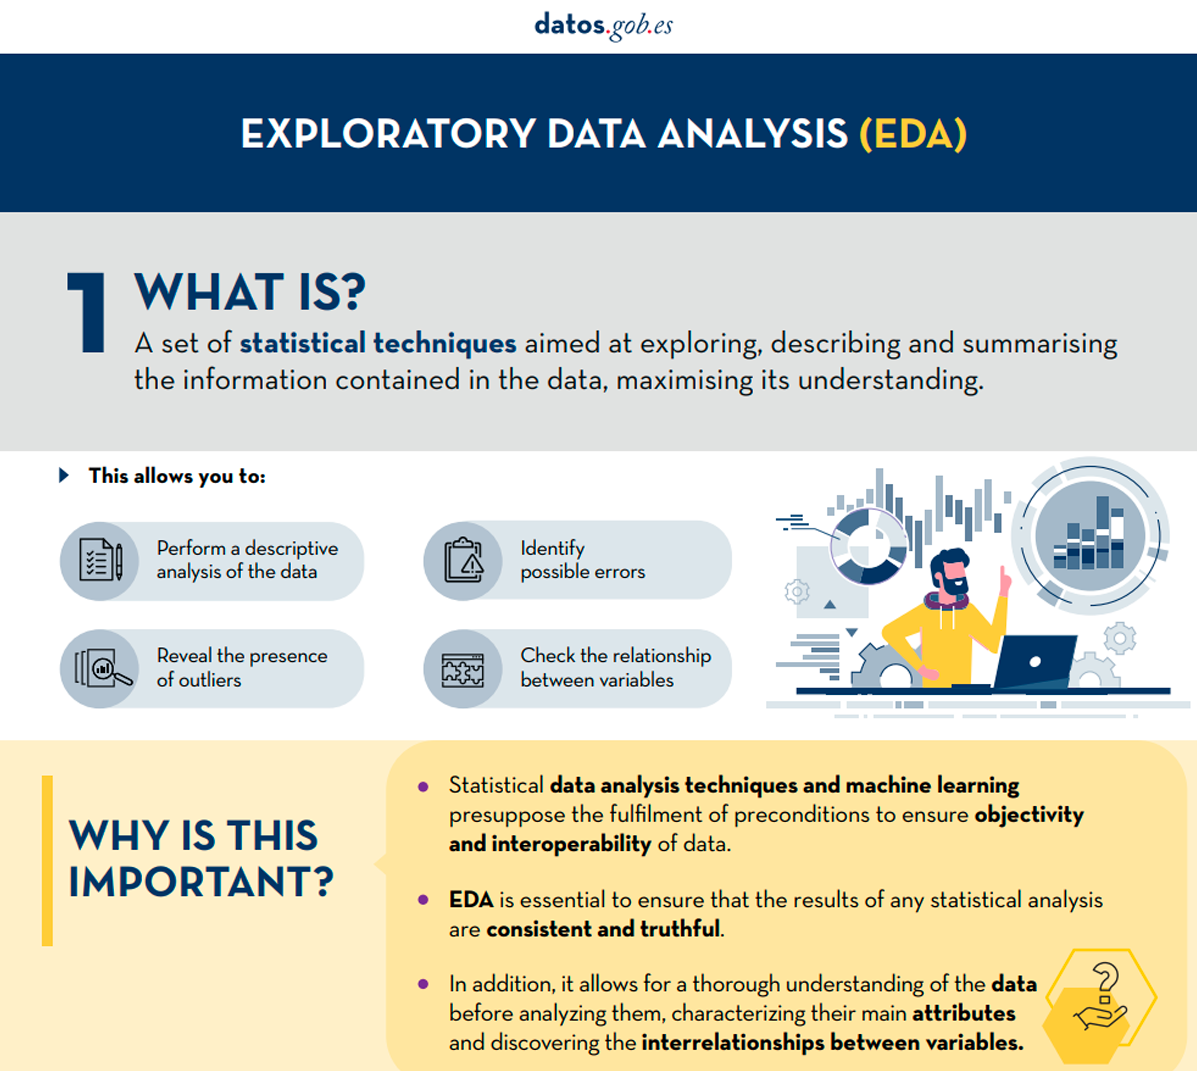
Figure 2. Capture of the infographic. Source: own elaboration.
Evento
Spatial and geospatial data are essential for decision-making, spatial planning and resource management. The ability to visualise and analyse data in a spatial context offers valuable tools to address complex challenges in areas ranging from defence to sustainability. Participating in events that address these issues not only broadens our knowledge, but also fosters collaboration and innovation in the sector.
In this post, we present two upcoming events dealing with geospatial data and its most innovative uses. Don't miss them!
II Conference on Geospatial Intelligence: Territory and Defence
The Instituto Geográfico de Aragón (IGEAR) in collaboration with the Academia General Militar, the Centro Universitario de la Defensa and Telespazio Ibérica, has organized the second edition of the Jornada de Inteligencia Geoespacial: Territory and Defence, an event that will bring together professionals from the sector to explore how geospatial data can optimize strategies in the field of security and territorial management.
During the next 21 November, the crown room of the Pignatelli Building in Zaragoza will bring together speakers and attendees to discuss the impact of geospatial intelligence in Spain. The event will be open to a maximum of 100 attendees by invitation.
Geospatial intelligence, or GEOINT for short, focuses on understanding the dynamics occurring within a given geographic space.To achieve this, GEOINT relies on detailed analysis of imagery, databases and other relevant information, based on the idea that, although the circumstances surrounding each situation may vary, there is one common characteristic: all action takes place at specific geographic coordinates.
GEOINT is a very broad field that can be applied both in the military field, to execute movements by analyzing the terrain, and in the scientific field , to study environments, or even in the business field, to help adapt census, historical, meteorological, agricultural and geological information to commercial uses.
The II Geospatial Intelligence Conference will present case studies and technological advances and will promote discussions on the future of geospatial intelligence in defense contexts. For more details, you can visit the event's website.
- When? On 21 November 2024 at 8:00h.
- Wheree? Crown Hall of the Pignatelli Building. Paseo María Agustín, 36. Zaragoza.
- How to access? Through this link.
XV Edition of the Iberian Conference on Spatial Data Infrastructures (JIIDE) and III geoEuskadi
This year, the Board of Directors of the Geographic Information Infrastructure of Spain (CODIIGE) is jointly organizing the Iberian Conference on Spatial Data Infrastructures (JIIDE ) and the III geoEuskadi Kongresua Congress. Both events aim to enhance and promote activities related to geographic information in various sectors, covering both the publication and standardized accessibility of geographic data as well as its production, processing and exploitation.
On the one hand, in the JIIDE collaborate the Direção-Geral do Território de Portugal, the Instituto Geográfico Nacional de España, through the Centro Nacional de Información Geográfica, and the Govern d'Andorra.
The geoEuskadi Kongresua is organised by the Directorate of Territorial Planning and Urban Agenda of the Basque Government. This year, all these entities will come together to carry out a single event under the slogan “The value of geospatial data”.
The conference will focus on new technological trends related to data accessibility and reuse, as well as current techniques for Earth observation and representation.
Digital geospatial data is a key driver for economic growth, competitiveness, innovation, job creation and social progress. Therefore, III geoEuskadi and the XV edition JIIDE 2024 will emphasize the importance of technologies, such as big data and artificial intelligence, to generate ideas that improve business decision making and the creation of systems that perform tasks that traditionally require human intervention.
In addition, collaboration for the co-production and harmonization of data between different administrations and organizations will be highlighted, something that continues to be essential to generate valuable geospatial data that can become true references. This is a time of renewal, driven by the revision of the INSPIRE Directive, the update of the regulations on environmental spatial data and the new regulations on open data and data governance that favor a modernization in the publication and reuse of these data.
During the event, examples of reuse of high-value datasets will also be presented, both through OGC APIs and through download services and interoperable formats.
The combination of these events will represent a privileged space to reflect on geographic information and will be a showcase for the most innovative projects in the Iberian Peninsula. In addition, there will be technical workshops to share specific knowledge and round tables to promote debate. To learn more about this event, visit the JIIDE portal..
- When? From 13 to 15 November.
- Where? Europa Conference Centre (Vitoria-Gasteiz).
- How do I register? Through this link.
Don't miss the opportunity to participate in these events that promote the advancement of the use of spatial and geospatial data. We encourage you to join this conference to learn, collaborate and contribute to the development of this constantly evolving sector.
Blog
Open data can transform how we interact with our cities, offering opportunities to improve quality of life. When made publicly available, they enable the development of innovative applications and tools that address urban challenges, from accessibility to road safety and participation.
Real-time information can have positive impacts on citizens. For example, applications that use open data can suggest the most efficient routes, considering factors such as traffic and ongoing construction; information on the accessibility of public spaces can improve mobility for people with disabilities; data on cycling or pedestrian routes encourages greener and healthier modes of transport; and access to urban data can empower citizens to participate in decision-making about their city. In other words, citizen use of open data not only improves the efficiency of the city and its services, but also promotes a more inclusive, sustainable and participatory city.
To illustrate these ideas, this article discusses maps for "navigating" cities, made with open data. In other words, initiatives are shown that improve the relationship between citizens and their urban environment from different aspects such as accessibility, school safety and citizen participation. The first project is Mapcesible, which allows users to map and assess the accessibility of different locations in Spain. The second, Eskola BideApp, a mobile application designed to support safe school routes. And finally, maps that promote transparency and citizen participation in urban management. The first identifies noise pollution, the second locates available services in various areas within 15 minutes and the third displays banks in the city. These maps use a variety of public data sources to provide a detailed overview of different aspects of urban life.
The first initiative is a project of a large foundation, the second a collaborative and local proposal, and the third a personal project. Although they are based on very different approaches, all three have in common the use of public and open data and the vocation to help people understand and experience the city. The variety of origins of these projects indicates that the use of public and open data is not limited to large organisations.
Below is a summary of each project, followed by a comparison and reflection on the use of public and open data in urban environments.
Mapcesible, map for people with reduced mobility
Mapcessible was launched in 2019 to assess the accessibility of various spaces such as shops, public toilets, car parks, accommodation, restaurants, cultural spaces and natural environments.

Figure 1. Mapcesible. Source: https://mapcesible.fundaciontelefonica.com/intro
This project is supported by organizations such as the NGO Spanish Confederation of People with Physical and Organic Disabilities (COCEMFE) and the company ILUNION. It currently has more than 40,000 evaluated accessible spaces and thousands of users.

Figure 2. Mapcesible. Source: https://mapcesible.fundaciontelefonica.com/filters
Mapcesible uses open data as part of its operation. Specifically, the application incorporates fourteen datasets from official bodies, including the Ministry of Agriculture and Environment, city councils of different cities (including Madrid and Barcelona) and regional governments. This open data is combined with information provided by the users of the application, who can map and evaluate the accessibility of the places they visit. This combination of official data and citizen collaboration allows Mapcesible to provide up-to-date and detailed information on the accessibility of various spaces throughout Spain, thus benefiting people with reduced mobility.
Eskola BideAPP, application to define safe school routes.
Eskola BideAPP is an application developed by Montera34 - a team dedicated to data visualisation and the development of collaborative projects - in alliance with the Solasgune Association to support school pathways. Eskola BideAPP has served to ensure that boys and girls can access their schools safely and efficiently. The project mainly uses public data from the OpenStreetMap, e.g. geographical and cartographic data on streets, pavements, crossings, as well as data collected during the process of creating safe routes for children to walk to school in order to promote their autonomy and sustainable mobility.
The application offers an interactive dashboard to visualise the collected data, the generation of paper maps for sessions with students, and the creation of reports for municipal technicians. It uses technologies such as QGIS (a free and open source geographic information system) and a development environment for the R programming language, dedicated to statistical computing and graphics.
The project is divided into three main stages:
- Data collection through questionnaires in classrooms.
- Analysis and discussion of results with the children to co-design personalised routes.
- Testing of the designed routes.
Figure 3. Eskola BideaAPP. Photo by Julián Maguna (Solasgune). Source: https://montera34.com/project/eskola-bideapp/
Pablo Rey, one of the promoters of Montera34 together with Alfonso Sánchez, reports for this article that Eskola BideAPP, since 2019, has been used in eight municipalities, including Derio, Erandio, Galdakao, Gatika, Plentzia, Leioa, Sopela and Bilbao. However, it is currently only operational in the latter two. "The idea is to implement it in Portugalete at the beginning of 2025," he adds.
It''s worth noting the maps from Montera34 that illustrated the effect of Airbnb in San Sebastián and other cities, as well as the data analyses and maps published during the COVID-19 pandemic, which also visualized public data.In addition, Montera34 has used public data to analyse abstention, school segregation, minor contracts or make open data available to the public. For this last project, Montera34 has started with the ordinances of the Bilbao City Council and the minutes of its plenary sessions, so that they are not only available in a PDF document but also in the form of open and accessible data.
Mapas de Madrid sobre contaminación acústica, servicios y ubicación de bancos
Abel Vázquez Montoro has made several maps with open data that are very interesting, for example, the one made with data from the Strategic Noise Map (MER) offered by the Madrid City Council and land registry data. The map shows the noise affecting each building, facade and floor in Madrid.

Figure 4. Noise maps in Madrid. Source: https://madb.netlify.app/.
This map is organised as a dashboard with three sections: general data of the area visible on the map, dynamic 2D and 3D map with configurable options and detailed information on specific buildings. It is an open, free, non-commercial platform that uses free and open source software such as GitLab - a web-based Git repository management platform - and QGIS. The map allows the assessment of compliance with noise regulations and the impact on quality of life, as it also calculates the health risk associated with noise levels, using the attributable risk ratio (AR%).
15-minCity is another interactive map that visualises the concept of the "15-minute city" applied to different urban areas, i.e. it calculates how accessible different services are within a 15-minute walking or cycling radius from any point in the selected city.

Figure 5. 15-minCity. Source: https://whatif.sonycsl.it/15mincity/15min.php?idcity=9166
Finally, "Where to sit in Madrid" is another interactive map that shows the location of benches and other places to sit in public spaces in Madrid, highlighting the differences between rich (generally with more public seating) and poor (with less) neighbourhoods. This map uses the map-making tool, Felt, to visualise and share geospatial information in an accessible way. The map presents different types of seating, including traditional benches, individual seats, bleachers and other types of seating structures.

Figure 6. Where to sit in Madrid. Source: https://felt.com/map/Donde-sentarse-en-Madrid-TJx8NGCpRICRuiAR3R1WKC?loc=40.39689,-3.66392,13.97z
Its maps visualise public data on demographic information (e.g. population data by age, gender and nationality), urban information on land use, buildings and public spaces, socio-economic data (e.g. income, employment and other economic indicators for different districts and neighbourhoods), environmental data, including air quality, green spaces and other related aspects, and mobility data.
What do they have in common?
| Name | Promoter | Type of data used | Profit motive | Users | Characteristics |
|---|---|---|---|---|---|
| Mapcesible | Telefónica Foundation | Combines user-generated and public data (14 open data sets from government agencies) | Non-profit | More than 5.000 | Collaborative app, available on iOS and Android, more than 40,000 mapped accessible points. |
| Eskola BideAPP | Montera34 and Solasgune Association | Combines user-generated and public data (classroom questionnaires) and some public data. | Non-profit. | 4.185 | Focus on safe school routes, uses QGIS and R for data processing |
| Mapa Estratégico de Ruido (MER) | Madrid City Council | 2D and 3D geographic and visible area data | Non-profit | No data | It allows the assessment of compliance with noise regulations and the impact on quality of life, as it also calculates the associated health risk. |
| 15 min-City | Sony GSL | Geographic data and services | Non-profit | No data | Interactive map visualising the concept of the "15-minute city" applied to different urban areas. |
| MAdB "Dónde sentarse en Madrid" | Private | Public data (demographic, electoral, urban, socio-economic, etc.) | Non-profit | No data | Interactive maps of Madrid |
Figure 7. Comparative table of solutions
These projects share the approach of using open data to improve access to urban services, although they differ in their specific objectives and in the way information is collected and presented. Mapcesible, Eskola BideApp, MAdB and "Where to sit in Madrid" are of great value.
On the one hand, Mapcesible offers unified and updated information that allows people with disabilities to move around the city and access services. Eskola BideApp involves the community in the design and testing of safe routes for walking to school; this not only improves road safety, but also empowers young people to be active agents in urban planning. In the meantime, 15-min city, MER and the maps developed by Vázquez Montoro visualise complex data about Madrid so that citizens can better understand how their city works and how decisions that affect them are made.
Overall, the value of these projects lies in their ability to create a data culture, teaching how to value, interpret and use information to improve communities.
Content created by Miren Gutiérrez, PhD and researcher at the University of Deusto, expert in data activism, data justice, data literacy, and gender disinformation. The contents and viewpoints reflected in this publication are the sole responsibility of the author.
Blog
Natural language processing (NLP) is a branch of artificial intelligence that allows machines to understand and manipulate human language. At the core of many modern applications, such as virtual assistants, machine translation and chatbots, are word embeddings. But what exactly are they and why are they so important?
What are word embeddings?
Word embeddings are a technique that allows machines to represent the meaning of words in such a way that complex relationships between words can be captured. To understand this, let's think about how words are used in a given context: a word acquires meaning depending on the words surrounding it. For example, the word bank can refer to a financial institution or to a headquarters, depending on the context in which it is found.
The idea behind word embeddings is that each word is assigned a vector in a multi-dimensional space. The position of these vectors in space reflects the semantic closeness between the words. If two words have similar meanings, their vectors will be close. If their meanings are opposite or unrelated, they are distant in vector space.
To visualise this, imagine that words like lake, river and ocean would be close together in this space, while words like lake and building would be much further apart. This structure enables language processing algorithms to perform complex tasks, such as finding synonyms, making accurate translations or even answering context-based questions.
How are word embeddings created?
The main objective of word embeddings is to capture semantic relationships and contextual information of words, transforming them into numerical representations that can be understood by machine learning algorithms. Instead of working with raw text, machines require words to be converted into numbers in order to identify patterns and relationships effectively.
The process of creating word embeddings consists of training a model on a large corpus of text, such as Wikipedia articles or news items, to learn the structure of the language. The first step involves performing a series of pre-processing on the corpus, which includes tokenise the words, removing punctuation and irrelevant terms, and, in some cases, converting the entire text to lower case to maintain consistency.
The use of context to capture meaning
Once the text has been pre-processed, a technique known as "sliding context window" is used to extract information. This means that, for each target word, the surrounding words within a certain range are taken into account. For example, if the context window is 3 words, for the word airplane in the sentence "The plane takes off at six o'clock", the context words will be The, takes off, to.
The model is trained to learn to predict a target word using the words in its context (or conversely, to predict the context from the target word). To do this, the algorithm adjusts its parameters so that the vectors assigned to each word are closer in vector space if those words appear frequently in similar contexts.
How models learn language structure
The creation of word embeddings is based on the ability of these models to identify patterns and semantic relationships. During training, the model adjusts the values of the vectors so that words that often share contexts have similar representations. For example, if airplane and helicopter are frequently used in similar phrases (e.g. in the context of air transport), the vectors of airplane and helicopter will be close together in vector space.
As the model processes more and more examples of sentences, it refines the positions of the vectors in the continuous space. Thus, the vectors reflect not only semantic proximity, but also other relationships such as synonyms, categories (e.g., fruits, animals) and hierarchical relationships (e.g., dog and animal).
A simplified example
Imagine a small corpus of only six words: guitar, bass, drums, piano, car and bicycle. Suppose that each word is represented in a three-dimensional vector space as follows:
guitar [0.3, 0.8, -0.1]
bass [0.4, 0.7, -0.2]
drums [0.2, 0.9, -0.1]
piano [0.1, 0.6, -0.3]
car [0.8, -0.1, 0.6]
bicycle [0.7, -0.2, 0.5]
In this simplified example, the words guitar, bass, drums and piano represent musical instruments and are located close to each other in vector space, as they are used in similar contexts. In contrast, car and bicycle, which belong to the category of means of transport, are distant from musical instruments but close to each other. This other image shows how different terms related to sky, wings and engineering would look like in a vector space.
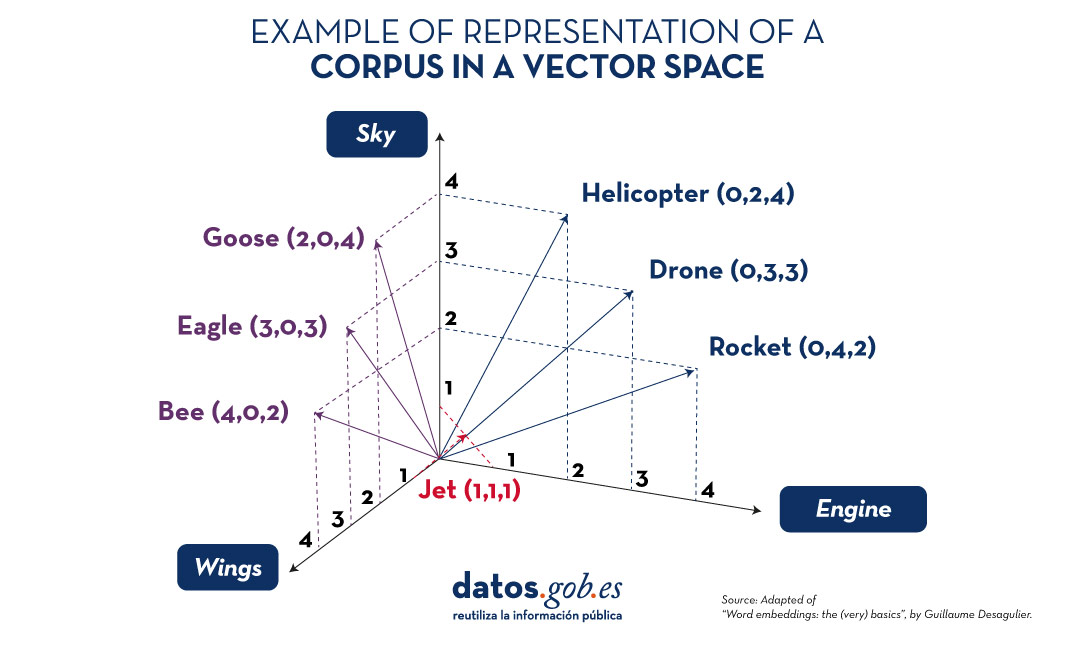
Figure 1. Examples of representation of a corpus in a vector space. Source: Adapted from “Word embeddings: the (very) basics”, by Guillaume Desagulier.
This example only uses three dimensions to illustrate the idea, but in practice, word embeddings usually have between 100 and 300 dimensions to capture more complex semantic relationships and linguistic nuances.
The result is a set of vectors that efficiently represent each word, allowing language processing models to identify patterns and semantic relationships more accurately. With these vectors, machines can perform advanced tasks such as semantic search, text classification and question answering, significantly improving natural language understanding.
Strategies for generating word embeddings
Over the years, multiple approaches and techniques have been developed to generate word embeddings. Each strategy has its own way of capturing the meaning and semantic relationships of words, resulting in different characteristics and uses. Some of the main strategies are presented below:
1. Word2Vec: local context capture
Developed by Google, Word2Vec is one of the most popular approaches and is based on the idea that the meaning of a word is defined by its context. It uses two main approaches:
- CBOW (Continuous Bag of Words): In this approach, the model predicts the target word using the words in its immediate environment. For example, given a context such as "The dog is ___ in the garden", the model attempts to predict the word playing, based on the words The, dog, is and garden.
- Skip-gram: Conversely, Skip-gram uses a target word to predict the surrounding words. Using the same example, if the target word is playing, the model would try to predict that the words in its environment are The, dog, is and garden.
The key idea is that Word2Vec trains the model to capture semantic proximity across many iterations on a large corpus of text. Words that tend to appear together have closer vectors, while unrelated words appear further apart.
2. GloVe: global statistics-based approach
GloVe, developed at Stanford University, differs from Word2Vec by using global co-occurrence statistics of words in a corpus. Instead of considering only the immediate context, GloVe is based on the frequency with which two words appear together in the whole corpus.
For example, if bread and butter appear together frequently, but bread and planet are rarely found in the same context, the model adjusts the vectors so that bread and butter are close together in vector space.
This allows GloVe to capture broader global relationships between words and to make the representations more robust at the semantic level. Models trained with GloVe tend to perform well on analogy and word similarity tasks.
3. FastText: subword capture
FastText, developed by Facebook, improves on Word2Vec by introducing the idea of breaking down words into sub-words. Instead of treating each word as an indivisible unit, FastText represents each word as a sum of n-grams. For example, the word playing could be broken down into play, ayi, ing, and so on.
This allows FastText to capture similarities even between words that did not appear explicitly in the training corpus, such as morphological variations (playing, play, player). This is particularly useful for languages with many grammatical variations.
4. Embeddings contextuales: dynamic sense-making
Models such as BERT and ELMo represent a significant advance in word embeddings. Unlike the previous strategies, which generate a single vector for each word regardless of the context, contextual embeddings generate different vectors for the same word depending on its use in the sentence.
For example, the word bank will have a different vector in the sentence "I sat on the park bench" than in "the bank approved my credit application". This variability is achieved by training the model on large text corpora in a bidirectional manner, i.e. considering not only the words preceding the target word, but also those following it.
Practical applications of word embeddings
ord embeddings are used in a variety of natural language processing applications, including:
- Named Entity Recognition (NER): allows you to identify and classify names of people, organisations and places in a text. For example, in the sentence "Apple announced its new headquarters in Cupertino", the word embeddings allow the model to understand that Apple is an organisation and Cupertino is a place.
- Automatic translation: helps to represent words in a language-independent way. By training a model with texts in different languages, representations can be generated that capture the underlying meaning of words, facilitating the translation of complete sentences with a higher level of semantic accuracy.
- Information retrieval systems: in search engines and recommender systems, word embeddings improve the match between user queries and relevant documents. By capturing semantic similarities, they allow even non-exact queries to be matched with useful results. For example, if a user searches for "medicine for headache", the system can suggest results related to analgesics thanks to the similarities captured in the vectors.
- Q&A systems: word embeddings are essential in systems such as chatbots and virtual assistants, where they help to understand the intent behind questions and find relevant answers. For example, for the question "What is the capital of Italy?", the word embeddings allow the system to understand the relationship between capital and Italy and find Rome as an answer.
- Sentiment analysis: word embeddings are used in models that determine whether the sentiment expressed in a text is positive, negative or neutral. By analysing the relationships between words in different contexts, the model can identify patterns of use that indicate certain feelings, such as joy, sadness or anger.
- Semantic clustering and similarity detection: word embeddings also allow you to measure the semantic similarity between documents, phrases or words. This is used for tasks such as grouping related items, recommending products based on text descriptions or even detecting duplicates and similar content in large databases.
Conclusion
Word embeddings have transformed the field of natural language processing by providing dense and meaningful representations of words, capable of capturing their semantic and contextual relationships. With the emergence of contextual embeddings , the potential of these representations continues to grow, allowing machines to understand even the subtleties and ambiguities of human language. From applications in translation and search systems, to chatbots and sentiment analysis, word embeddings will continue to be a fundamental tool for the development of increasingly advanced and humanised natural language technologies.
Content prepared by Juan Benavente, senior industrial engineer and expert in technologies linked to the data economy. The contents and points of view reflected in this publication are the sole responsibility of the author.
Evento
On 11, 12 and 13 November, a new edition of DATAforum Justice will be held in Granada. The event will bring together more than 100 speakers to discuss issues related to digital justice systems, artificial intelligence (AI) and the use of data in the judicial ecosystem.The event is organized by the Ministry of the Presidency, Justice and Relations with the Courts, with the collaboration of the University of Granada, the Andalusian Regional Government, the Granada City Council and the Granada Training and Management entity.
The following is a summary of some of the most important aspects of the conference.
An event aimed at a wide audience
This annual forum is aimed at both public and private sector professionals, without neglecting the general public, who want to know more about the digital transformation of justice in our country.
The DATAforum Justice 2024 also has a specific itinerary aimed at students, which aims to provide young people with valuable tools and knowledge in the field of justice and technology. To this end, specific presentations will be given and a DATAthon will be set up. These activities are particularly aimed at students of law, social sciences in general, computer engineering or subjects related to digital transformation. Attendees can obtain up to 2 ECTS credits (European Credit Transfer and Accumulation System): one for attending the conference and one for participating in the DATAthon.
Data at the top of the agenda
The Paraninfo of the University of Granada will host experts from the administration, institutions and private companies, who will share their experience with an emphasis on new trends in the sector, the challenges ahead and the opportunities for improvement.
The conference will begin on Monday 11 November at 9:00 a.m., with a welcome to the students and a presentation of DATAthon. The official inauguration, addressed to all audiences, will be at 11:35 a.m. and will be given by Manuel Olmedo Palacios, Secretary of State for Justice, and Pedro Mercado Pacheco, Rector of the University of Granada.
From then on, various talks, debates, interviews, round tables and conferences will take place, including a large number of data-related topics. Among other issues, the data management, both in administrations and in companies, will be discussed in depth. It will also address the use of open data to prevent everything from hoaxes to suicide and sexual violence.
Another major theme will be the possibilities of artificial intelligence for optimising the sector, touching on aspects such as the automation of justice, the making of predictions. It will include presentations of specific use cases, such as the use of AI for the identification of deceased persons, without neglecting issues such as the governance of algorithms.
The event will end on Wednesday 13 at 17:00 hours with the official closing ceremony. On this occasion, Félix Bolaños, Minister of the Presidency, Justice and Relations with the Cortes, will accompany the Rector of the University of Granada.
A Datathon to solve industry challenges through data
In parallel to this agenda, a DATAthon will be held in which participants will present innovative ideas and projects to improve justice in our society. It is a contest aimed at students, legal and IT professionals, research groups and startups.
Participants will be divided into multidisciplinary teams to propose solutions to a series of challenges, posed by the organisation, using data science oriented technologies. During the first two days, participants will have time to research and develop their original solution. On the third day, they will have to present a proposal to a qualified jury. The prizes will be awarded on the last day, before the closing ceremony and the Spanish wine and concert that will bring the 2024 edition of DATAfórum Justicia to a close.
In the 2023 edition, 35 people participated, divided into 6 teams that solved two case studies with public data and two prizes of 1,000 euros were awarded.
How to register
The registration period for the DATAforum Justice 2024 is now open. This must be done through the event website, indicating whether it is for the general public, public administration staff, private sector professionals or the media.
To participate in the DATAthon it is necessary to register also on the contest site.
Last year's edition, focusing on proposals to increase efficiency and transparency in judicial systems, was a great success, with over 800 registrants. This year again, a large number of people are expected, so we encourage you to book your place as soon as possible. This is a great opportunity to learn first-hand about successful experiences and to exchange views with experts in the sector.
Blog
A digital twin is a virtual, interactive representation of a real-world object, system or process. We are talking, for example, about a digital replica of a factory, a city or even a human body. These virtual models allow simulating, analysing and predicting the behaviour of the original element, which is key for optimisation and maintenance in real time.
Due to their functionalities, digital twins are being used in various sectors such as health, transport or agriculture. In this article, we review the benefits of their use and show two examples related to open data.
Advantages of digital twins
Digital twins use real data sources from the environment, obtained through sensors and open platforms, among others. As a result, the digital twins are updated in real time to reflect reality, which brings a number of advantages:
- Increased performance: one of the main differences with traditional simulations is that digital twins use real-time data for modelling, allowing better decisions to be made to optimise equipment and system performance according to the needs of the moment.
- Improved planning: using technologies based on artificial intelligence (AI) and machine learning, the digital twin can analyse performance issues or perform virtual "what-if" simulations. In this way, failures and problems can be predicted before they occur, enabling proactive maintenance.
- Cost reduction: improved data management thanks to a digital twin generates benefits equivalent to 25% of total infrastructure expenditure. In addition, by avoiding costly failures and optimizing processes, operating costs can be significantly reduced. They also enable remote monitoring and control of systems from anywhere, improving efficiency by centralizing operations.
- Customization and flexibility: by creating detailed virtual models of products or processes, organizations can quickly adapt their operations to meet changing environmental demands and individual customer/citizen preferences. For example, in manufacturing, digital twins enable customized mass production, adjusting production lines in real time to create unique products according to customer specifications. On the other hand, in healthcare, digital twins can model the human body to customize medical treatments, thereby improving efficacy and reducing side effects.
- Boosting experimentation and innovation: digital twins provide a safe and controlled environment for testing new ideas and solutions, without the risks and costs associated with physical experiments. Among other issues, they allow experimentation with large objects or projects that, due to their size, do not usually lend themselves to real-life experimentation.
- Improved sustainability: by enabling simulation and detailed analysis of processes and systems, organizations can identify areas of inefficiency and waste, thus optimizing the use of resources. For example, digital twins can model energy consumption and production in real time, enabling precise adjustments that reduce consumption and carbon emissions.
Examples of digital twins in Spain
The following three examples illustrate these advantages.
GeDIA project: artificial intelligence to predict changes in territories
GeDIA is a tool for strategic planning of smart cities, which allows scenario simulations. It uses artificial intelligence models based on existing data sources and tools in the territory.
The scope of the tool is very broad, but its creators highlight two use cases:
- Future infrastructure needs: the platform performs detailed analyses considering trends, thanks to artificial intelligence models. In this way, growth projections can be made and the needs for infrastructures and services, such as energy and water, can be planned in specific areas of a territory, guaranteeing their availability.
- Growth and tourism: GeDIA is also used to study and analyse urban and tourism growth in specific areas. The tool identifies patterns of gentrification and assesses their impact on the local population, using census data. In this way, demographic changes and their impact, such as housing needs, can be better understood and decisions can be made to facilitate equitable and sustainable growth.
This initiative has the participation of various companies and the University of Malaga (UMA), as well as the financial backing of Red.es and the European Union.
Digital twin of the Mar Menor: data to protect the environment
The Mar Menor, the salt lagoon of the Region of Murcia, has suffered serious ecological problems in recent years, influenced by agricultural pressure, tourism and urbanisation.
To better understand the causes and assess possible solutions, TRAGSATEC, a state-owned environmental protection agency, developed a digital twin. It mapped a surrounding area of more than 1,600 square kilometres, known as the Campo de Cartagena Region. In total, 51,000 nadir images, 200,000 oblique images and more than four terabytes of LiDAR data were obtained.
Thanks to this digital twin, TRAGSATEC has been able to simulate various flooding scenarios and the impact of installing containment elements or obstacles, such as a wall, to redirect the flow of water. They have also been able to study the distance between the soil and the groundwater, to determine the impact of fertiliser seepage, among other issues.
Challenges and the way forward
These are just two examples, but they highlight the potential of an increasingly popular technology. However, for its implementation to be even greater, some challenges need to be addressed, such as initial costs, both in technology and training, or security, by increasing the attack surface. Another challenge is the interoperability problems that arise when different public administrations establish digital twins and local data spaces. To address this issue further, the European Commission has published a guide that helps to identify the main organisational and cultural challenges to interoperability, offering good practices to overcome them.
In short, digital twins offer numerous advantages, such as improved performance or cost reduction. These benefits are driving their adoption in various industries and it is likely that, as current challenges are overcome, digital twins will become an essential tool for optimising processes and improving operational efficiency in an increasingly digitised world.
Blog
Many people use apps to get around in their daily lives. Apps such as Google Maps, Moovit or CityMapper provide the fastest and most efficient route to a destination. However, what many users are unaware of is that behind these platforms lies a valuable source of information: open data. By reusing public datasets, such as those related to air quality, traffic or public transport, these applications can provide a better service.
In this post, we will explore how the reuse of open data by these platforms empowers a smarter and more sustainable urban ecosystem .
Google Maps: aggregates air quality information and transport data into GTFS.
More than a billion people use Google Maps every month around the world. The tech giant offers a free, up-to-date world map that draws its data from a variety of sources, some of them open.
One of the functions provided by the app is information about the air quality in the user's location. The Air Quality Index (AQI) is a parameter that is determined by each country or region. The European benchmark can be consulted on this map which shows air quality by geolocated zones in real time.
To display the air quality of the user's location, Google Maps applies a model based on a multi-layered approach known as the "fusion approach". This method combines data from several input sources and weights the layers with a sophisticated procedure. The input layers are:
- Government reference monitoring stations
- Commercial sensor networks
- Global and regional dispersion models
- Dust and smoke fire models
- Satellite information
- Traffic data
- Ancillary information such as surface area
- Meteorology
In the case of Spain, this information is obtained from open data sources such as the Ministry of Ecological Transition and Demographic Challenge, the Regional Ministry of Environment, Territory and Housing of the Xunta de Galicia or the Community of Madrid. Open data sources used in other countries around the worldcan be found here .
Another functionality offered by Google Maps to plan the best routes to reach a destination is the information on public transport. These data are provided on a voluntary basis by the public companies providing transport services in each city. In order to make this open data available to the user, it is first dumped into Google Transit and must comply with the open public transport standard GTFS (General Transit Feed Specification).
Moovit: reusing open data to deliver real-time information
Moovit is another urban mobility app most used by Spaniards, which uses open and collaborative data to make it easier for users to plan their journeys by public transport.
Since its launch in 2012, the free-to-download app offers real-time information on the different transport options, suggests the best routes to reach the indicated destination, guides users during their journey (how long they have to wait, how many stops are left, when they have to get off, etc.) and provides constant updates in the event of any alteration in the service.
Like other mobility apps , it is also available in offline mode and allows you to save routes and frequent lines in "Favourites". It is also an inclusive solution as it integrates VoiceOver (iOs) or TalkBack (Android) for blind people.
The platform not only leverages open data provided by governments and local authorities, but also collects information from its users, allowing it to offer a dynamic and constantly updated service.
CityMapper: born as a reuser of open mobility data
The CityMapper development team recognises that the application was born with an open DNA that still remains. They reuse open datasets from, for example, OpenStreetMap at global level or RENFE and Cercanías Bilbao at national level. As the application becomes available in more cities, the list of open data reference sources from which it draws information grows.
The platform offers real-time information on public transport routes, including bus, train, metro and bike sharing. It also adds options for walking, cycling and ridesharing. It is designed to provide the most efficient and fastest route to a destinationby integrating data from different modes of transport into a single interface.
As we published in the monographic report "Municipal Innovation through Open Data" CityMapper mainly uses open data from local transport authorities, typically using the GTFS (General Transit Feed Specification) standard . However, when this data is not sufficient or accurate enough, CityMapper combines it with datasets generated by the application's own users who voluntarily collaborate. It also uses data enhanced and managed by the work of the company's own local employees. All this data is combined with artificial intelligence algorithms developed to optimise routes and provide recommendations tailored to users' needs.
In conclusion, the use of open data in transport is driving a significant transformation in the mobility sector in cities. Through their contribution to applications, users can access up-to-date and accurate data, plan their journeys efficiently and make informed decisions. Governments, for their part, have taken on the role of facilitators by enabling the dissemination of data through open platforms, optimising resources and fostering collaboration across sectors. In addition, open data has created new opportunities for developers and the private sector, who have contributed with technological solutions such as Google Maps, Moovit or CityMapper. Ultimately, the potential of open data to transform the future of urban mobility is undeniable.
Blog
Today, digital technologies are revolutionising various sectors, including the construction sector, driven by the European Digital Strategy which not only promotes innovation and the adoption of digital technologies, but also the use and generation of potentially open data. The incorporation of advanced technologies has fostered a significant transformation in construction project management, making information more accessible and transparent to all stakeholders.
One of the key elements in this transformation are Digital Building Permits and Digital Building Logs, concepts that are improving the efficiency of administrative processes and the execution of construction projects, and which can have a significant impact on the generation and management of data in the municipalities that adopt them.
Digital Building Permits (DBP) and Digital Building Logs (DBL) not only generate key information on infrastructure planning, execution and maintenance, but also make this data accessible to the public and other stakeholders. The availability of this open data enables advanced analysis, academic research, and the development of innovative solutions for building more sustainable and safer infrastructure.
What is the Digital Building Permit?
The Digital Building Permit is the digitalisation of traditional building permit processes. Traditionally, this process was manual, involving extensive exchange of physical documents and coordination between multiple stakeholders. With digitisation, this procedure is simplified and made more efficient, allowing for a faster, more transparent and less error-prone review. Furthermore, thanks to this digitisation, large amounts of valuable data are proactively generated that not only optimise the process, but can also be used to improve transparency and carry out research in the sector. This data can be harnessed for advanced analytics, contributing to the development of smarter and more sustainable infrastructures. It also facilitates the integration of technologies such as Building Information Modelling (BIM) and digital twins, which are essential for the development of smart infrastructures.
- BIM allows the creation of detailed digital representations of infrastructure, incorporating precise information about each building component. This digital model facilitates not only the design, but also the management and maintenance of the building throughout its life cycle. In Spain, the legislation related to the use of Building Information Modeling (BIM) is mainly governed by the Law 9/2017 on Public Sector Contracts. This law establishes the possibility to require the use of BIM in public works projects. This regulation aims to improve efficiency, transparency and sustainability in the procurement and execution of public works and services in Spain.
- Digital twins are virtual replicas of physical infrastructures that allow the behaviour of a building to be simulated and analysed in real time thanks to the data generated. This data is not only crucial for the functioning of the digital twin, but can also be used as open data for research, public policy improvement and transparency in the management of infrastructures. These digital twins are essential to anticipate problems before they occur, optimise energy efficiency and proactively manage maintenance.
Together, these technologies can not only streamline the permitting process, but also ensure that buildings are safer, more sustainable and aligned with current regulations, promoting the development of smart infrastructure in an increasingly digitised environment.
What is a Digital Building Log?
The Digital Building Log is a tool for keeping a detailed and digitised record of all activities, decisions and modifications made during the life of a construction project. This register includes data on permits issued, inspections carried out, design changes, and any other relevant interventions. It functions as a digital logbook that provides a transparent and traceable overview of the entire construction process.
This approach not only improves transparency and traceability, but also facilitates monitoring and compliance by keeping an up-to-date register accessible to all stakeholders.
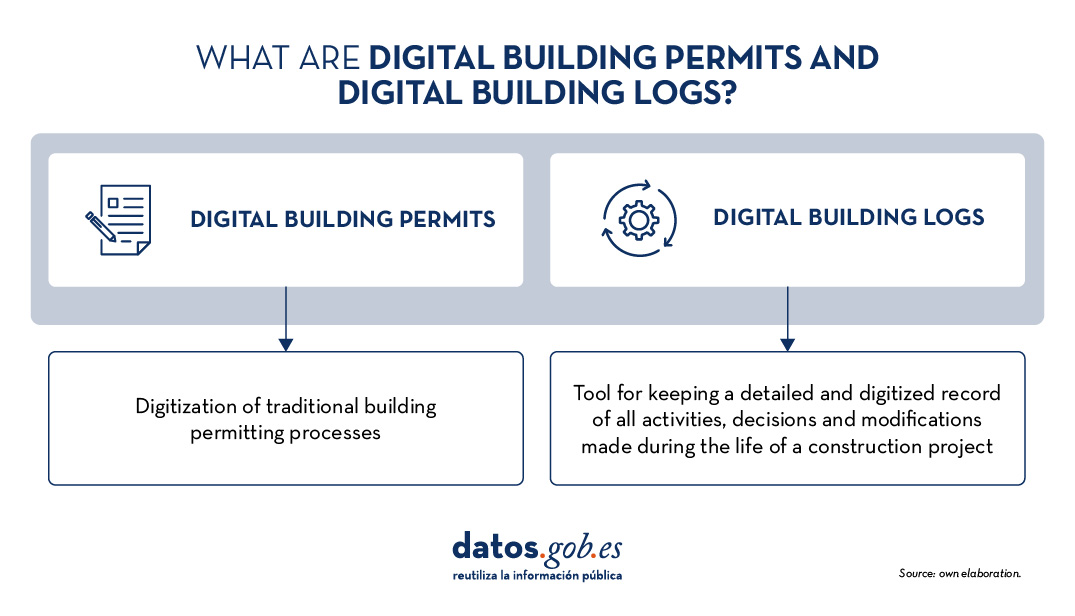
Figure 1. What are Digital Building Permits and Digital Building Logs? Own elaboration.
Key Projects and Objectives in the Sector
Several European projects are incorporating Digital Building Permits and Digital Building Logs as part of their strategy to modernise the construction sector. Some of the most innovative projects in this field are highlighted below:
ACCORD
The ACCORD Project (2022-2025) is an European initiative that aims to transform the process of obtaining and managing construction permits through digitisation. ACCORD, which stands for"Automated Compliance Checking and Orchestration of Building Projects", aims to develop a semantic framework to automatically check compliance, improve efficiency and ensure transparency in the building sector. In addition, ACCORD will develop:
- A rule formalisation tool based on semantic web technologies.
- A semantic rules database.
- Microservices for compliance verification in construction.
- A set of open and standardised APIs to enable integrated data flow between building permit, compliance and other information services.
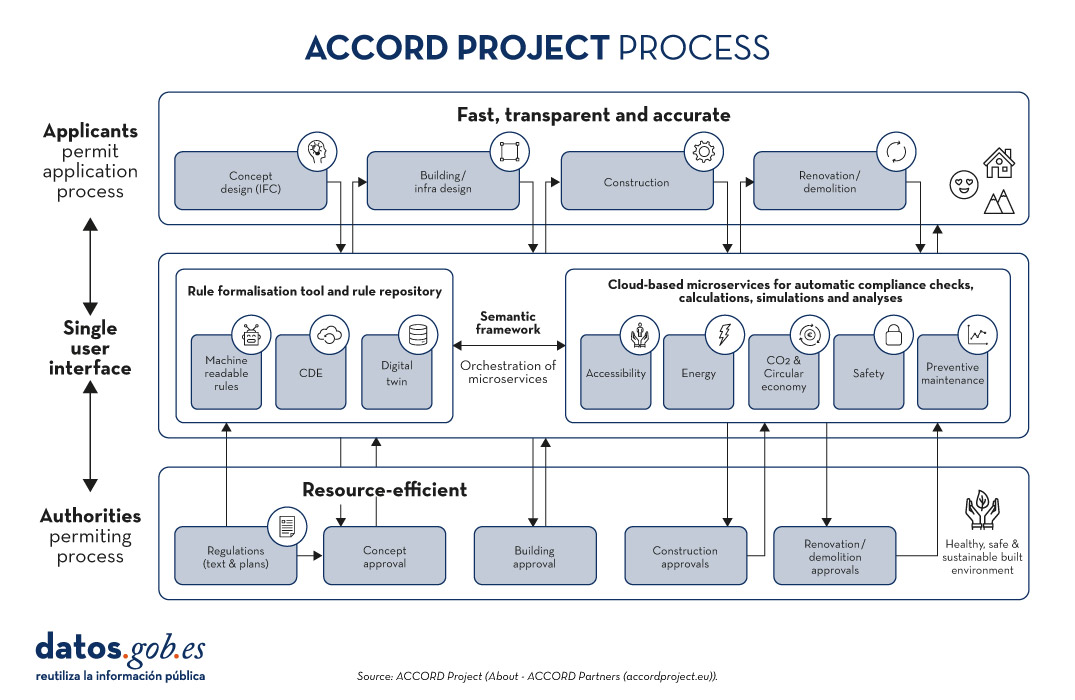
Figure 2. ACCORD project process.Source: Proyecto ACCORD.
The ACCORD Project focuses on several demonstrations in various European countries, each with a specific focus facilitated by the analysis and use of the data:
- In Estonia and Finland, ACCORD focuses on improving accessibility and safety in urban spaces through the automation of building permits. In Estonia, work is being done on automatic verification of compliance with planning and zoning regulations, while in Finland, the focus is on developing healthy and safe urban spaces by digitising the permitting process and integrating urban data.
- In Germany, ACCORD focuses on automated verification for land use permits and green building certification. The project aims to automate the verification of regulatory compliance in these areas by integrating micro-services that automatically verify whether construction projects comply with sustainability and land use regulations before permits are issued.
- In the UK, ACCORD focuses on ensuring the design integrity of structural components of steel modular homes by using BIM modelling and finite element analysis (FEA). This approach allows automatic verification of the compliance of structural components with safety and design standards prior to their implementation in construction. The project facilitates the early detection of potential structural failures, thus improving safety and efficiency in the construction process.
- In Spain, ACCORD focuses on automating urban planning compliance in Malgrat de Martown council using BIM and open cadastral data. The aim is to improve efficiency in the design and construction phase, ensuring that projects comply with local regulations before they start. This includes automatic verification of urban regulations to facilitate faster and more accurate building permits.
CHEK
The CHEK Project (2022-2025) which stands for"Change Toolkit for Digital Building Permit" is a European initiative that aims to remove the barriers municipalities face in adopting the digitisation of building permit management processes.
CHEK will develop scalable solutions including open standards and interoperability (geospatial and BIM), educational tools to bridge knowledge gaps and new technologies for permit digitisation and automatic compliance verification. The objective is to align digital technologies with municipal-level administrative processing, improve accuracy and efficiency, and demonstrate scalability in European urban areas, achieving a tRL 7E technology maturity level.
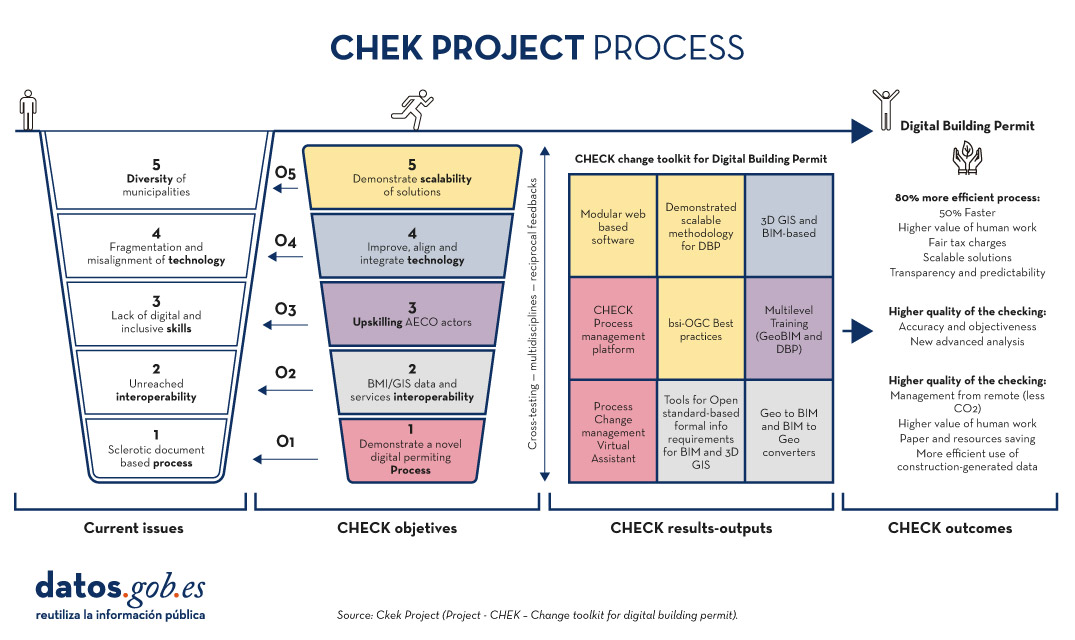
Figure 3. CHEK Project Process. Source: Proyecto CHEK.
This requires:
- Adapt available digital technologies to municipal processes, enabling new methods and business models.
- Develop open data standards, including building information modelling (BIM), 3D urban modelling and reciprocal integration (GeoBIM).
- Improve training for public employees and users.
- Improving, adapting and integrating technology.
- Realise and demonstrate scalability.
CHEK will provide a set of methodological and technological tools to fully digitise building permits and partially automate building design compliance checks, leading to a 60% efficiency improvement and the adoption of DBP by 85% of European municipalities.
The future of construction and the contribution to open data
The implementation of Digital Building Permits and Digital Building Logs is transforming the building landscape. As these tools are integrated into construction processes, future scenarios on the horizon include:
- Digitised construction: In the not too distant future, construction projects could be managed entirely digitally, from permit applications to ongoing project monitoring. This will eliminate the need for physical documents and significantly reduce errors and delays.
- Real-time digital cufflinks: Digital Building Logs will feed digital twins in real time, enabling continuous and predictive monitoring of projects. This will allow developers and regulators to anticipate problems before they occur and make informed decisions quickly.
- Global data interoperability: With the advancement of data spaces, building systems are expected to become globally interoperable. This will facilitate international collaboration and allow standards and best practices to be widely shared and adopted.
Digital Building Permits and Digital Building Logs are not only tools for process optimisation in the building sector, but also vehicles for the creation of open data that can be used by a wide range of actors. The implementation of these systems not only generates technical data on the progress of works, but also provides data that can be reused by authorities, developers and citizens, thus fostering an open collaborative environment. This data can be used to improve urban analysis, assist in public infrastructure planning and optimise monitoring and transparency in project implementation.
The use of open data through these platforms also facilitates the development of innovative applications and technological services that improve efficiency, promote sustainability and contribute to more efficient resource management in cities. Such open data can, for example, allow citizens to access information on building conditions in their area, while giving governments a clearer, real-time view of how projects are developing, enabling data-driven decision-making.
Projects such as ACCORD and CHECK demonstrate how these technologies can integrate digitalisation, automation and open data to transform the European construction sector.
Content prepared by Mayte Toscano, Senior Consultant in Data Economy Technologies. The contents and points of view reflected in this publication are the sole responsibility of its author.
Application
It is a website that compiles public information on the state of the different reservoirs in Spain. The user can filter the information by river basins and administrative units such as provinces or autonomous communities.
The data are updated daily and are shown with percentages and graphs. In addition, it also offers information on rain gauges and the comparison between the percentage of water currently embasada and the one that existed a year ago and 10 years ago.
Embales.net shares in a clear and understandable way open data obtained from AEMET and the Ministry of Ecological Transition and Demographic Challenge.