Application
embalses.info is a web platform that provides up-to-date information on the status of Spain’s reservoirs and dams. The application offers real-time hydrological data with weekly updates, allowing citizens, researchers, and public managers to consult water levels, capacities, and historical trends for more than 400 reservoirs organized into 16 river basins.
The application includes an interactive dashboard showing the overall status of Spanish reservoirs, an interactive (coming soon) basin map with filling levels, and detailed pages for each reservoir with weekly trend charts, comparisons with previous years, and historical records dating back to the 1980s. It features a powerful search engine, data analysis with interactive charts, and a contact form for suggestions.
From a technical standpoint, the platform uses Next.js 14+ with TypeScript on the frontend, Prisma ORM for data access, and PostgreSQL/SQL Server as the database. It is SEO-optimized with a dynamic XML sitemap, optimized meta tags, structured data, and friendly URLs. The site is fully responsive, accessible, and includes automatic light/dark mode.
The public value of the application lies in providing transparency and accessible information on Spain’s water resources, enabling farmers, public administrations, researchers, and the media to make informed decisions based on reliable and up-to-date data.
Blog
In any data management environment (companies, public administration, consortia, research projects), having data is not enough: if you don't know what data you have, where it is, what it means, who maintains it, with what quality, when it changed or how it relates to other data, then the value is very limited. Metadata —data about data—is essential for:
-
Visibility and access: Allow users to find what data exists and can be accessed.
-
Contextualization: knowing what the data means (definitions, units, semantics).
-
Traceability/lineage: Understanding where data comes from and how it has been transformed.
-
Governance and control: knowing who is responsible, what policies apply, permissions, versions, obsolescence.
-
Quality, integrity, and consistency: Ensuring data reliability through rules, metrics, and monitoring.
-
Interoperability: ensuring that different systems or domains can share data, using a common vocabulary, shared definitions, and explicit relationships.
In short, metadata is the lever that turns "siloed" data into a governed information ecosystem. As data grows in volume, diversity, and velocity, its function goes beyond simple description: metadata adds context, allows data to be interpreted, and makes it findable, accessible, interoperable, and reusable (FAIR).
In the new context driven by artificial intelligence, this metadata layer becomes even more relevant, as it provides the provenance information needed to ensure traceability, reliability, and reproducibility of results. For this reason, some recent frameworks extend these principles to FAIR-R, where the additional "R" highlights the importance of data being AI-ready, i.e. that it meets a series of technical, structural and quality requirements that optimize its use by artificial intelligence algorithms.
Thus, we are talking about enriched metadata, capable of connecting technical, semantic and contextual information to enhance machine learning, interoperability between domains and the generation of verifiable knowledge.
From traditional metadata to "rich metadata"
Traditional metadata
In the context of this article, when we talk about metadata with a traditional use, we think of catalogs, dictionaries, glossaries, database data models, and rigid structures (tables and columns). The most common types of metadata are:
-
Technical metadata: column type, length, format, foreign keys, indexes, physical locations.
-
Business/Semantic Metadata: Field Name, Description, Value Domain, Business Rules, Business Glossary Terms.
-
Operational/execution metadata: refresh rate, last load, processing times, usage statistics.
-
Quality metadata: percentage of null values, duplicates, validations.
-
Security/access metadata: access policies, permissions, sensitivity rating.
-
Lineage metadata: Transformation tracing in data pipelines .
This metadata is usually stored in repositories or cataloguing tools, often with tabular structures or relational bases, with predefined links.
Why "rich metadata"?
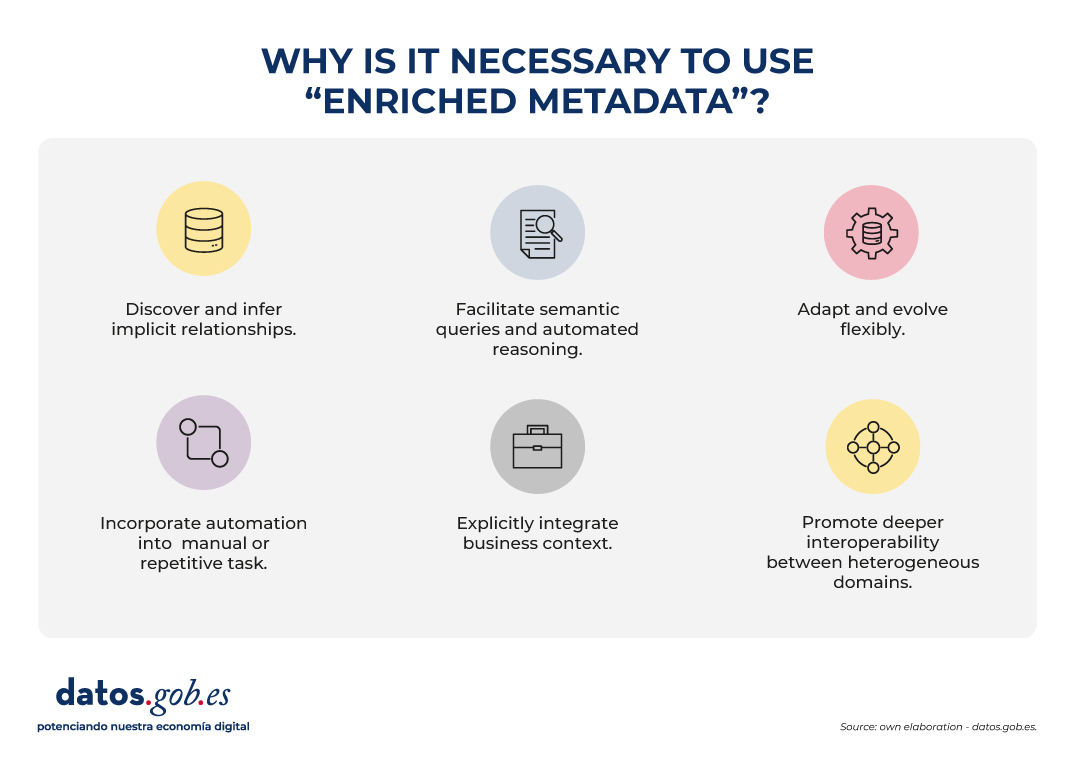
Rich metadata is a layer that not only describes attributes, but also:
- They discover and infer implicit relationships, identifying links that are not expressly defined in data schemas. This allows, for example, to recognize that two variables with different names in different systems actually represent the same concept ("altitude" and "elevation"), or that certain attributes maintain a hierarchical relationship ("municipality" belongs to "province").
- They facilitate semantic queries and automated reasoning, allowing users and machines to explore relationships and patterns that are not explicitly defined in databases. Rather than simply looking for exact matches of names or structures, rich metadata allows you to ask questions based on meaning and context. For example, automatically identifying all datasets related to "coastal cities" even if the term does not appear verbatim in the metadata.
- They adapt and evolve flexibly, as they can be extended with new entity types, relationships, or domains without the need to redesign the entire catalog structure. This allows new data sources, models or standards to be easily incorporated, ensuring the long-term sustainability of the system.
- They incorporate automation into tasks that were previously manual or repetitive, such as duplication detection, automatic matching of equivalent concepts, or semantic enrichment using machine learning. They can also identify inconsistencies or anomalies, improving the quality and consistency of metadata.
- They explicitly integrate the business context, linking each data asset to its operational meaning and its role within organizational processes. To do this, they use controlled vocabularies, ontologies or taxonomies that facilitate a common understanding between technical teams, analysts and business managers.
- They promote deeper interoperability between heterogeneous domains, which goes beyond the syntactic exchange facilitated by traditional metadata. Rich metadata adds a semantic layer that allows you to understand and relate data based on its meaning, not just its format. Thus, data from different sources or sectors – for example, Geographic Information Systems (GIS), Building Information Modeling (BIM) or the Internet of Things (IoT) – can be linked in a coherent way within a shared conceptual framework. This semantic interoperability is what makes it possible to integrate knowledge and reuse information between different technical and organizational contexts.
This turns metadata into a living asset, enriched and connected to domain knowledge, not just a passive "record".
The Evolution of Metadata: Ontologies and Knowledge Graphs
The incorporation of ontologies and knowledge graphs represents a conceptual evolution in the way metadata is described, related and used, hence we speak of enriched metadata. These tools not only document the data, but connect them within a network of meaning, allowing the relationships between entities, concepts, and contexts to be explicit and computable.
In the current context, marked by the rise of artificial intelligence, this semantic structure takes on a fundamental role: it provides algorithms with the contextual knowledge necessary to interpret, learn and reason about data in a more accurate and transparent way. Ontologies and graphs allow AI systems not only to process information, but also to understand the relationships between elements and to generate grounded inferences, opening the way to more explanatory and reliable models.
This paradigm shift transforms metadata into a dynamic structure, capable of reflecting the complexity of knowledge and facilitating semantic interoperability between different domains and sources of information. To understand this evolution, it is necessary to define and relate some concepts:
Ontologies
In the world of data, an ontology is a highly organized conceptual map that clearly defines:
- What entities exist (e.g., city, river, road).
- What properties they have (e.g. a city has a name, town, zip code).
- How they relate to each other (e.g. a river runs through a city, a road connects two municipalities).
The goal is for people and machines to share the same vocabulary and understand data in the same way. Ontologies allow:
- Define concepts and relationships: for example, "a plot belongs to a municipality", "a building has geographical coordinates".
- Set rules and restrictions: such as "each building must be exactly on a cadastral plot".
- Unify vocabularies: if in one system you say "plot" and in another "cadastral unit", ontology helps to recognize that they are analogous.
- Make inferences: from simple data, discover new knowledge (if a building is on a plot and the plot in Seville, it can be inferred that the building is in Seville).
- Establish a common language: they work as a dictionary shared between different systems or domains (GIS, BIM, IoT, cadastre, urban planning).
In short: an ontology is the dictionary and the rules of the game that allow different geospatial systems (maps, cadastre, sensors, BIM, etc.) to understand each other and work in an integrated way.
Knowledge Graphs
A knowledge graph is a way of organizing information as if it were a network of concepts connected to each other.
-
Nodes represent things or entities, such as a city, a river, or a building.
-
The edges (lines) show the relationships between them, for example: "is in", "crosses" or "belongs to".
-
Unlike a simple drawing of connections, a knowledge graph also explains the meaning of those relationships: it adds semantics.
A knowledge graph combines three main elements:
-
Data: specific cases or instances, such as "Seville", "Guadalquivir River" or "Seville City Hall Building".
-
Semantics (or ontology): the rules and vocabularies that define what kinds of things exist (cities, rivers, buildings) and how they can relate to each other.
-
Reasoning: the ability to discover new connections from existing ones (for example, if a river crosses a city and that city is in Spain, the system can deduce that the river is in Spain).
In addition, knowledge graphs make it possible to connect information from different fields (e.g. data on people, places and companies) under the same common language, facilitating analysis and interoperability between disciplines.
In other words, a knowledge graph is the result of applying an ontology (the data model) to several individual datasets (spatial elements, other territory data, patient records or catalog products, etc.). Knowledge graphs are ideal for integrating heterogeneous data, because they do not require a previously complete rigid schema: they can be grown flexibly. In addition, they allow semantic queries and navigation with complex relationships. Here's an example for spatial data to understand the differences:
|
Spatial data ontology (conceptual model) |
Knowledge graph (specific examples with instances) |
|---|---|
|
|
|
|
Use Cases
To better understand the value of smart metadata and semantic catalogs, there is nothing better than looking at examples where they are already being applied. These cases show how the combination of ontologies and knowledge graphs makes it possible to connect dispersed information, improve interoperability and generate actionable knowledge in different contexts.
From emergency management to urban planning or environmental protection, different international projects have shown that semantics is not just theory, but a practical tool that transforms data into decisions.
Some relevant examples include:
- LinkedGeoData that converted OpenStreetMap data into Linked Data, linking it to other open sources.
- Virtual Singapore is a 3D digital twin that integrates geospatial, urban and real-time data for simulation and planning.
- JedAI-spatial is a tool for interconnecting 3D spatial data using semantic relationships.
- SOSA Ontology, a standard widely used in sensor and IoT projects for environmental observations with a geospatial component.
- European projects on digital building permits (e.g. ACCORD), which combine semantic catalogs, BIM models, and GIS data to automatically validate building regulations.
Conclusions
The evolution towards rich metadata, supported by ontologies, knowledge graphs and FAIR-R principles, represents a substantial change in the way data is managed, connected and understood. This new approach makes metadata an active component of the digital infrastructure, capable of providing context, traceability and meaning, and not just describing information.
Rich metadata allows you to learn from data, improve semantic interoperability between domains, and facilitate more expressive queries, where relationships and dependencies can be discovered in an automated way. In this way, they favor the integration of dispersed information and support both informed decision-making and the development of more explanatory and reliable artificial intelligence models.
In the field of open data, these advances drive the transition from descriptive repositories to ecosystems of interconnected knowledge, where data can be combined and reused in a flexible and verifiable way. The incorporation of semantic context and provenance reinforces transparency, quality and responsible reuse.
This transformation requires, however, a progressive and well-governed approach: it is essential to plan for systems migration, ensure semantic quality, and promote the participation of multidisciplinary communities.
In short, rich metadata is the basis for moving from isolated data to connected and traceable knowledge, a key element for interoperability, sustainability and trust in the data economy.
Content prepared by Mayte Toscano, Senior Consultant in Data Economy Technologies. The contents and points of view reflected in this publication are the sole responsibility of the author.
Blog
Open data has great potential to transform the way we interact with our cities. As they are available to all citizens, they allow the development of applications and tools that respond to urban challenges such as accessibility, road safety or citizen participation. Facilitating access to this information not only drives innovation, but also contributes to improving the quality of life in urban environments.
This potential becomes even more relevant if we consider the current context. Accelerated urban growth has brought with it new challenges, especially in the area of public health. According to data from the United Nations, it is estimated that by 2050 more than 68% of the world's population will live in cities. Therefore, the design of healthy urban environments is a priority in which open data is consolidated as a key tool: it allows planning more resilient, inclusive and sustainable cities, putting people's well-being at the center of decisions. In this post, we tell you what healthy urban environments are and how open data can help build and maintain them.
What are Healthy Urban Environments? Uses and examples
Healthy urban environments go beyond simply the absence of pollution or noise. According to the World Health Organization (WHO), these spaces must actively promote healthy lifestyles, facilitate physical activity, encourage social interaction, and ensure equitable access to basic services. As established in the Ministry of Health's "Guide to Planning Healthy Cities", these environments are characterized by three key elements:
-
Cities designed for walking: they must be spaces that prioritize pedestrian and cycling mobility, with safe, accessible and comfortable streets that invite active movement.
-
Incorporation of nature: they integrate green areas, blue infrastructure and natural elements that improve air quality, regulate urban temperature and offer spaces for recreation and rest.
-
Meeting and coexistence spaces: they have areas that facilitate social interaction, reduce isolation and strengthen the community fabric.
The role of open data in healthy urban environments
In this scenario, open data acts as the nervous system of smart cities, providing valuable information on usage patterns, citizen needs, and public policy effectiveness. Specifically, in the field of healthy urban spaces, data from:
-
Analysis of physical activity patterns: data on mobility, use of sports facilities and frequentation of green spaces reveal where and when citizens are most active, identifying opportunities to optimize existing infrastructure.
-
Environmental quality monitoring: urban sensors that measure air quality, noise levels, and temperature provide real-time information on the health conditions of different urban areas.
-
Accessibility assessment: public transport, pedestrian infrastructure and service distribution allow for the identification of barriers to access and the design of more inclusive solutions.
-
Informed citizen participation: open data platforms facilitate participatory processes where citizens can contribute local information and collaborate in decision-making.
The Spanish open data ecosystem has solid platforms that feed healthy urban space projects. For example, the Madrid City Council's Open Data Portal offers real-time information on air quality as well as a complete inventory of green areas. Barcelona also publishes data on air quality, including the locations and characteristics of measuring stations.
These portals not only store information, but structure it in a way that developers, researchers and citizens can create innovative applications and services.
Use Cases: Applications That Reuse Open Data
Several projects demonstrate how open data translates into tangible improvements for urban health. On the one hand, we can highlight some applications or digital tools such as:
-
AQI Air Quality Index: uses government data to provide real-time information on air quality in different Spanish cities.
-
GV Aire: processes official air quality data to generate citizen alerts and recommendations.
-
National Air Quality Index: centralizes information from measurement stations throughout the country.
-
Valencia Verde: uses municipal data to show the location and characteristics of parks and gardens in Valencia.
On the other hand, there are initiatives that combine multisectoral open data to offer solutions that improve the interaction between cities and citizens. For example:
-
Supermanzanas Program: uses maps showing air quality pollution levels and traffic data available in open formats such as CSV and GeoPackage from Barcelona Open Data and Barcelona City Council to identify streets where reducing road traffic can maximize health benefits, creating safe spaces for pedestrians and cyclists.
-
The DataActive platform: seeks to establish an international infrastructure in which researchers, public and private sports entities participate. The topics it addresses include land management, urban planning, sustainability, mobility, air quality and environmental justice. It aims to promote more active, healthy and accessible urban environments through the implementation of strategies based on open data and research.
Data availability is complemented by advanced visualization tools. The Madrid Spatial Data Infrastructure (IDEM) offers geographic viewers specialized in air quality and the National Geographic Institute (IGN) offers the national street map CartoCiudad with information on all cities in Spain.
Effective governance and innovation ecosystem
However, the effectiveness of these initiatives depends on new governance models that integrate multiple actors. To achieve proper coordination between public administrations at different levels, private companies, third sector organizations and citizens, it is essential to have quality open data.
Open data not only powers specific applications but creates an entire ecosystem of innovation. Independent developers, startups, research centers, and citizen organizations use this data to:
-
Develop urban health impact studies.
-
Create participatory planning tools.
-
Generate early warnings about environmental risks.
-
Evaluate the effectiveness of public policies.
-
Design personalized services according to the needs of different population groups.
Healthy urban spaces projects based on open data generate multiple tangible benefits:
-
Efficiency in public management: data makes it possible to optimize the allocation of resources, prioritize interventions and evaluate their real impact on citizen health.
-
Innovation and economic development: the open data ecosystem stimulates the creation of innovative startups and services that improve the quality of urban life, as demonstrated by the multiple applications available in datos.gob.es.
-
Transparency and participation: the availability of data facilitates citizen control and strengthens democratic decision-making processes.
-
Scientific evidence: Urban health data contributes to the development of evidence-based public policies and the advancement of scientific knowledge.
-
Replicability: successful solutions can be adapted and replicated in other cities, accelerating the transformation towards healthier urban environments.
In short, the future of our cities depends on our ability to integrate technology, citizen participation and innovative public policies. The examples analyzed demonstrate that open data is not just information; They are the foundation for building urban environments that actively promote health, equity, and sustainability.
Blog
Open data from public sources has evolved over the years, from being simple repositories of information to constituting dynamic ecosystems that can transform public governance. In this context, artificial intelligence (AI) emerges as a catalytic technology that benefits from the value of open data and exponentially enhances its usefulness. In this post we will see what the mutually beneficial symbiotic relationship between AI and open data looks like.
Traditionally, the debate on open data has focused on portals: the platforms on which governments publish information so that citizens, companies and organizations can access it. But the so-called "Third Wave of Open Data," a term by New York University's GovLab, emphasizes that it is no longer enough to publish datasets on demand or by default. The important thing is to think about the entire ecosystem: the life cycle of data, its exploitation, maintenance and, above all, the value it generates in society.
What role can open data play in AI?
In this context, AI appears as a catalyst capable of automating tasks, enriching open government data (DMOs), facilitating its understanding and stimulating collaboration between actors.
Recent research, developed by European universities, maps how this silent revolution is happening. The study proposes a classification of uses according to two dimensions:
- Perspective, which in turn is divided into two possible paths:
- Inward-looking (portal): The focus is on the internal functions of data portals.
- Outward-looking (ecosystem): the focus is extended to interactions with external actors (citizens, companies, organizations).
- Phases of the data life cycle, which can be divided into pre-processing, exploration, transformation and maintenance.
In summary, the report identifies these eight types of AI use in government open data, based on perspective and phase in the data lifecycle.
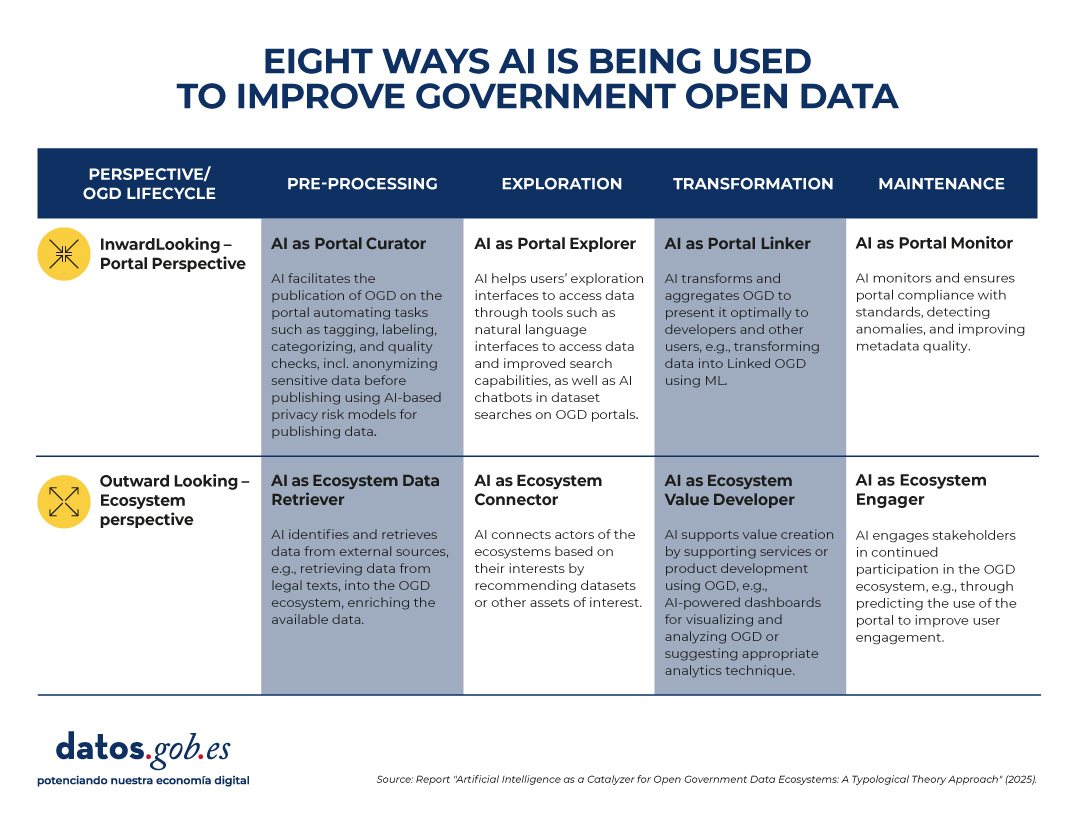
Figure 1. Eight uses of AI to improve government open data. Source: presentation “Data for AI or AI for data: artificial intelligence as a catalyst for open government ecosystems”, based on the report of the same name, from EU Open Data Days 2025.
Each of these uses is detailed below:
1. Portal curator
This application focuses on pre-processing data within the portal. AI helps organize, clean, anonymize, and tag datasets before publication. Some examples of tasks are:
- Automation and improvement of data publication tasks.
- Performing auto-tagging and categorization functions.
- Data anonymization to protect privacy.
- Automatic cleaning and filtering of datasets.
- Feature extraction and missing data handling.
2. Ecosystem data retriever
Also in the pre-processing phase, but with an external focus, AI expands the coverage of portals by identifying and collecting information from diverse sources. Some tasks are:
- Retrieve structured data from legal or regulatory texts.
- News mining to enrich datasets with contextual information.
- Integration of urban data from sensors or digital records.
- Discovery and linking of heterogeneous sources.
- Conversion of complex documents into structured information.
3. Portal explorer
In the exploration phase, AI systems can also make it easier to find and interact with published data, with a more internal approach. Some use cases:
- Develop semantic search engines to locate datasets.
- Implement chatbots that guide users in data exploration.
- Provide natural language interfaces for direct queries.
- Optimize the portal's internal search engines.
- Use language models to improve information retrieval.
4. Ecosystem connector
Operating also in the exploration phase, AI acts as a bridge between actors and ecosystem resources. Some examples are:
- Recommend relevant datasets to researchers or companies.
- Identify potential partners based on common interests.
- Extract emerging themes to support policymaking.
- Visualize data from multiple sources in interactive dashboards.
- Personalize data suggestions based on social media activity.
5. Portal linker
This functionality focuses on the transformation of data within the portal. Its function is to facilitate the combination and presentation of information for different audiences. Some tasks are:
- Convert data into knowledge graphs (structures that connect related information, known as Linked Open Data).
- Summarize and simplify data with NLP (Natural Language Processing) techniques.
- Apply automatic reasoning to generate derived information.
- Enhance multivariate visualization of complex datasets.
- Integrate diverse data into accessible information products.
6. Ecosystem value developer
In the transformation phase and with an external perspective, AI generates products and services based on open data that provide added value. Some tasks are:
- Suggest appropriate analytical techniques based on the type of dataset.
- Assist in the coding and processing of information.
- Create dashboards based on predictive analytics.
- Ensure the correctness and consistency of the transformed data.
- Support the development of innovative digital services.
7. Portal monitor
It focuses on portal maintenance, with an internal focus. Their role is to ensure quality, consistency, and compliance with standards. Some tasks are:
- Detect anomalies and outliers in published datasets.
- Evaluate the consistency of metadata and schemas.
- Automate data updating and purification processes.
- Identify incidents in real time for correction.
- Reduce maintenance costs through intelligent monitoring.
8. Ecosystem engager
And finally, this function operates in the maintenance phase, but outwardly. It seeks to promote citizen participation and continuous interaction. Some tasks are:
- Predict usage patterns and anticipate user needs.
- Provide personalized feedback on datasets.
- Facilitate citizen auditing of data quality.
- Encourage participation in open data communities.
- Identify user profiles to design more inclusive experiences.
What does the evidence tell us?
The study is based on a review of more than 70 academic papers examining the intersection between AI and OGD (open government data). From these cases, the authors observe that:
- Some of the defined profiles, such as portal curator, portal explorer and portal monitor, are relatively mature and have multiple examples in the literature.
- Others, such as ecosystem value developer and ecosystem engager, are less explored, although they have the most potential to generate social and economic impact.
- Most applications today focus on automating specific tasks, but there is a lot of scope to design more comprehensive architectures, combining several types of AI in the same portal or across the entire data lifecycle.
From an academic point of view, this typology provides a common language and conceptual structure to study the relationship between AI and open data. It allows identifying gaps in research and guiding future work towards a more systemic approach.
In practice, the framework is useful for:
- Data portal managers: helps them identify what types of AI they can implement according to their needs, from improving the quality of datasets to facilitating interaction with users.
- Policymakers: guides them on how to design AI adoption strategies in open data initiatives, balancing efficiency, transparency, and participation.
- Researchers and developers: it offers them a map of opportunities to create innovative tools that address specific ecosystem needs.
Limitations and next steps of the synergy between AI and open data
In addition to the advantages, the study recognizes some pending issues that, in a way, serve as a roadmap for the future. To begin with, several of the applications that have been identified are still in early stages or are conceptual. And, perhaps most relevantly, the debate on the risks and ethical dilemmas of the use of AI in open data has not yet been addressed in depth: bias, privacy, technological sustainability.
In short, the combination of AI and open data is still a field under construction, but with enormous potential. The key will be to move from isolated experiments to comprehensive strategies, capable of generating social, economic and democratic value. AI, in this sense, does not work independently of open data: it multiplies it and makes it more relevant for governments, citizens and society in general.
Blog
In a world where immediacy is becoming increasingly important, predictive commerce has become a key tool for anticipating consumer behaviors, optimizing decisions, and offering personalized experiences. It's no longer just about reacting to the customer's needs, it's about predicting what they want before they even know it.
In this article we are going to explain what predictive commerce is and the importance of open data in it, including real examples.
What is predictive commerce?
Predictive commerce is a strategy based on data analysis to anticipate consumers' purchasing decisions. It uses artificial intelligence algorithms and statistical models to identify patterns of behavior, preferences, and key moments in the consumption cycle. Thanks to this, companies can know relevant information about which products will be most in demand, when and where a purchase will be made or which customers are most likely to purchase a certain brand.
This is of great importance in a market like the current one, where there is a saturation of products and competition. Predictive commerce allows companies to adjust inventories, prices, marketing campaigns or logistics in real time, becoming a great competitive advantage.
The role of open data in predictive commerce
These models are fed by large volumes of data: purchase history, web browsing, location or comments on social networks, among others. But the more accurate and diverse the data, the more fine-tuned the predictions will be. This is where open data plays a fundamental role, as it allows new variables to be taken into account when defining consumer behavior. Among other things, open data can help us:
- Enrich prediction models with external information such as demographic data, urban mobility or economic indicators.
- Detect regional patterns that influence consumption, such as the impact of climate on the sale of certain seasonal products.
- Design more inclusive strategies by incorporating public data on the habits and needs of different social groups.
The following table shows examples of datasets available in datos.gob.es that can be used for these tasks, at a national level, although many autonomous communities and city councils also publish this type of data along with others also of interest.
| Dataset | Example | Possible use |
|---|---|---|
| Municipal register by age and sex | National Institute of Statistics (INE) | Segment populations by territory, age, and gender. It is useful for customizing campaigns based on the majority population of each municipality or forecasting demand by demographic profile. |
| Household Budget Survey | National Institute of Statistics (INE) | It offers information on the average expenditure per household in different categories. It can help anticipate consumption patterns by socioeconomic level. |
| Consumer Price Index (CPI) | National Institute of Statistics (INE) | It disaggregates the CPI by territory, measuring how the prices of goods and services vary in each Spanish province. It is useful for adjusting prices and market penetration strategies. |
| Real-time weather warnings | Ministry for the Ecological Transition and Demographic Challenge | Alert of adverse weather phenomena. It allows correlating weather with product sales (clothing, beverages, heating, etc.). |
| Education and Digital Literacy Statistics | National Institute of Statistics (INE) | Provides information on internet usage in the last 3 months. It allows digital gaps to be identified and communication or training strategies to be adapted. |
| Facts about tourist stays | National Institute of Statistics (INE) | It reports on the average stay of tourists by autonomous community. It helps to anticipate demand in areas with high seasonal influx, such as local products or tourist services. |
| Number of prescriptions and pharmaceutical expenditure | General Mutual Society for Civil Servants of the State (MUFACE) | It offers information on the consumption of medicines by province and age subgroups. It facilitates the estimation of sales of other related medical and parapharmacy products by estimating how many users will go to the pharmacy. |
Real-world use cases
For years, we have already found companies that are using this type of data to optimize their business strategies. Let's look at some examples:
- Using weather data to optimize stock in large supermarkets
Walmart department stores use AI algorithms that incorporate weather data (such as heat waves, storms, or temperature changes) along with historical sales data, events, and digital trends, to forecast demand at a granular level and optimize inventories. This allows the replenishment of critical products to be automatically adjusted according to anticipated weather patterns. In addition, Walmart mentions that its system considers "future data" such as macroweather weather patterns, economic trends, and local demographics to anticipate demand and potential supply chain disruptions.
Tesco also uses public weather data in its predictive models. This allows you to anticipate buying patterns, such as that for every 10°C increase in temperature, barbecue sales increase by up to 300%. In addition, Tesco receives local weather forecasts up to three times a day, connecting them with data on 18 million products and the type of customers in each store. This information is shared with your suppliers to adjust shipments and improve logistics efficiency.
- Using demographic data to decide the location of premises
For years, Starbucks has turned to predictive analytics to plan its expansion. The company uses geospatial intelligence platforms, developed with GIS technology, to combine multiple sources of information – including open demographic and socioeconomic data such as population density, income level, mobility patterns, public transport or the type of nearby businesses – along with its own sales history. Thanks to this integration, you can predict which locations have the greatest potential for success, avoiding competition between stores and ensuring that each new store is located in the most suitable environment.
Domino's Pizza also used similar models to analyse whether opening a new location in one London neighbourhood would be successful and how it would affect other nearby locations, considering buying patterns and local demographics.
This approach makes it possible to predict customer flows and maximize profitability through more informed location decisions.
- Socioeconomic data for pricing based on demographics
An interesting example can be found in SDG Group, an international consulting firm specialising in advanced analytics for retail. The company has developed solutions that allow prices and promotions to be adjusted taking into account the demographic and socioeconomic characteristics of each area – such as the consumer base, location or the size of the point of sale. Thanks to these models, it is possible to estimate the elasticity of demand and design dynamic pricing strategies adapted to the real context of each area, optimizing both profitability and the shopping experience.
The future of predictive commerce
The rise of predictive commerce has been fueled by the advancement of artificial intelligence and the availability of data, both open and private. From choosing the ideal place to open a store to efficiently managing inventory, public data combined with advanced analytics allows you to anticipate consumer behaviors and needs with increasing accuracy.
However, there are still important challenges to be faced: the heterogeneity of data sources, which in many cases lack common standards; the need for robust technologies and infrastructures that allow open information to be integrated with companies' internal systems; and, finally, the challenge of ensuring ethical and transparent use, which respects people's privacy and avoids the generation of bias in models.
Overcoming these challenges will be key for predictive commerce to unfold its full potential and become a strategic tool for companies of all sizes. On this path, open data will play a fundamental role as a driver of innovation, transparency and competitiveness in the trade of the future..
Blog
Artificial intelligence (AI) assistants are already part of our daily lives: we ask them the time, how to get to a certain place or we ask them to play our favorite song. And although AI, in the future, may offer us infinite functionalities, we must not forget that linguistic diversity is still a pending issue.
In Spain, where Spanish coexists with co-official languages such as Basque, Catalan, Valencian and Galician, this issue is especially relevant. The survival and vitality of these languages in the digital age depends, to a large extent, on their ability to adapt and be present in emerging technologies. Currently, most virtual assistants, automatic translators or voice recognition systems do not understand all the co-official languages. However, did you know that there are collaborative projects to ensure linguistic diversity?
In this post we tell you about the approach and the greatest advances of some initiatives that are building the digital foundations necessary for the co-official languages in Spain to also thrive in the era of artificial intelligence.
ILENIA, the coordinator of multilingual resource initiatives in Spain
The models that we are going to see in this post share a focus because they are part of ILENIA, a state-level coordinator that connects the individual efforts of the autonomous communities. This initiative brings together the projects BSC-CNS (AINA), CENID (VIVES), HiTZ (NEL-GAITU) and the University of Santiago de Compostela (NÓS), with the aim of generating digital resources that allow the development of multilingual applications in the different languages of Spain.
The success of these initiatives depends fundamentally on citizen participation. Through platforms such as Mozilla's Common Voice, any speaker can contribute to the construction of these linguistic resources through different forms of collaboration:
- Spoken Read: Collecting different ways of speaking through voice donations of a specific text.
- Spontaneous speech: creates real and organic datasets as a result of conversations with prompts.
- Text in language: collaborate in the transcription of audios or in the contribution of textual content, suggesting new phrases or questions to enrich the corpora.
All resources are published under free licenses such as CC0, allowing them to be used free of charge by researchers, developers and companies.
The challenge of linguistic diversity in the digital age
Artificial intelligence systems learn from the data they receive during their training. To develop technologies that work correctly in a specific language, it is essential to have large volumes of data: audio recordings, text corpora and examples of real use of the language.
In other publications of datos.gob.es we have addressed the functioning of foundational models and initiatives in Spanish such as ALIA, trained with large corpus of text such as those of the Royal Spanish Academy.
Both posts explain why language data collection is not a cheap or easy task. Technology companies have invested massively in compiling these resources for languages with large numbers of speakers, but Spanish co-official languages face a structural disadvantage. This has led to many models not working properly or not being available in Valencian, Catalan, Basque or Galician.
However, there are collaborative and open data initiatives that allow the creation of quality language resources. These are the projects that several autonomous communities have launched, marking the way towards a multilingual digital future.
On the one hand, the Nós en Galicia Project creates oral and conversational resources in Galician with all the accents and dialectal variants to facilitate integration through tools such as GPS, voice assistants or ChatGPT. A similar purpose is that of Aina in Catalonia, which also offers an academic platform and a laboratory for developers or Vives in the Valencian Community. In the Basque Country there is also the Euskorpus project , which aims to constitute a quality text corpus in Basque. Let's look at each of them.
Proyecto Nós, a collaborative approach to digital Galician
The project has already developed three operational tools: a multilingual neural translator, a speech recognition system that converts speech into text, and a speech synthesis application. These resources are published under open licenses, guaranteeing their free and open access for researchers, developers and companies. These are its main features:
- Promoted by: the Xunta de Galicia and the University of Santiago de Compostela.
- Main objective: to create oral and conversational resources in Galician that capture the dialectal and accent diversity of the language.
- How to participate: The project accepts voluntary contributions both by reading texts and by answering spontaneous questions.
- Donate your voice in Galician: https://doagalego.nos.gal
Aina, towards an AI that understands and speaks Catalan
With a similar approach to the Nós project, Aina seeks to facilitate the integration of Catalan into artificial intelligence language models.
It is structured in two complementary aspects that maximize its impact:
- Aina Tech focuses on facilitating technology transfer to the business sector, providing the necessary tools to automatically translate websites, services and online businesses into Catalan.
- Aina Lab promotes the creation of a community of developers through initiatives such as Aina Challenge, promoting collaborative innovation in Catalan language technologies. Through this call , 22 proposals have already been selected with a total amount of 1 million to execute their projects.
The characteristics of the project are:
- Powered by: the Generalitat de Catalunya in collaboration with the Barcelona Supercomputing Center (BSC-CNS).
- Main objective: it goes beyond the creation of tools, it seeks to build an open, transparent and responsible AI infrastructure with Catalan.
- How to participate: You can add comments, improvements, and suggestions through the contact inbox: https://form.typeform.com/to/KcjhThot?typeform-source=langtech-bsc.gitbook.io.
Vives, the collaborative project for AI in Valencian
On the other hand, Vives collects voices speaking in Valencian to serve as training for AI models.
- Promoted by: the Alicante Digital Intelligence Centre (CENID).
- Objective: It seeks to create massive corpora of text and voice, encourage citizen participation in data collection, and develop specialized linguistic models in sectors such as tourism and audiovisual, guaranteeing data privacy.
- How to participate: You can donate your voice through this link: https://vives.gplsi.es/instruccions/.
Gaitu: strategic investment in the digitalisation of the Basque language
In Basque, we can highlight Gaitu, which seeks to collect voices speaking in Basque in order to train AI models. Its characteristics are:
- Promoted by: HiTZ, the Basque language technology centre.
- Objective: to develop a corpus in Basque to train AI models.
- How to participate: You can donate your voice in Basque here https://commonvoice.mozilla.org/eu/speak.
Benefits of Building and Preserving Multilingual Language Models
The digitization projects of the co-official languages transcend the purely technological field to become tools for digital equity and cultural preservation. Its impact is manifested in multiple dimensions:
- For citizens: these resources ensure that speakers of all ages and levels of digital competence can interact with technology in their mother tongue, removing barriers that could exclude certain groups from the digital ecosystem.
- For the business sector: the availability of open language resources makes it easier for companies and developers to create products and services in these languages without assuming the high costs traditionally associated with the development of language technologies.
- For the research fabric, these corpora constitute a fundamental basis for the advancement of research in natural language processing and speech technologies, especially relevant for languages with less presence in international digital resources.
The success of these initiatives shows that it is possible to build a digital future where linguistic diversity is not an obstacle but a strength, and where technological innovation is put at the service of the preservation and promotion of linguistic cultural heritage.
Documentación
In the field of data science, the ability to build robust predictive models is fundamental. However, a model is not just a set of algorithms; it is a tool that must be understood, validated, and ultimately useful for decision-making.
Thanks to the transparency and accessibility of open data, we have the unique opportunity to work in this exercise with real, updated, and institutional-quality information that reflects environmental issues. This democratization of access not only allows for the development of rigorous analyses with official data but also contributes to informed public debate on environmental policies, creating a direct bridge between scientific research and societal needs.
In this practical exercise, we will dive into the complete lifecycle of a modeling project, using a real case study: the analysis of air quality in Castile and León. Unlike approaches that focus solely on the implementation of algorithms, our methodology focuses on:
- Loading and initial data exploration: identifying patterns, anomalies, and underlying relationships that will guide our modeling.
- Exploratory analysis for modeling: building visualizations and performing feature engineering to optimize the model.
- Development and evaluation of regression models: building and comparing multiple iterative models to understand how complexity affects performance.
- Model application and conclusions: using the final model to simulate scenarios and quantify the impact of potential environmental policies.
Access the data laboratory repository on Github.
Run the data pre-processing code on Google Colab.
Analysis Architecture
The core of this exercise follows a structured flow in four key phases, as illustrated in Figure 1. Each phase builds on the previous one, from initial data exploration to the final application of the model.

Figure 1. Phases of the predictive modeling project.
Development Process
1. Loading and Initial Data Exploration
The first step is to understand the raw material of our analysis: the data. Using an air quality dataset from Castile and León, spanning 24 years of measurements, we face common real-world challenges:
- Missing Values: variables such as CO and PM2.5 have limited data coverage.
- Anomalous Data: negative and extreme values are detected, likely due to sensor errors.
Through a process of cleaning and transformation, we convert the raw data into a clean and structured dataset, ready for modeling.
2. Exploratory Analysis for Modeling
Once the data is clean, we look for patterns. Visual analysis reveals a strong seasonality in NO₂ levels, with peaks in winter and troughs in summer. This observation is crucial and leads us to create new variables (feature engineering), such as cyclical components for the months, which allow the model to "understand" the circular nature of the seasons.

Figure 2. Seasonal variation of NO₂ levels in Castile and León.
3. Development and Evaluation of Regression Models
With a solid understanding of the data, we proceed to build three linear regression models of increasing complexity:
- Base Model: uses only pollutants as predictors.
- Seasonal Model: adds time variables.
- Complete Model: includes interactions and geographical effects.
Comparing these models allows us to quantify the improvement in predictive capability. The Seasonal Model emerges as the optimal choice, explaining almost 63% of the variability in NO₂, a remarkable result for environmental data.
4. Model Application and Conclusions
Finally, we subject the model to a rigorous diagnosis and use it to simulate the impact of environmental policies. For example, our analysis estimates that a 20% reduction in NO emissions could translate into a 4.8% decrease in NO₂ levels.

Figure 3. Performance of the seasonal model. The predicted values align well with the actual values.
What can you learn?
This practical exercise allows you to learn:
- Data project lifecycle: from cleaning to application.
- Linear regression techniques: construction, interpretation, and diagnosis.
- Handling time-series data: capturing seasonality and trends.
- Model validation: techniques like cross-validation and temporal validation.
- Communicating results: how to translate findings into actionable insights.
Conclusions and Future
This exercise demonstrates the power of a structured and rigorous approach in data science. We have transformed a complex dataset into a predictive model that is not only accurate but also interpretable and useful.
For those interested in taking this analysis to the next level, the possibilities are numerous:
- Incorporation of meteorological data: variables such as temperature and wind could significantly improve accuracy.
- More advanced models: exploring techniques such as Generalized Additive Models (GAM) or other machine learning algorithms.
- Spatial analysis: investigating how pollution patterns vary between different locations.
In summary, this exercise not only illustrates the application of regression techniques but also underscores the importance of an integrated approach that combines statistical rigor with practical relevance.
Blog
How many times have you had a dataset in your hands that you needed to analyze, but you've run into errors, inconsistencies, or formatting issues that have caused you to lose hours of work? The reality is that, although we have more data available every day, we do not always have the necessary tools or knowledge to work with it efficiently.
There are several options to address this process. One of them is Open Data Editor, a free and open-source tool that the Open Knowledge Foundation (OKFN) has designed with the aim of democratizing access to and exploitation of data.
Key features and functionalities
As indicated by OKFN, this application is designed for people who work with tabular data (Excel, Google Sheets, CSV) and who do not know how to program or do not have access to specialized technical tools. Its no-code approach makes it an accessible alternative that focuses specifically on tabular data cleansing and validation.
The tool implements a process known as "data validation," which involves finding errors in datasets and correcting them efficiently. Also, verify that spreadsheets or datasets contain all the information necessary for others to use. Therefore, it also takes into account interoperability, a very relevant value when it comes to dataset reuse.
Beyond guaranteeing reuse, Open Data Editor also ensures privacy and security thanks to its local architecture, i.e. the data remains on the user's device.
Pilot projects: global impact and tangible results
Although it is a very intuitive tool, the organization makes available to the user a free online course to learn how to get the most out of it. The course is currently in English, but Spanish translation will be available soon.
In addition to the main course, the Open Knowledge Foundation has implemented a "train the trainer" program that trains people to teach the course locally in different regions of the world. Within the framework of this training programme, pilot projects are being implemented in different sectors and communities. These pilot projects have focused especially on encouraging access to basic training in quality data analysis tools, something that OKFN believes should not be limited by economic or technological barriers.
The documented use cases show diverse applications ranging from human rights organizations to local government institutions, all leveraging the data validation and cleansing capabilities offered by the tool. The educational approach of Open Data Editor goes beyond the simple use of the tool: it is about training in open data and promoting open and accessible knowledge.
Next steps: Integrating artificial intelligence
The results of this first phase have been so promising that the Open Knowledge Foundation has decided to move towards a second stage, this time incorporating artificial intelligence technologies to further expand the capabilities of the tool. The new version, which offers validation-focused AI support and trust-building features, has just been announced and released.
The philosophy behind this AI integration is to maintain the educational character of the tool. Rather than creating a "black box" that simply provides results, the new functionality will explain every step that artificial intelligence takes, allowing users to understand not only what is being done with their data, but also why certain decisions are being made.
This transparent approach to AI is especially important in the context of open and government data, as we explain in this episode of the datos.gob.es podcast. Open Data Editor users will be able to see how AI identifies potential problems, suggests corrections, and validates data quality, becoming a learning tool as well as a practical utility.
Impact on the open data ecosystem
This new functionality will add to the purpose of offering a sustainable and open tool. It is precisely this commitment to open source that makes Open Data Editor adaptable and improved by the global developer community. To do this, they use the Frictionless Framework as a technological basis, which ensures that the standards used are open and widely adopted in the open data ecosystem.
There is no doubt that the tool is especially aligned with government open data principles, providing public administrations with a way to improve the quality of their data publications without requiring significant investments in technical infrastructure or specialized training. For data journalists and civil society organizations, Open Data Editor offers the ability to work with complex datasets more efficiently, allowing them to focus on analysis and interpretation rather than technical data cleansing.
In short, more than a technical tool, Open Data Editor symbolizes a paradigmatic shift towards the democratization of data analysis. Because its impact extends beyond its immediate functionalities, contributing to a broader ecosystem of open and accessible data.
Blog
In an increasingly complex world, public decisions need more than intuition: they require scientific evidence. This is where I+P (Innovation + Public Policy) initiatives come into play: an intersection between creativity, data-driven knowledge, and policy action.
In this article we will explain this concept, including examples and information about funding programs.
What is I+P?
I+P is not a mathematical formula, but a strategic practice that combines scientific knowledge, research, and citizen participation to improve the formulation, implementation, and evaluation of public policies. It is not only a matter of applying technology to the public sphere, but of rethinking how decisions are made, how solutions are formulated and how society is involved in these processes through the application of scientific methodologies.
This idea stems from the concept of "science for public policy", also known as "science for policy" or "Science for Policy" (S4P) and implies active collaboration between public administrations and the scientific community.
I+P initiatives promote empirical evidence and experimentation. To this end, they promote the use of data, emerging technologies, pilot tests, agile methodologies and feedback loops that help design more efficient and effective policies, focused on the real needs of citizens. This facilitates real-time decision-making and the possibility of making agile adjustments in situations that require quick responses. In short, it is about providing more creative and accurate responses to today's challenges, such as climate change or digital inequality, areas where traditional policies can fall short.
The following visual summarizes these and other benefits.
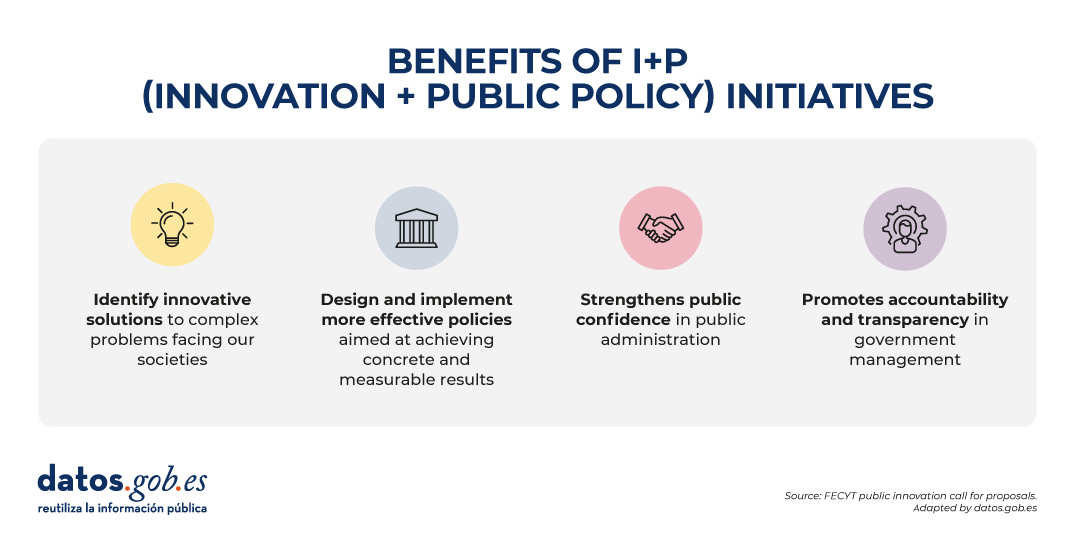
Source: FECYT Call for Public Innovation - adapted by datos.gob.es.
Examples of R+P initiatives
The use of data for political decision-making was evident during the COVID-19 pandemic, where policymakers were adapting the measures to be taken based on reports from institutions such as the World Health Organization (WHO). But beyond these types of extraordinary events, today we find consolidated initiatives that increasingly seek to promote innovation and decision-making based on scientific data in the public sphere on an ongoing basis. Let's look at two examples.
-
Periodic reports from scientific institutions to bring scientific knowledge closer to public decision-making
Scientific reports on topics such as climate change, bacterial resistance or food production are examples of how science can guide informed policy decisions.
The Science4Policy initiative of the Spanish National Research Council (CSIC) is an example of this. It is a collection of thematic reports that present solid evidence, generated in its research centers, on relevant social problems. Each report includes:
- An introduction to the problem and its social impact.
- Information on the research carried out by the CSIC on the subject.
- Conclusions and recommendations for public policies.
Its main objective is to transform scientific knowledge into accessible contributions for non-specialized audiences, thus facilitating informed decisions by public authorities.
-
Public innovation laboratories, a space for science-based creativity
Public innovation labs or GovLabs are experimental spaces that allow public employees, scientists, experts in various fields and citizens to co-create policies, prototype solutions and learn iteratively.
An example is the Public Innovation Laboratory (LIP) promoted by the National Institute of Public Administration (INAP), where pilots have been carried out on the use of technologies to promote the new generation of jobs, intermunicipal collaboration to share talent or the decentralization of selective tests. In addition, they have an Innovation Resources Catalogue where tools with open licences launched by various organisations are compiled and can be used to support public entrepreneurs.
It is also worth highlighting the Spanish Network for Public Innovation and Scientific Transfer, promoted by the NovaGob Foundation. It is a collaborative space that brings together professionals, public administrations, universities and third sector organisations with the aim of transforming public management in Spain. Through working groups and repositories of good practices, it promotes the use of artificial intelligence, administrative simplification and the improvement of citizen service.
We also find public innovation laboratories at the regional level, such as Govtechlab Madrid, a project led by the madri+d Foundation for Knowledge that connects startups and digital SMEs with public institutions to solve real challenges. During the 2023/2024 academic year, they launched 9 pilots, for example, to collect and analyse the opinion of citizens to make better decisions in the Alcobendas City Council, unify the collection and management of data in the registrations of the activities of the Youth Area of the Boadilla del Monte City Council or provide truthful and updated information digitally on the commercial fabric of Mostoles.
The role of governments and public institutions
Innovation in public policy can be driven by a diversity of actors: public administrations open to change, universities and research centres, civic startups and technology companies, civil society organisations or committed citizens.
The European Commission, for example, plays a key role in strengthening the science-for-policy ecosystem in Europe, promoting the effective use of scientific knowledge in decision-making at all levels: European, national, regional and local. Through programmes such as Horizon Europe and the European Research Area Policy Agenda 2025-2027, actions are promoted to develop capacities, share good practices and align research with societal needs.
In Spain we also find actions such as the recent call for funding from the Spanish Foundation for Science and Technology (FECYT), the Ministry of Science, Innovation and Universities, and the National Office of Scientific Advice, whose objective is to promote:
- Research projects that generate new scientific evidence applicable to the design of public policies (Category A).
- Scientific advice and knowledge transfer activities between researchers and public officials (Category B).
Projects can receive up to €100,000 (Category A) or €25,000 (Category B), covering up to 90% of the total cost. Research organizations, universities, health entities, technology centers, R+D centers and other actors that promote the transfer of R+D can participate. The deadline to apply for the aid ends on September 17, 2025. For more information, you should visit the rules of the call or attend some training sessions that are being held.
Conclusion
In a world where social, economic and environmental challenges are increasingly complex, we need new ways of thinking and acting from public institutions. For this reason, R+P is not a fad, it is a necessity that allows us to move from "we think it works" to "we know it works", promoting a more adaptive, agile and effective policy.
Evento
Once again, the Junta de Castilla y León has launched its open data contest to reward the innovative use of public information.
In this post, we summarize the details to participate in the IX edition of this event, which is an opportunity for both professionals and students, creative people or multidisciplinary teams who wish to give visibility to their talent through the reuse of public data.
What does the competition consist of?
The aim of the competition is to recognize projects that use open datasets from the Junta de Castilla y León. These datasets can be combined, if the participants wish, with other public or private sources, at any level of administration.
Projects can be submitted in four categories:
- Ideas category: aimed at people or teams who want to submit a proposal to create a service, studio, application, website or any other type of development. The project does not need to be completed; the important thing is that the idea is original, viable and has a potential positive impact.
- Products and services category: designed for projects already developed and accessible to citizens, such as online services, mobile applications or websites. All developments must be available via a public URL. This category includes a specific award for students enrolled in official education during the 2024/2025 or 2025/2026 school years.
- Didactic resource category: aimed at educational projects that use open data as a support tool in the classroom. The aim is to promote innovative teaching through Creative Commons licensed resources, which can be shared and reused by teachers and students.
- Data journalism category: it will reward journalistic works published or updated in a relevant way, in written or audiovisual format, that make use of open data to inform, contextualize or analyze topics of interest to citizens. The journalistic pieces must have been published in a printed or digital media since September 24, 2024, the day following the end date of the deadline for submission of candidacies of the immediately preceding call for awards.
In all categories, it is essential that at least one dataset from the open data portal of the Junta de Castilla y León is used. This platform has hundreds of datasets on different sectors such as the environment, economy, society, public administration, culture, education, etc. that can be used as a basis to develop useful, informative and transformative ideas.
Who can participate?
The competition is open to any natural or legal person, who can be presented individually or in a group. In addition, you can submit more than one application even for different categories. Although the same project may not receive more than one award, this flexibility allows the same idea to be explored from different approaches: educational, journalistic, technical or conceptual.
What prizes are awarded?
The 2025 edition of the contest includes prizes with a financial endowment, accrediting diploma and institutional dissemination through the open data portal and other communication channels of the Board.
The distribution and amount of the prizes by category is:
- Ideas category
- First prize: €1,500
- Second prize: €500
- Category products & services
- First prize: €2,500
- Second prize: €1,500
- Third prize: €500
- Special Student Prize: €1,500
- Category teaching resource
- First prize: €1,500
- Data journalism category
- First prize: €1,500
- Second prize: €1,000
Under what criteria are the prizes awarded? The jury will assess the candidatures considering different evaluation criteria, as set out in the rules and the order of call, including their originality, social utility, technical quality, feasibility, impact, economic value and degree of innovation.
How to participate?
As in other editions, candidacies can be submitted in two ways:
- In person, at the General Registry of the Ministry of the Presidency, at the registry assistance offices of the Junta de Castilla y León or at the places established in article 16.4 of Law 39/2015.
- Electronics, through the electronic headquarters of the Junta de Castilla y León
Each application must include:
- Identification data of the author(s).
- Title of the project.
- Category or categories to which it is submitted.
- An explanatory report of the project, with a maximum length of 1,000 words, providing all the information that can be assessed by the jury according to the established scale.
- In the case of submitting an application to the Products and Services category, the URL to access the project will be specified
The deadline to submit proposals is September 22, 2025
With this contest, the Junta de Castilla y León reaffirms its commitment to the open data policy and the culture of reuse. The competition not only recognizes the creativity, innovation and usefulness of the projects presented, but also contributes to disseminating the transformative potential of open data in areas such as education, journalism, technology or social entrepreneurship.
In previous editions, solutions to improve mobility, interactive maps on forest fires, tools for the analysis of public expenditure or educational resources on the rural environment, among many other examples, have been awarded. You can read more about last year's winning proposals and others on our website. In addition, all these projects can be consulted in the history of winners available on the community's open data portal.
We encourage you to participate in the contest and get the most out of open data in Castilla y León!