Documentación
IA agents (such as Google ADK, Langchain and so) are so-called "brains". But these brains without "hands" cannot operate on the real world performing API requests or database queries. These "hands" are the tools.
The challenge is the following: how do you connect brain with hands in an standard, decoupled and scalable fashion? The answers is the Model Context Protocol (MCP).
As a practical exercise, we built a conversational agent system that explores the Open Data national repository hosted at datos.gob.es through natural language questions, smoothing in this way the access to open data.
In this practical exercise, the main objective is to illustrate, step by step, how to build an independent tools server that interacts with the MCP protocol.
To make this exercise tangible and not just theoretical, we will use FastMCP to build the server. To prove that our server works, we will create a simple agent with Google ADK that uses it. The use case (querying the datos.gob.es API) illustrates this connection between tools and agents. The real learning lies in the architecture, which you could reuse for any API or database.
Below are the technologies we will use and a diagram showing how the different components are related to each other.
-
FastMCP (mcp.server.fastmcp): a lightweight implementation of the MCP protocol that allows you to create tool servers with very little code using Python decorators. It is the “main character” of the exercise.
-
Google ADK (Agent Development Kit): a framework to define the AI agent, its prompt, and connect it to the tools. It is the “client” that tests our server.
-
FastAPI: used to serve the agent as a REST API with an interactive web interface.
-
httpx: used to make asynchronous calls to the external datos.gob.es API.
-
Docker and Docker Compose: used to package and orchestrate the two microservices, allowing them to run and communicate in isolation.
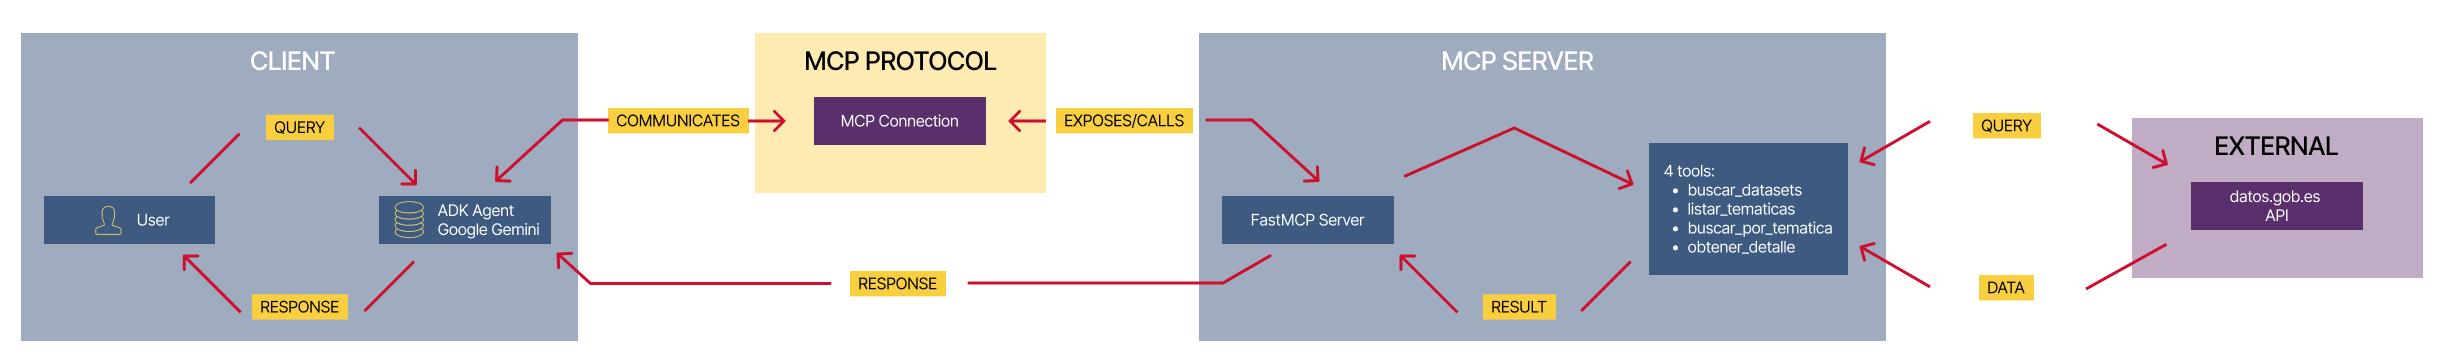
Figure 1. Decoupled architecture with MCP comunication.
Figure 1 illustrates a decoupled architecture divided into four main components that communicate via the MCP protocol. When the user makes a natural language query, the ADK Agent (based on Google Gemini) processes the intent and communicates with the MCP server through the MCP Protocol, which acts as a standardized intermediary. The MCP server exposes four specialized tools (search datasets, list topics, search by topic, and get details) that encapsulate all the business logic for interacting with the external datos.gob.es API. Once the tools execute the required queries and receive the data from the national catalog, the result is propagated back to the agent, which finally generates a user-friendly response, thus completing the communication cycle between the “brain” (agent) and the “hands” (tools).
Access the data lab repository on GitHub.
Run the data pre-processing code on Google Colab.
The architecture: MCP server and consumer agent
The key to this exercise is understanding the client–server relationship:
- The Server (Backend): it is the protagonist of this exercise. Its only job is to define the business logic (the “tools”) and expose them to the outside world using the standard MCP “contract.” It is responsible for encapsulating all the logic for communicating with the datos.gob.es API.
- The Agent (Frontend): it is the “client” or “consumer” of our server. Its role in this exercise is to prove that our MCP server works. We use it to connect, discover the tools that the server offers, and call them.
- The MCP Protocol: it is the “language” or “contract” that allows the agent and the server to understand each other without needing to know the internal details of the other.
Development process
The core of the exercise is divided into three parts: creating the server, creating a client to test it, and running them.
1. The tool server (the backend with MCP)
This is where the business logic lives and the main focus of this tutorial. In the main file (server.py), we define simple Python functions and use the FastMCP @mcp.tool decorator to expose them as consumable “tools.”
The description we add to the decorator is crucial, since it is the documentation that any MCP client (including our ADK agent) will read to know when and how to use each tool.
The tools we will define in this exercise are:
- buscar_datasets(titulo: str): to search for datasets by keywords in the title.
- listar_tematicas(): to discover which data categories exist.
- buscar_por_tematica(tematica_id: str): to find datasets for a specific topic.
- obtener_detalle_dataset(dataset_id: str): to retrieve the complete information for a dataset.
2. The consumer agent (the frontend with Google ADK)
Once our MCP server is built, we need a way to test it. This is where Google ADK comes in. We use it to create a simple “consumer agent.”
The magic of the connection happens in the tools argument. Instead of defining the tools locally, we simply pass it the URL of our MCP server. When the agent starts, it will query that URL, read the MCP “contract,” and automatically know which tools are available and how to use them.
# Ejemplo de configuración en agent.py
root_agent = LlmAgent(
   ...
   instruction="Eres un asistente especializado en datos.gob.es...",
   tools=[
       MCPToolset(
           connection_params=StreamableHTTPConnectionParams(
               url="http://mcp-server:8000/mcp",
           ),
       )
   ]
)
3. Orchestration with Docker Compose
Finally, to run our MCP Server and the consumer agent together, we use docker-compose.yml. Docker Compose takes care of building the images for each service, creating a private network so they can communicate (which is why the agent can call http://mcp-server:8000), and exposing the necessary ports.
Testing the MCP server in action
Once we run docker-compose up --build, we can access the agent’s web interface at http://localhost:8080.
The goal of this test is not only to see whether the bot responds correctly, but to verify that our MCP server works properly and that the ADK agent (our test client) can discover and use the tools it exposes.
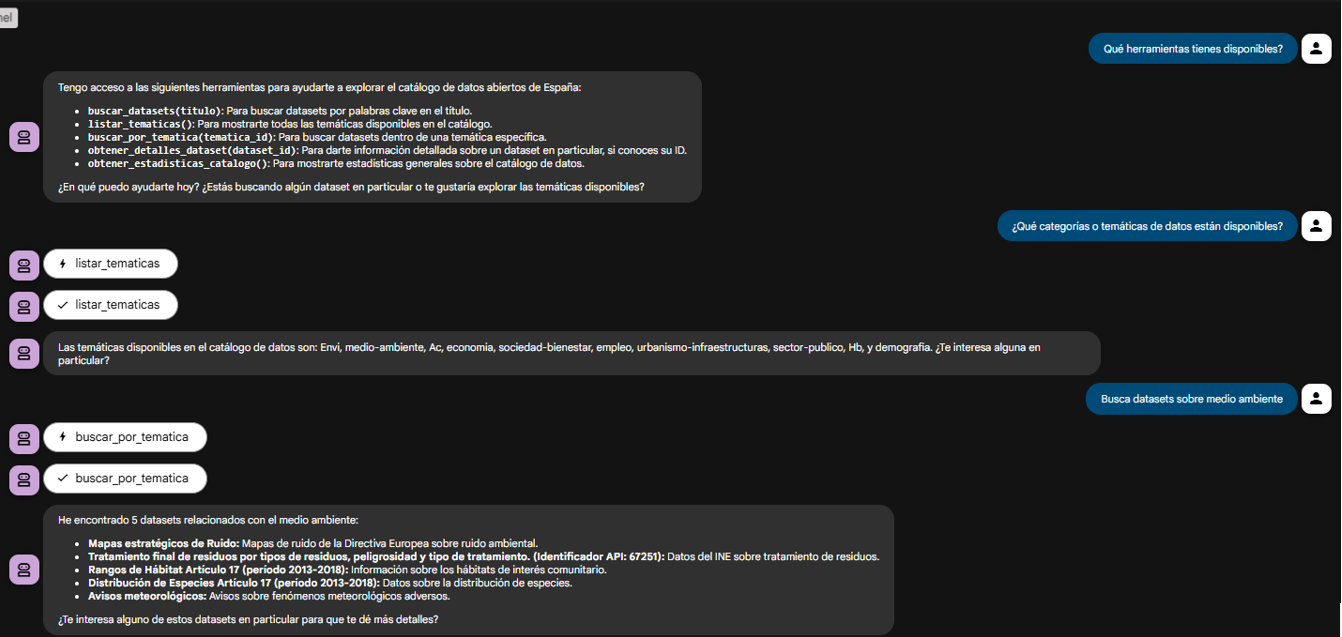
Figure 2. Screenshot of the agent showing its tools.
The true power of decoupling becomes evident when the agent logically chains together the tools provided by our server.
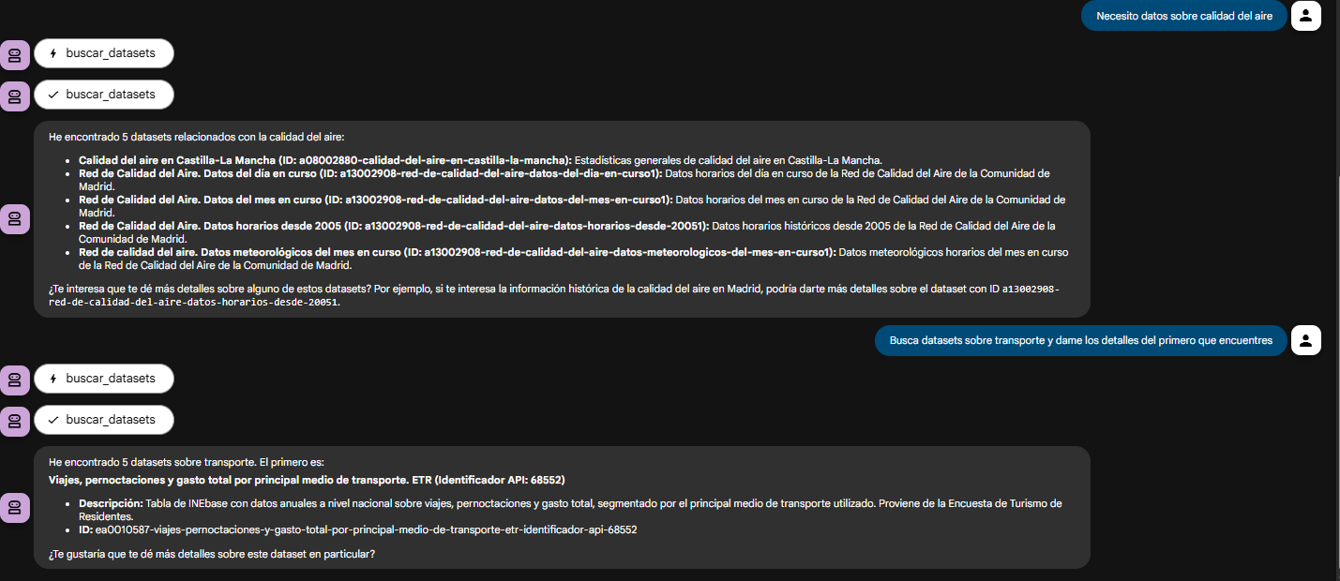
Figure 3. Screenshot of the agent showing the joint use of tools.
What can we learn?
The goal of this exercise is to learn the fundamentals of a modern agent architecture, focusing on the tool server. Specifically:
- How to build an MCP server: how to create a tool server from scratch that speaks MCP, using decorators such as
@mcp.tool. - The decoupled architecture pattern: the fundamental pattern of separating the “brain” (LLM) from the “tools” (business logic).
- Dynamic tool discovery: how an agent (in this case, an ADK agent) can dynamically connect to an MCP server to discover and use tools.
- External API integration: the process of “wrapping” a complex API (such as datos.gob.es) in simple functions within a tool server.
- Orchestration with Docker: how to manage a microservices project for development.
Conclusions and future work
We have built a robust and functional MCP tool server. The real value of this exercise lies in the how: a scalable architecture centered around a tool server that speaks a standard protocol.
This MCP-based architecture is incredibly flexible. The datos.gob.es use case is just one example. We could easily:
- Change the use case: replace
server.pywith one that connects to an internal database or the Spotify API, and any agent that speaks MCP (not just ADK) could use it. - Change the “brain”: swap the ADK agent for a LangChain agent or any other MCP client, and our tool server would continue to work unchanged.
For those interested in taking this work to the next level, the possibilities focus on improving the MCP server:
- Implement more tools: add filters by format, publisher, or date to the MCP server.
- Integrate caching: use Redis in the MCP server to cache API responses and improve speed.
- Add persistence: store chat history in a database (this would be on the agent side).
Beyond these technical improvements, this architecture opens the door to many applications across very different contexts.
- Journalists and academics can have research assistants that help them discover relevant datasets in seconds.
- Transparency organizations can build monitoring tools that automatically detect new publications of public procurement or budget data.
- Consulting firms and business intelligence teams can develop systems that cross-reference information from multiple government sources to produce sector reports.
- Even in education, this architecture serves as a didactic foundation for teaching advanced concepts such as asynchronous programming, API integration, and AI agent design.
The pattern we have built—a decoupled tool server that speaks a standard protocol—is the foundation on which you can develop solutions tailored to your specific needs, regardless of the domain or data source you are working with.
Evento
The Cabildo Insular de Tenerife has announced the II Open Data Contest: Development of APPs, an initiative that rewards the creation of web and mobile applications that take advantage of the datasets available on its datos.tenerife.es portal. This call represents a new opportunity for developers, entrepreneurs and innovative entities that want to transform public information into digital solutions of value for society. In this post, we tell you the details about the competition.
A growing ecosystem: from ideas to applications
This initiative is part of the Cabildo de Tenerife's Open Data project, which promotes transparency, citizen participation and the generation of economic and social value through the reuse of public information.
The Cabildo has designed a strategy in two phases:
-
The I Open Data Contest: Reuse Ideas (already held) focused on identifying creative proposals.
-
The II Contest: Development of PPPs (current call) that gives continuity to the process and seeks to materialize ideas in functional applications.
This progressive approach makes it possible to build an innovation ecosystem that accompanies participants from conceptualization to the complete development of digital solutions.
The objective is to promote the creation of digital products and services that generate social and economic impact, while identifying new opportunities for innovation and entrepreneurship in the field of open data.
Awards and financial endowment
This contest has a total endowment of 6,000 euros distributed in three prizes:
-
First prize: 3,000 euros
-
Second prize: 2,000 euros
-
Third prize: 1,000 euros
Who can participate?
The call is open to:
-
Natural persons: individual developers, designers, students, or anyone interested in the reuse of open data.
-
Legal entities: startups, technology companies, cooperatives, associations or other entities.
As long as they present the development of an application based on open data from the Cabildo de Tenerife. The same person, natural or legal, can submit as many applications as they wish, both individually and jointly.
What kind of applications can be submitted?
Proposals must be web or mobile applications that use at least one dataset from the datos.tenerife.es portal. Some ideas that can serve as inspiration are:
-
Applications to optimize transport and mobility on the island.
-
Tools for visualising tourism or environmental data.
-
Real-time citizen information services.
-
Solutions to improve accessibility and social participation.
-
Economic or demographic data analysis platforms.
Evaluation criteria: what does the jury assess?
The jury will evaluate the proposals considering the following criteria:
-
Use of open data: degree of exploitation and integration of the datasets available in the portal.
-
Impact and usefulness: value that the application brings to society, ability to solve real problems or improve existing services.
-
Innovation and creativity: originality of the proposal and innovative nature of the proposed solution.
-
Technical quality: code robustness, good programming practices, scalability and maintainability of the application.
-
Design and usability: user experience (UX), attractive and intuitive visual design, guarantee of digital accessibility on Android and iOS devices.
How to participate: deadlines and form of submission:
Applications can be submitted until March 10, 2026, three months from the publication of the call in the Official Gazette of the Province.
Regarding the required documentation, proposals must be submitted in digital format and include:
-
Detailed technical description of the application.
-
Report justifying the use of open data.
-
Specification of technological environments used.
-
Video demonstration of how the application works.
-
Complete source code.
-
Technical summary sheet.
The organising institution recommends electronic submission through the Electronic Office of the Cabildo de Tenerife, although it is also possible to submit it in person at the official registers enabled. The complete bases and the official application form are available at the Cabildo's Electronic Office.
With this second call, the Cabildo de Tenerife consolidates its commitment to transparency, the reuse of public information and the creation of a digital innovation ecosystem. Initiatives like this demonstrate how open data can become a catalyst for entrepreneurship, citizen participation, and local economic development.
Noticia
In the last six months, the open data ecosystem in Spain has experienced intense activity marked by regulatory and strategic advances, the implementation of new platforms and functionalities in data portals, or the launch of innovative solutions based on public information.
In this article, we review some of those advances, so you can stay up to date. We also invite you to review the article on the news of the first half of 2025 so that you can have an overview of what has happened this year in the national data ecosystem.
Cross-cutting strategic, regulatory and policy developments
Data quality, interoperability and governance have been placed at the heart of both the national and European agenda, with initiatives seeking to foster a robust framework for harnessing the value of data as a strategic asset.
One of the main developments has been the launch of a new digital package by the European Commission in order to consolidate a robust, secure and competitive European data ecosystem. This package includes a digital bus to simplify the application of the Artificial Intelligence (AI) Regulation. In addition, it is complemented by the new Data Union Strategy, which is structured around three pillars:
- Expand access to quality data to drive artificial intelligence and innovation.
- Simplify the existing regulatory framework to reduce barriers and bureaucracy.
- Protect European digital sovereignty from external dependencies.
Its implementation will take place gradually over the next few months. It will be then that we will be able to appreciate its effects on our country and the rest of the EU territories.
Activity in Spain has also been - and will be - marked by the V Open Government Plan 2025-2029, approved last October. This plan has more than 200 initiatives and contributions from both civil society and administrations, many of them related to the opening and reuse of data. Spain's commitment to open data has also been evident in its adherence to the International Open Data Charter, a global initiative that promotes the openness and reuse of public data as tools to improve transparency, citizen participation, innovation and accountability.
Along with the promotion of data openness, work has also been done on the development of data sharing spaces. In this regard, the UNE 0087 standard was presented, which is in addition to UNE specifications on data and defines for the first time in Spain the key principles and requirements for creating and operating in data spaces, improving their interoperability and governance.
More innovative data-driven solutions
Spanish bodies continue to harness the potential of data as a driver of solutions and policies that optimise the provision of services to citizens. Some examples are:
- The Ministry of Health and citizen science initiative, Mosquito Alert, are using artificial intelligence and automated image analysis to improve real-time detection and tracking of tiger mosquitoes and invasive species.
- The Valenciaport Foundation, together with other European organisations, has launched a free tool that allows the benefits of installing wind and photovoltaic energy systems in ports to be assessed.
- The Cabildo de la Palma opted for smart agriculture with the new Smart Agro website: farmers receive personalised irrigation recommendations according to climate and location. The Cabildo has also launched a viewer to monitor mobility on the island.
- The City Council of Segovia has implemented a digital twin that centralizes high-value applications and geographic data, allowing the city to be visualized and analyzed in an interactive three-dimensional environment. It improves municipal management and promotes transparency and citizen participation.
- Vila-real City Council has launched a digital application that integrates public transport, car parks and tourist spots in real time. The project seeks to optimize urban mobility and promote sustainability through smart technology.
- Sant Boi City Council has launched an interactive map made with open data that centralises information on urban transport, parking and sustainable options on a single platform, in order to improve urban mobility.
- The DataActive International Research Network has been inaugurated, an initiative funded by the Higher Sports Council that seeks to promote the design of active urban environments through the use of open data.
Not only public bodies reuse open data, universities are also working on projects linked to digital innovation based on public information:
- Students from the Universitat de València have designed projects that use AI and open data to prevent natural disasters.
- Researchers from the University of Castilla-La Mancha have shown that it is feasible to reuse air quality prediction models in different areas of Madrid using transfer learning.
In addition to solutions, open data can also be used to shape other types of products, including sculptures. This is the case of "The skeleton of climate change", a figure presented by the National Museum of Natural Sciences, based on data on changes in global temperature from 1880 to 2024.
New portals and functionalities to extract value from data
The solutions and innovations mentioned above are possible thanks to the existence of multiple platforms for opening or sharing data that do not stop incorporating new data sets and functionalities to extract value from them. Some of the developments we have seen in this regard in recent months are:
- The National Observatory of Technology and Society (ONTSI) has launched a new website. One of its new features is Ontsi Data, a tool for preparing reports with indicators from both its portal and third parties.
- The General Council of Notaries has launched a Housing Statistical Portal, an open tool with reliable and up-to-date data on the real estate market in Spain.
- The Spanish Agency for Food Safety and Nutrition (AESAN) has inaugurated on its website an open data space with microdata on the composition of food and beverages marketed in Spain.
- The Centre for Sociological Research (CIS) launched a renewed website, adapted to any device and with a more powerful search engine to facilitate access to its studies and data.
- The National Geographic Institute (IGN) has presented a new website for SIOSE, the Information System on Land Occupation in Spain, with a more modern, intuitive and dynamic design. In addition, it has made available to the public a new version of the Geographic Reference Information of Transport Networks (IGR-RT), segmented by provinces and modes of transport, and available in Shapefile and GeoPackage.
- The AKIS Advisors Platform, promoted by the Ministry of Agriculture, Fisheries and Food, has launched a new open data API that allows registered users to download and reuse content related to the agri-food sector in Spain.
- The Government of Catalonia launched a new corporate website that centralises key aspects of European funds, public procurement, transparency and open data in a single point. It has also launched a website where it collects information on the AI systems it uses.
- PortCastelló has published its 2024 Proceedings in open data format. All the management, traffic, infrastructures and economic data of the port are now accessible and reusable by any citizen.
- Researchers from the Universitat Oberta de Catalunya and the Institute of Photonic Sciences have created an open library with data on 140 biomolecules. A pioneering resource that promotes open science and the use of open data in biomedicine.
- CitriData, a federated space for data, models and services in the Andalusian citrus value chain, was also presented. Its goal is to transform the sector through the intelligent and collaborative use of data.
Other organizations are immersed in the development of their novelties. For example, we will soon see the new Open Data Portal of Aguas de Alicante, which will allow public access to key information on water management, promoting the development of solutions based on Big Data and AI.
These months have also seen strategic advances linked to improving the quality and use of data, such as the Data Government Model of the Generalitat Valenciana or the Roadmap for the Provincial Strategy of artificial intelligence of the Provincial Council of Castellón.
Datos.gob.es also introduced a new platform aimed at optimizing both publishing and data access. If you want to know this and other news of the Aporta Initiative in 2025, we invite you to read this post.
Encouraging the use of data through events, resources and citizen actions
The second half of 2025 was the time chosen by a large number of public bodies to launch tenders aimed at promoting the reuse of the data they publish. This was the case of the Junta de Castilla y León, the Madrid City Council, the Valencia City Council and the Provincial Council of Bizkaia. Our country has also participated in international events such as the NASA Space Apps Challenge.
Among the events where the power of open data has been disseminated, the Open Government Partnership (OGP) Global Summit, the Iberian Conference on Spatial Data Infrastructures (JIIDE), the International Congress on Transparency and Open Government or the 17th International Conference on the Reuse of Public Sector Information of ASEDIE stand out. although there were many more.
Work has also been done on reports that highlight the impact of data on specific sectors, such as the DATAGRI Chair 2025 Report of the University of Cordoba, focused on the agri-food sector. Other published documents seek to help improve data management, such as "Fundamentals of Data Governance in the context of data spaces", led by DAMA Spain, in collaboration with Gaia-X Spain.
Citizen participation is also critical to the success of data-driven innovation. In this sense, we have seen both activities aimed at promoting the publication of data and improving those already published or their reuse:
- The Barcelona Open Data Initiative requested citizen help to draw up a ranking of digital solutions based on open data to promote healthy ageing. They also organized a participatory activity to improve the iCuida app, aimed at domestic and care workers. This app allows you to search for public toilets, climate shelters and other points of interest for the day-to-day life of caregivers.
- The Spanish Space Agency launched a survey to find out the needs and uses of Earth Observation images and data within the framework of strategic projects such as the Atlantic Constellation.
In conclusion, the activities carried out in the second half of 2025 highlight the consolidation of the open data ecosystem in Spain as a driver of innovation, transparency and citizen participation. Regulatory and strategic advances, together with the creation of new platforms and solutions based on data, show a firm commitment on the part of institutions and society to take advantage of public information as a key resource for sustainable development, the improvement of services and the generation of knowledge.
As always, this article is just a small sample of the activities carried out. We invite you to share other activities that you know about through the comments.
Blog
Three years after the acceleration of the massive deployment of Artificial Intelligence began with the launch of ChatGPT, a new term emerges strongly: Agentic AI. In the last three years, we have gone from talking about language models (such as LLMs) and chatbots (or conversational assistants) to designing the first systems capable not only of answering our questions, but also of acting autonomously to achieve objectives, combining data, tools and collaborations with other AI agents or with humans. That is, the global conversation about AI is moving from the ability to "converse" to the ability to "act" of these systems.
In the private sector, recent reports from large consulting firms describe AI agents that resolve customer incidents from start to finish, orchestrate supply chains, optimize inventories in the retail sector or automate business reporting. In the public sector, this conversation is also beginning to take shape and more and more administrations are exploring how these systems can help simplify procedures or improve citizen service. However, the deployment seems to be somewhat slower because logically the administration must not only take into account technical excellence but also strict compliance with the regulatory framework, which in Europe is set by the AI Regulation, so that autonomous agents are, above all, allies of citizens.
What is Agentic AI?
Although it is a recent concept that is still evolving, several administrations and bodies are beginning to converge on a definition. For example, the UK government describes agent AI as systems made up of AI agents that "can autonomously behave and interact to achieve their goals." In this context, an AI agent would be a specialized piece of software that can make decisions and operate cooperatively or independently to achieve the system's goals.
We might think, for example, of an AI agent in a local government who receives a request from a person to open a small business. The agent, designed in accordance with the corresponding administrative procedure, would check the applicable regulations, consult urban planning and economic activity data, verify requirements, fill in draft documents, propose appointments or complementary procedures and prepare a summary so that the civil servants could review and validate the application. That is, it would not replace the human decision, but would automate a large part of the work between the request made by the citizen and the resolution issued by the administration.
Compared to a conversational chatbot – which answers a question and, in general, ends the interaction there – an AI agent can chain multiple actions, review results, correct errors, collaborate with other AI agents and continue to iterate until it reaches the goal that has been defined for it. This does not mean that autonomous agents decide on their own without supervision, but that they can take over a good part of the task always following well-defined rules and safeguards.
Key characteristics of a freelance agent include:
- Perception and reasoning: is the ability of an agent to understand a complex request, interpret the context, and break down the problem into logical steps that lead to solving it.
- Planning and action: it is the ability to order these steps, decide the sequence in which they are going to be executed, and adapt the plan when the data changes or new constraints appear.
- Use of tools: An agent can, for example, connect to various APIs, query databases, open data catalogs, open and read documents, or send emails as required by the tasks they are trying to solve.
- Memory and context: is the ability of the agent to maintain the memory of interactions in long processes, remembering past actions and responses and the current state of the request it is resolving.
- Supervised autonomy: an agent can make decisions within previously established limits to advance towards the goal without the need for human intervention at each step, but always allowing the review and traceability of decisions.
We could summarize the change it entails with the following analogy: if LLMs are the engine of reasoning, AI agents are systems that , in addition to the ability to "think" about the actions that should be done, have "hands" to interact with the digital world and even with the physical world and execute those same actions.
The potential of AI agents in public services
Public services are organized, to a large extent, around processes of a certain complexity such as the processing of aid and subsidies, the management of files and licenses or the citizen service itself through multiple channels. They are processes with many different steps, rules and actors, where repetitive tasks and manual work of reviewing documentation abound.
As can be seen in the European Union's eGovernment Benchmark, eGovernment initiatives in recent decades have made it possible to move towards greater digitalisation of public services. However, the new wave of AI technologies, especially when foundational models are combined with agents, opens the door to a new leap to intelligently automate and orchestrate a large part of administrative processes.
In this context, autonomous agents would allow:
- Orchestrate end-to-end processes such as collecting data from different sources, proposing forms already completed, detecting inconsistencies in the documentation provided, or generating draft resolutions for validation by the responsible personnel.
- Act as "co-pilots" of public employees, preparing drafts, summaries or proposals for decisions that are then reviewed and validated, assisting in the search for relevant information or pointing out possible risks or incidents that require human attention.
- Optimise citizen service processes by supporting tasks such as managing medical appointments, answering queries about the status of files, facilitating the payment of taxes or guiding people in choosing the most appropriate procedure for their situation.
Various analyses on AI in the public sector suggest that this type of intelligent automation, as in the private sector, can reduce waiting times, improve the quality of decisions and free up staff time for more value-added tasks. A recent report by PWC and Microsoft exploring the potential of Agent AI for the public sector sums up the idea well, noting that by incorporating Agent AI into public services, governments can improve responsiveness and increase citizen satisfaction, provided that the right safeguards are in place.
In addition, the implementation of autonomous agents allows us to dream of a transition from a reactive administration (which waits for the citizen to request a service) to a proactive administration that offers to do part of those same actions for us: from notifying us that a grant has been opened for which we probably meet the requirements, to proposing the renewal of a license before it expires or reminding us of a medical appointment.
An illustrative example of the latter could be an AI agent that, based on data on available services and the information that the citizen himself has authorised to use, detects that a new aid has been published for actions to improve energy efficiency through the renovation of homes and sends a personalised notice to those who could meet the requirements. Even offering them a pre-filled draft application for review and acceptance. The final decision is still human, but the effort of seeking information, understanding conditions, and preparing documentation could be greatly reduced.
The role of open data
For an AI agent to be able to act in a useful and responsible way, they need to leverage on an environment rich in quality data and a robust data governance system. Among those assets needed to develop a good autonomous agent strategy, open data is important in at least three dimensions:
- Fuel for decision-making: AI agents need information on current regulations, service catalogues, administrative procedures, socio-economic and demographic indicators, data on transport, environment, urban planning, etc. To this end, data quality and structure is of great importance as outdated, incomplete, or poorly documented data can lead agents to make costly mistakes. In the public sector, these mistakes can translate into unfair decisions that could ultimately lead to a loss of public trust.
- Testbed for evaluating and auditing agents: Just as open data is important for evaluating generative AI models, it can also be important for testing and auditing autonomous agents. For example, simulating fictitious files with synthetic data based on real distributions to check how an agent acts in different scenarios. In this way, universities, civil society organizations and the administration itself can examine the behavior of agents and detect problems before scaling their use.
- Transparency and explainability: Open data could help document where the data an agent uses came from, how it has been transformed, or which versions of the datasets were in place when a decision was made. This traceability contributes to explainability and accountability, especially when an AI agent intervenes in decisions that affect people's rights or their access to public services. If citizens can consult, for example, the criteria and data that are applied to grant aid, confidence in the system is reinforced.
The panorama of agent AI in Spain and the rest of the world
Although the concept of agent AI is recent, there are already initiatives underway in the public sector at an international level and they are also beginning to make their way in the European and Spanish context:
- The Government Technology Agency (GovTech) of Singapore has published an Agentic AI Primer guide to guide developers and public officials on how to apply this technology, highlighting both its advantages and risks. In addition, the government is piloting the use of agents in various settings to reduce the administrative burden on social workers and support companies in complex licensing processes. All this in a controlled environment (sandbox) to test these solutions before scaling them.
- The UK government has published a specific note within its "AI Insights" documentation to explain what agent AI is and why it is relevant to government services. In addition, it has announced a tender to develop a "GOV.UK Agentic AI Companion" that will serve as an intelligent assistant for citizens from the government portal.
- The European Commission, within the framework of the Apply AI strategy and the GenAI4EU initiative, has launched calls to finance pilot projects that introduce scalable and replicable generative AI solutions in public administrations, fully integrated into their workflows. These calls seek precisely to accelerate the pace of digitalization through AI (including specialized agents) to improve decision-making, simplify procedures and make administration more accessible.
In Spain, although the label "agéntica AI" is not yet widely used, some experiences that go in that direction can already be identified. For example, different administrations are incorporating co-pilots based on generative AI to support public employees in tasks of searching for information, writing and summarizing documents, or managing files, as shown by initiatives of regional governments such as that of Aragon and local entities such as Barcelona City Council that are beginning to document themselves publicly.
The leap towards more autonomous agents in the public sector therefore seems to be a natural evolution on the basis of the existing e-government. But this evolution must, at the same time, reinforce the commitment to transparency, fairness, accountability, human oversight and regulatory compliance required by the AI Regulation and the rest of the regulatory framework and which should guide the actions of the public administration.
Looking to the Future: AI Agents, Open Data, and Citizen Trust
The arrival of agent AI once again offers the public administration new tools to reduce bureaucracy, personalize care and optimize its always scarce resources. However, technology is only a means, the ultimate goal is still to generate public value by reinforcing the trust of citizens.
In principle, Spain is in a good position: it has an Artificial Intelligence Strategy 2024 that is committed to transparent, ethical and human-centred AI, with specific lines to promote its use in the public sector; it has aconsolidated open data infrastructure; and it has created the Spanish Agency for the Supervision of Artificial Intelligence (AESIA) as a body in charge of ensuring an ethical and safe use of AI, in accordance with the European AI Regulation.
We are, therefore, facing a new opportunity for modernisation that can build more efficient, closer and even proactive public services. If we are able to adopt the Agent AI properly, the agents that are deployed will not be a "black box" that acts without supervision, but digital, transparent and auditable "public agents", designed to work with open data, explain their decisions and leave a trace of the actions they take. Tools, in short, inclusive, people-centred and aligned with the values of public service.
Content created by Jose Luis Marín, Senior Consultant in Data, Strategy, Innovation & Digitalisation. The contents and views expressed in this publication are the sole responsibility of the author.
Application
Rampa is a route service for people with reduced mobility. This project, developed as part of the Madrid City Council's 2025 Open Data Reuse Awards, combines open data and geospatial technology to facilitate the search for accessible routes and services for people with reduced mobility.
The web application provides the following data:
- Accessibility: it offers optimised routes for wheelchairs, walkers and people with reduced mobility.
- Demographic data: it allows you to view ageing, dependency and population density indices to better understand the needs of each area.
- Control panel: it allows you to view the areas with the highest and lowest accessibility in Madrid and detects the most accessible neighbourhoods and districts.
Application
Web platform for filtering and organizing proposals from the Congress of Deputies according to party votes, with the ability to show how one or more parties voted collectively or individually.
As proposals may have several votes, the main vote for each proposal is extracted using a ChatGPT AI model. AI is also used to extract information on the different points of a proposal and generate an explanatory description of the proposal that is understandable to anyone.
The aim is to have a platform where the activity of the Congress of Deputies can be seen clearly and simply.
Noticia
The reuse of open data makes it possible to generate innovative solutions that improve people's lives, boost citizen participation and strengthen public transparency. Proof of this are the competitions promoted this year by the Junta de Castilla y León and the Madrid City Council.
Being the IX edition of the Castilla y León Competition and the first edition of the Madrid Competition, both administrations have presented the prizes to the selected projects, recognising both students and startups as well as professionals and researchers who have been able to transform public data into useful tools and knowledge. In this post, we review the award-winning projects in each competition and the context that drives them.
Castilla y León: ninth edition of consolidated awards in a more open administration
At the awards ceremony of the IX Open Data Contest of the Junta de Castilla y León, the budget reinforcement (+65%) in the General Directorate of Transparency and Good Governance, the expansion of active advertising content and a continuous improvement of the right of access to public information, which has reduced requests and rejection resolutions, were highlighted. The Open Data Portal of Castilla y León has 776 datasets that allow the development of services, applications and studies each year.
The Open Data Awards recognize initiatives in four categories: Ideas, Products and Services, Teaching Resources, Data Journalism.
Ideas
-
First prize: CyL Rural Hub. Proposal to develop a comprehensive platform for the rural territory that centralises services, infrastructures, job opportunities and educational offer. Its objective is to provide families and professionals with useful information to plan a life project in the villages of the community.
-
Second prize: Cultural App of Castilla y León. An idea aimed at boosting cultural activity through an application that centralises events, activities and locations, also offering an intuitive and close experience based on open data.
Products & Services
-
First prize: CyL Bridge. Application designed to support the integration of migrants through personalized routes, an artificial intelligence assistant and a resource center powered by public data.
-
Second prize: MuniCyL. A tool that brings together dispersed municipal information and presents it on a single clear, accessible and up-to-date platform.
-
Third prize: Interactive map of Natural Spaces. A resource that allows citizens to explore the protected areas of the territory dynamically and in real time.
-
Student awards: Info Salamanca. Platform that offers interactive maps, thematic filters and a conversational assistant to bring provincial information closer and facilitate the consultation of citizen data.
Teaching Resource
-
First prize: Use of open data from the Junta de Castilla y León in web development. A project that introduces open data into the learning of web development, with practical exercises and an AI search engine to work directly with real data from the portal.
Data Journalism
-
First prize: Heart attacks are no longer a matter of age, a report on the increase in heart attacks among young people.
-
Second prize: Burgos maintains regional leadership with 79 wind farms: an analysis of the deployment of renewable energies in the region.
Madrid: first edition of awards that promote reuse in the urban environment
On the other hand, the Madrid City Council has held the first edition of the Open Data Reuse Awards 2025. The ceremony highlighted the quality and diversity of the 65 applications submitted, many of them driven by university students and startups.
The awards seek to promote the use of data from the Madrid City Council's Open Data Portal, support the creation of services and studies that contribute to knowledge of the city and reinforce the role of the city council as a benchmark administration in transparency and accountability.
In this case, the awards are structured into four categories: Web Services and Applications, Visualizations, Studies and Ideas, and Portal Improvement.
Web Services & Applications
-
First prize: Madriwa. Find your place in Madrid. A tool that facilitates the search for housing through data on neighbourhoods, services and prices, allowing an informed and simplified comparison.
-
Second prize: The guardians of the air. Application developed by Tangible Data to check the city's air quality, especially designed to raise awareness among young people and educational centers.
Data viz
-
First prize: Ramp. Routes for people with reduced mobility. It presents accessible itineraries based on geospatial and orography data, offering alternative routes adapted to people with reduced mobility.
-
Second prize: AccesibiliMad. It shows public services available in each urban environment, with special attention to the specific needs of different groups.
Studies, Research and Ideas
-
First prize: Fifteen-minute cities for children. Analysis of the availability of essential services for minors within a maximum radius of 15 minutes, providing an innovative vision of urban planning.
-
Second prize: The impact of tourism in urban areas. This study delves into the relationship between tourist housing, the commercial fabric and labour dynamics, using urban and socio-economic data.
Improving Portal Quality
-
First prize: Your Open Data. Improving harvesting in data.europa.eu. Proposal that improves the way data is provided, raising the quality of metadata and boosting European interoperability.
-
Second prize: Discovery, observability and intelligent governance of open data. Solution that introduces an automated layer of intelligence and control over the municipal catalog.
Both Castilla y León, with a consolidated track record, and the Madrid City Council, which inaugurates its own recognition, contribute decisively to strengthening the Spanish open data ecosystem. Its calls are an example of how collaboration between administrations, citizens, academia and the private sector can transform public data into knowledge, participation and innovation at the service of society as a whole.
Documentación
In the public sector ecosystem, subsidies represent one of the most important mechanisms for promoting projects, companies and activities of general interest. However, understanding how these funds are distributed, which agencies call for the largest grants or how the budget varies according to the region or beneficiaries is not trivial when working with hundreds of thousands of records.
In this line, we present a new practical exercise in the series "Step-by-step data exercises", in which we will learn how to explore and model open data using Apache Spark, one of the most widespread platforms for distributed processing and large-scale machine learning.
In this laboratory we will work with real data from the National System of Advertising of Subsidies and Public Aid (BDNS) and we will build a model capable of predicting the budget range of new calls based on their main characteristics.
All the code used is available in the corresponding GitHub repository so that you can run it, understand it, and adapt it to your own projects.
Access the datalab repository on GitHub
Run the data pre-processing code on Google Colab
Context: why analyze public subsidies?
The BDNS collects detailed information on hundreds of thousands of calls published by different Spanish administrations: from ministries and regional ministries to provincial councils and city councils. This dataset is an extraordinarily valuable source for:
- analyse the evolution of public spending,
- understand which organisms are most active in certain areas,
- identify patterns in the types of beneficiaries,
- and to study the budget distribution according to sector or territory.
In our case, we will use the dataset to address a very specific question, but of great practical interest:
Can we predict the budget range of a call based on its administrative characteristics?
This capability would facilitate initial classification, decision-making support or comparative analysis within a public administration.
Objective of the exercise
The objective of the laboratory is twofold:
- Learn how to use Spark in a practical way:
- Upload a real high-volume dataset
- Perform transformations and cleaning
- Manipulate categorical and numeric columns
- Structuring a machine learning pipeline
- Building a predictive model
We will train a classifier capable of estimating whether a call belongs to one of these ranges of low budget (up to €20k), medium (between €20 and €150k) or high (greater than €150k), based on variables such as:
- Granting body
- Autonomous community
- Type of beneficiary
- Year of publication
- Administrative descriptions
Resources used
To complete this exercise we use:
Analytical tools
- Python, the main language of the project
- Google Colab, to run Spark and create Notebooks in a simple way
- PySpark, for data processing in the cleaning and modeling stages
- Pandas, for small auxiliary operations
- Plotly, for some interactive visualizations
Data
Official dataset of the National System of Advertising of Subsidies (BDNS), downloaded from the subsidy portal of the Ministry of Finance.
The data used in this exercise were downloaded on August 28, 2025. The reuse of data from the National System for the Publicity of Subsidies and Public Aid is subject to the legal conditions set out in https://www.infosubvenciones.es/bdnstrans/GE/es/avisolegal.
Development of the exercise
The project is divided into several phases, following the natural flow of a real Data Science case.
5.1. Data Dump and Transformation
In this first section we are going to automatically download the subsidy dataset from the API of the portal of the National System of Publicity of Subsidies (BDNS). We will then transform the data into an optimized format such as Parquet (columnar data format) to facilitate its exploration and analysis.
In this process we will use some complex concepts, such as:
- Asynchronous functions: allows two or more independent operations to be processed in parallel, which makes it easier to make the process more efficient.
- Rotary writer: when a limit on the amount of information is exceeded, the file being processed is closed and a new one is opened with an auto-incremental index (after the previous one). This avoids processing files that are too large and improves efficiency.
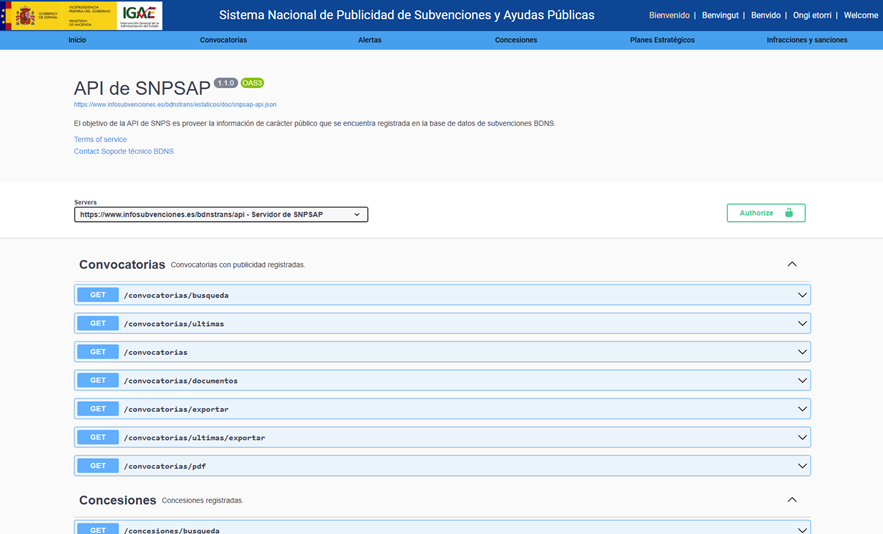
Figure 1. Screenshot of the API of the National System for Advertising Subsidies and Public Aid
5.2. Exploratory analysis
The aim of this phase is to get a first idea of the characteristics of the data and its quality.
We will analyze, among others, aspects such as:
- Which types of subsidies have the highest number of calls.
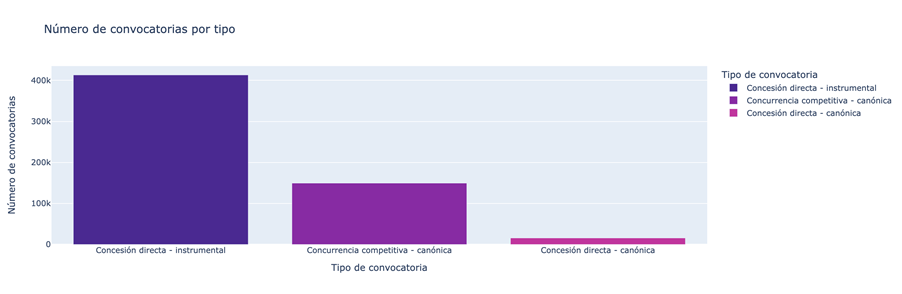
Figure 2. Types of grants with the highest number of calls for applications.
- What is the distribution of subsidies according to their purpose (i.e. Culture, Education, Promotion of employment...).
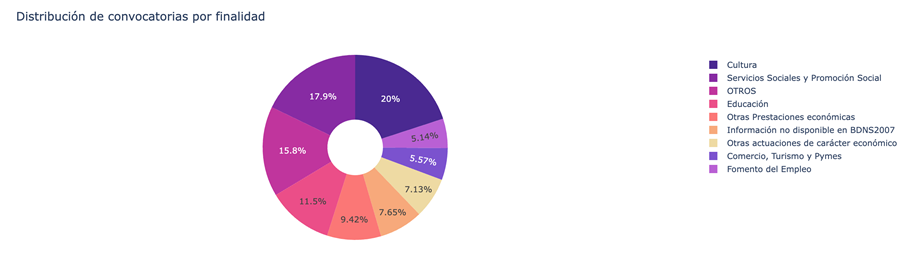
Figure 3. Distribution of grants according to their purpose.
- Which purposes add a greater budget volume.
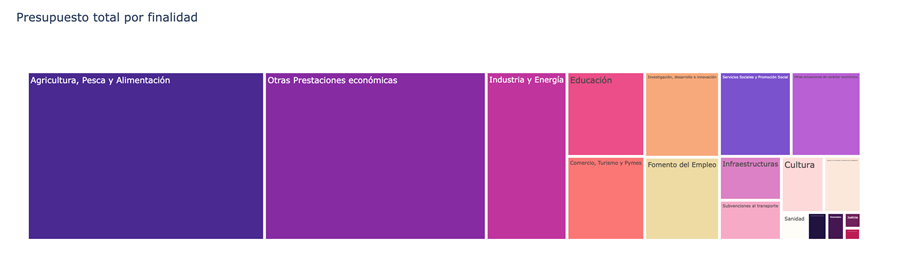
Figure 4. Purposes with the largest budgetary volume.
5.3. Modelling: construction of the budget classifier
At this point, we enter the most analytical part of the exercise: teaching a machine to predict whether a new call will have a low, medium or high budget based on its administrative characteristics. To achieve this, we designed a complete machine learning pipeline in Spark that allows us to transform the data, train the model, and evaluate it in a uniform and reproducible way.
First, we prepare all the variables – many of them categorical, such as the convening body – so that the model can interpret them. We then combine all that information into a single vector that serves as the starting point for the learning phase.
With that foundation built, we train a classification model that learns to distinguish subtle patterns in the data: which agencies tend to publish larger calls or how specific administrative elements influence the size of a grant.
Once trained, we analyze their performance from different angles. We evaluate their ability to correctly classify the three budget ranges and analyze their behavior using metrics such as accuracy or the confusion matrix.
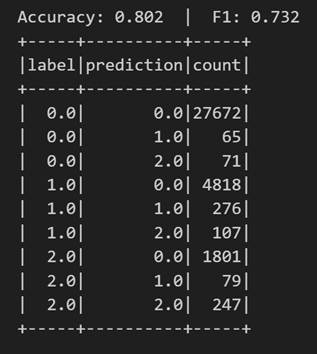
Figure 5. Accuracy metrics.
But we do not stop there: we also study which variables have had the greatest weight in the decisions of the model, which allows us to understand which factors seem most decisive when it comes to anticipating the budget of a call.
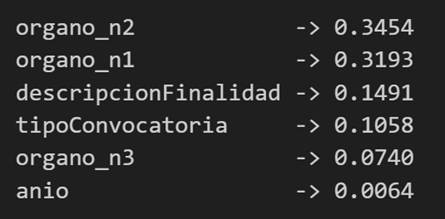
Figure 6. Variables that have had the greatest weight in the model's decisions.
Conclusions of the exercise
This laboratory will allow us to see how Spark simplifies the processing and modelling of high-volume data, especially useful in environments where administrations generate thousands of records per year, and to better understand the subsidy system after analysing some key aspects of the organisation of these calls.
Do you want to do the exercise?
If you're interested in learning more about using Spark and advanced public data analysis, you can access the repository and run the full Notebook step-by-step.
Content created by Juan Benavente, senior industrial engineer and expert in technologies related to the data economy. The content and views expressed in this publication are the sole responsibility of the author.
Blog
We live in an age where more and more phenomena in the physical world can be observed, measured, and analyzed in real time. The temperature of a crop, the air quality of a city, the state of a dam, the flow of traffic or the energy consumption of a building are no longer data that are occasionally reviewed: they are continuous flows of information that are generated second by second.
This revolution would not be possible without cyber-physical systems (CPS), a technology that integrates sensors, algorithms and actuators to connect the physical world with the digital world. But CPS does not only generate data: it can also be fed by open data, multiplying its usefulness and enabling evidence-based decisions.
In this article, we will explore what CPS is, how it generates massive data in real time, what challenges it poses to turn that data into useful public information, what principles are essential to ensure its quality and traceability, and what real-world examples demonstrate the potential for its reuse. We will close with a reflection on the impact of this combination on innovation, citizen science and the design of smarter public policies.
What are cyber-physical systems?
A cyber-physical system is a tight integration between digital components – such as software, algorithms, communication and storage – and physical components – sensors, actuators, IoT devices or industrial machines. Its main function is to observe the environment, process information and act on it.
Unlike traditional monitoring systems, a CPS is not limited to measuring: it closes a complete loop between perception, decision, and action. This cycle can be understood through three main elements:
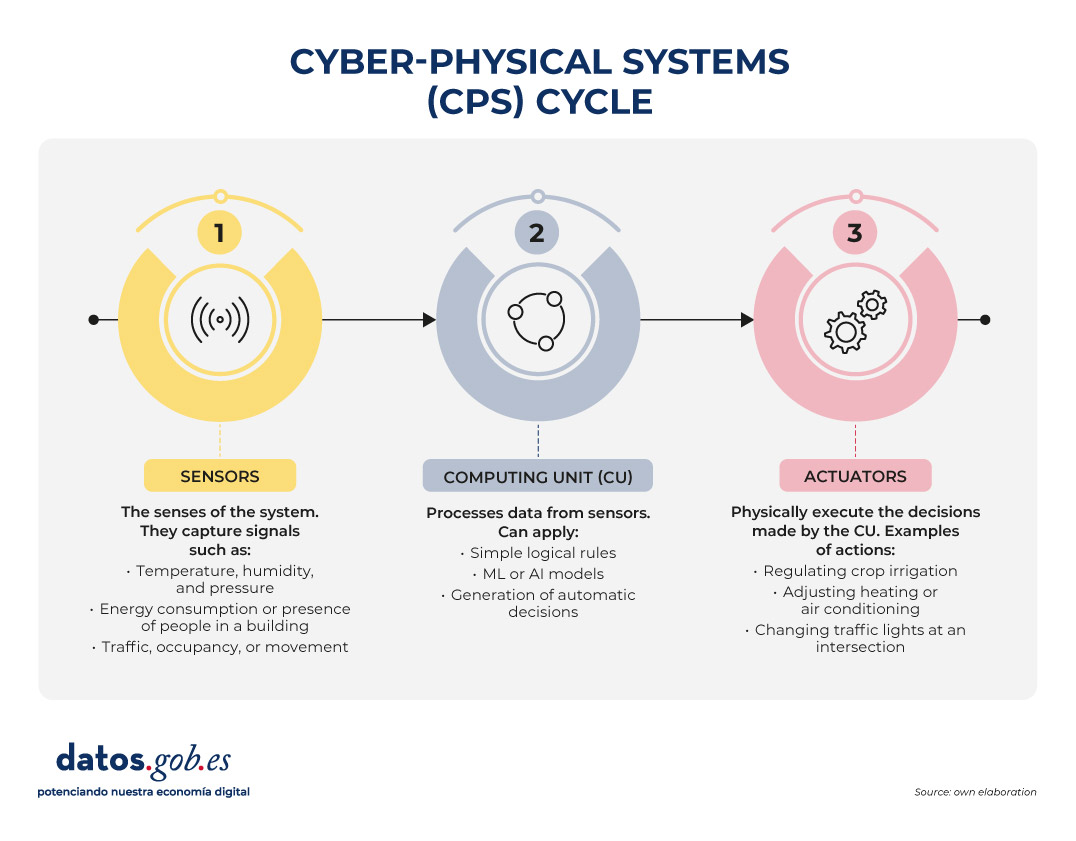
Figure 1. Cyber-physical systems cycle. Source: own elaboration
An everyday example that illustrates this complete cycle of perception, decision and action very well is smart irrigation, which is increasingly present in precision agriculture and home gardening systems. In this case, sensors distributed throughout the terrain continuously measure soil moisture, ambient temperature, and even solar radiation. All this information flows to the computing unit, which analyzes the data, compares it with previously defined thresholds or with more complex models – for example, those that estimate the evaporation of water or the water needs of each type of plant – and determines whether irrigation is really necessary.
When the system concludes that the floor has reached a critical level of dryness, the third element of CPS comes into play: the actuators. They are the ones who open the valves, activate the water pump or regulate the flow rate, and they do so for the exact time necessary to return the humidity to optimal levels. If conditions change—if it starts raining, if the temperature drops, or if the soil recovers moisture faster than expected—the system itself adjusts its behavior accordingly.
This whole process happens without human intervention, autonomously. The result is a more sustainable use of water, better cared for plants and a real-time adaptability that is only possible thanks to the integration of sensors, algorithms and actuators characteristic of cyber-physical systems.
CPS as real-time data factories
One of the most relevant characteristics of cyber-physical systems is their ability to generate data continuously, massively and with a very high temporal resolution. This constant production can be seen in many day-to-day situations:
- A hydrological station can record level and flow every minute.
- An urban mobility sensor can generate hundreds of readings per second.
- A smart meter records electricity consumption every few minutes.
- An agricultural sensor measures humidity, salinity, and solar radiation several times a day.
- A mapping drone captures decimetric GPS positions in real time.
Beyond these specific examples, the important thing is to understand what this capability means for the system as a whole: CPS become true data factories, and in many cases come to function as digital twins of the physical environment they monitor. This almost instantaneous equivalence between the real state of a river, a crop, a road or an industrial machine and its digital representation allows us to have an extremely accurate and up-to-date portrait of the physical world, practically at the same time as the phenomena occur.
This wealth of data opens up a huge field of opportunity when published as open information. Data from CPS can drive innovative services developed by companies, fuel high-impact scientific research, empower citizen science initiatives that complement institutional data, and strengthen transparency and accountability in the management of public resources.
However, for all this value to really reach citizens and the reuse community, it is necessary to overcome a series of technical, organisational and quality challenges that determine the final usefulness of open data. Below, we look at what those challenges are and why they are so important in an ecosystem that is increasingly reliant on real-time generated information.
The challenge: from raw data to useful public information
Just because a CPS generates data does not mean that it can be published directly as open data. Before reaching the public and reuse companies, the information needs prior preparation , validation, filtering and documentation. Administrations must ensure that such data is understandable, interoperable and reliable. And along the way, several challenges appear.
One of the first is standardization. Each manufacturer, sensor and system can use different formats, different sample rates or its own structures. If these differences are not harmonized, what we obtain is a mosaic that is difficult to integrate. For data to be interoperable, common models, homogeneous units, coherent structures, and shared standards are needed. Regulations such as INSPIRE or the OGC (Open Geospatial Consortium) and IoT-TS standards are key so that data generated in one city can be understood, without additional transformation, in another administration or by any reuser.
The next big challenge is quality. Sensors can fail, freeze always reporting the same value, generate physically impossible readings, suffer electromagnetic interference or be poorly calibrated for weeks without anyone noticing. If this information is published as is, without a prior review and cleaning process, the open data loses value and can even lead to errors. Validation – with automatic checks and periodic review – is therefore indispensable.
Another critical point is contextualization. An isolated piece of information is meaningless. A "12.5" says nothing if we don't know if it's degrees, liters or decibels. A measurement of "125 ppm" is useless if we do not know what substance is being measured. Even something as seemingly objective as coordinates needs a specific frame of reference. And any environmental or physical data can only be properly interpreted if it is accompanied by the date, time, exact location and conditions of capture. This is all part of metadata, which is essential for third parties to be able to reuse information unambiguously.
It's also critical to address privacy and security. Some CPS can capture information that, directly or indirectly, could be linked to sensitive people, property, or infrastructure. Before publishing the data, it is necessary to apply anonymization processes, aggregation techniques, security controls and impact assessments that guarantee that the open data does not compromise rights or expose critical information.
Finally, there are operational challenges such as refresh rate and robustness of data flow. Although CPS generates information in real time, it is not always appropriate to publish it with the same granularity: sometimes it is necessary to aggregate it, validate temporal consistency or correct values before sharing it. Similarly, for data to be useful in technical analysis or in public services, it must arrive without prolonged interruptions or duplication, which requires a stable infrastructure and monitoring mechanisms.
Quality and traceability principles needed for reliable open data
Once these challenges have been overcome, the publication of data from cyber-physical systems must be based on a series of principles of quality and traceability. Without them, information loses value and, above all, loses trust.
The first is accuracy. The data must faithfully represent the phenomenon it measures. This requires properly calibrated sensors, regular checks, removal of clearly erroneous values, and checking that readings are within physically possible ranges. A sensor that reads 200°C at a weather station or a meter that records the same consumption for 48 hours are signs of a problem that needs to be detected before publication.
The second principle is completeness. A dataset should indicate when there are missing values, time gaps, or periods when a sensor has been disconnected. Hiding these gaps can lead to wrong conclusions, especially in scientific analyses or in predictive models that depend on the continuity of the time series.
The third key element is traceability, i.e. the ability to reconstruct the history of the data. Knowing which sensor generated it, where it is installed, what transformations it has undergone, when it was captured or if it went through a cleaning process allows us to evaluate its quality and reliability. Without traceability, trust erodes and data loses value as evidence.
Proper updating is another fundamental principle. The frequency with which information is published must be adapted to the phenomenon measured. Air pollution levels may need updates every few minutes; urban traffic, every second; hydrology, every minute or every hour depending on the type of station; and meteorological data, with variable frequencies. Posting too quickly can generate noise; too slow, it can render the data useless for certain uses.
The last principle is that of rich metadata. Metadata explains the data: what it measures, how it is measured, with what unit, how accurate the sensor is, what its operating range is, where it is located, what limitations the measurement has and what this information is generated for. They are not a footnote, but the piece that allows any reuser to understand the context and reliability of the dataset. With good documentation, reuse isn't just possible: it skyrockets.
Examples: CPS that reuses public data to be smarter
In addition to generating data, many cyber-physical systems also consume public data to improve their performance. This feedback makes open data a central resource for the functioning of smart territories. When a CPS integrates information from its own sensors with external open sources, its anticipation, efficiency, and accuracy capabilities are dramatically increased.
Precision agriculture: In agriculture, sensors installed in the field allow variables such as soil moisture, temperature or solar radiation to be measured. However, smart irrigation systems do not rely solely on this local information: they also incorporate weather forecasts from AEMET, open IGN maps on slope or soil types, and climate models published as public data. By combining their own measurements with these external sources, agricultural CPS can determine much more accurately which areas of the land need water, when to plant, and how much moisture should be maintained in each crop. This fine management allows water and fertilizer savings that, in some cases, exceed 30%.
Water management: Something similar happens in water management. A cyber-physical system that controls a dam or irrigation canal needs to know not only what is happening at that moment, but also what may happen in the coming hours or days. For this reason, it integrates its own level sensors with open data on river gauging, rain and snow predictions, and even public information on ecological flows. With this expanded vision, the CPS can anticipate floods, optimize the release of the reservoir, respond better to extreme events or plan irrigation sustainably. In practice, the combination of proprietary and open data translates into safer and more efficient water management.
Impact: innovation, citizen science, and data-driven decisions
The union between cyber-physical systems and open data generates a multiplier effect that is manifested in different areas.
- Business innovation: Companies have fertile ground to develop solutions based on reliable and real-time information. From open data and CPS measurements, smarter mobility applications, water management platforms, energy analysis tools, or predictive systems for agriculture can emerge. Access to public data lowers barriers to entry and allows services to be created without the need for expensive private datasets, accelerating innovation and the emergence of new business models.
- Citizen science: the combination of SCP and open data also strengthens social participation. Neighbourhood communities, associations or environmental groups can deploy low-cost sensors to complement public data and better understand what is happening in their environment. This gives rise to initiatives that measure noise in school zones, monitor pollution levels in specific neighbourhoods, follow the evolution of biodiversity or build collaborative maps that enrich official information.
- Better public decision-making: finally, public managers benefit from this strengthened data ecosystem. The availability of reliable and up-to-date measurements makes it possible to design low-emission zones, plan urban transport more effectively, optimise irrigation networks, manage drought or flood situations or regulate energy policies based on real indicators. Without open data that complements and contextualizes the information generated by the CPS, these decisions would be less transparent and, above all, less defensible to the public.
In short, cyber-physical systems have become an essential piece of understanding and managing the world around us. Thanks to them, we can measure phenomena in real time, anticipate changes and act in a precise and automated way. But its true potential unfolds when its data is integrated into a quality open data ecosystem, capable of providing context, enriching decisions and multiplying uses.
The combination of SPC and open data allows us to move towards smarter territories, more efficient public services and more informed citizen participation. It provides economic value, drives innovation, facilitates research and improves decision-making in areas as diverse as mobility, water, energy or agriculture.
For all this to be possible, it is essential to guarantee the quality, traceability and standardization of the published data, as well as to protect privacy and ensure the robustness of information flows. When these foundations are well established, CPS not only measure the world: they help it improve, becoming a solid bridge between physical reality and shared knowledge.
Content created by Dr. Fernando Gualo, Professor at UCLM and Government and Data Quality Consultant. The content and views expressed in this publication are the sole responsibility of the author.
Noticia
The European open data portal has published the third volume of its Use Case Observatory, a report that compiles the evolution of data reuse projects across Europe. This initiative highlights the progress made in four areas: economic, governmental, social and environmental impact.
The closure of a three-year investigation
Between 2022 and 2025, the European Open Data Portal has systematically monitored the evolution of various European projects. The research began with an initial selection of 30 representative initiatives, which were analyzed in depth to identify their potential for impact.
After two years, 13 projects continued in the study, including three Spanish ones: Planttes, Tangible Data and UniversiDATA-Lab. Its development over time was studied to understand how the reuse of open data can generate real and sustainable benefits.
The publication of volume III in October 2025 marks the closure of this series of reports, following volume I (2022) and volume II (2024). This last document offers a longitudinal view, showing how the projects have matured in three years of observation and what concrete impacts they have generated in their respective contexts.
Common conclusions
This third and final report compiles a number of key findings:
Economic impact
Open data drives growth and efficiency across industries. They contribute to job creation, both directly and indirectly, facilitate smarter recruitment processes and stimulate innovation in areas such as urban planning and digital services.
The report shows the example of:
- Naar Jobs (Belgium): an application for job search close to users' homes and focused on the available transport options.
This application demonstrates how open data can become a driver for regional employment and business development.
Government impact
The opening of data strengthens transparency, accountability and citizen participation.
Two use cases analysed belong to this field:
- Waar is mijn stemlokaal? (Netherlands): platform for the search for polling stations.
- Statsregnskapet.no (Norway): website to visualize government revenues and expenditures.
Both examples show how access to public information empowers citizens, enriches the work of the media, and supports evidence-based policymaking. All of this helps to strengthen democratic processes and trust in institutions.
Social impact
Open data promotes inclusion, collaboration, and well-being.
The following initiatives analysed belong to this field:
- UniversiDATA-Lab (Spain): university data repository that facilitates analytical applications.
- VisImE-360 (Italy): a tool to map visual impairment and guide health resources.
- Tangible Data (Spain): a company focused on making physical sculptures that turn data into accessible experiences.
- EU Twinnings (Netherlands): platform that compares European regions to find "twin cities"
- Open Food Facts (France): collaborative database on food products.
- Integreat (Germany): application that centralizes public information to support the integration of migrants.
All of them show how data-driven solutions can amplify the voice of vulnerable groups, improve health outcomes and open up new educational opportunities. Even the smallest effects, such as improvement in a single person's life, can prove significant and long-lasting.
Environmental impact
Open data acts as a powerful enabler of sustainability.
As with environmental impact, in this area we find a large number of use cases:
- Digital Forest Dryads (Estonia): a project that uses data to monitor forests and promote their conservation.
- Air Quality in Cyprus (Cyprus): platform that reports on air quality and supports environmental policies.
- Planttes (Spain): citizen science app that helps people with pollen allergies by tracking plant phenology.
- Environ-Mate (Ireland): a tool that promotes sustainable habits and ecological awareness.
These initiatives highlight how data reuse contributes to raising awareness, driving behavioural change and enabling targeted interventions to protect ecosystems and strengthen climate resilience.
Volume III also points to common challenges: the need for sustainable financing, the importance of combining institutional data with citizen-generated data, and the desirability of involving end-users throughout the project lifecycle. In addition, it underlines the importance of European collaboration and transnational interoperability to scale impact.
Overall, the report reinforces the relevance of continuing to invest in open data ecosystems as a key tool to address societal challenges and promote inclusive transformation.
The impact of Spanish projects on the reuse of open data
As we have mentioned, three of the use cases analysed in the Use Case Observatory have a Spanish stamp. These initiatives stand out for their ability to combine technological innovation with social and environmental impact, and highlight Spain 's relevance within the European open data ecosystem. His career demonstrates how our country actively contributes to transforming data into solutions that improve people's lives and reinforce sustainability and inclusion. Below, we zoom in on what the report says about them.
This citizen science initiative helps people with pollen allergies through real-time information about allergenic plants in bloom. Since its appearance in Volume I of the Use Case Observatory, it has evolved as a participatory platform in which users contribute photos and phenological data to create a personalized risk map. This participatory model has made it possible to maintain a constant flow of information validated by researchers and to offer increasingly complete maps. With more than 1,000 initial downloads and about 65,000 annual visitors to its website, it is a useful tool for people with allergies, educators and researchers.
The project has strengthened its digital presence, with increasing visibility thanks to the support of institutions such as the Autonomous University of Barcelona and the University of Granada, in addition to the promotion carried out by the company Thigis.
Its challenges include expanding geographical coverage beyond Catalonia and Granada and sustaining data participation and validation. Therefore, looking to the future, it seeks to extend its territorial reach, strengthen collaboration with schools and communities, integrate more data in real time and improve its predictive capabilities.
Throughout this time, Planttes has established herself as an example of how citizen-driven science can improve public health and environmental awareness, demonstrating the value of citizen science in environmental education, allergy management, and climate change monitoring.
The project transforms datasets into physical sculptures that represent global challenges such as climate change or poverty, integrating QR codes and NFC to contextualize the information. Recognized at the EU Open Data Days 2025, Tangible Data has inaugurated its installation Tangible climate at the National Museum of Natural Sciences in Madrid.
Tangible Data has evolved in three years from a prototype project based on 3D sculptures to visualize sustainability data to become an educational and cultural platform that connects open data with society. Volume III of the Use Case Observatory reflects its expansion into schools and museums, the creation of an educational program for 15-year-old students, and the development of interactive experiences with artificial intelligence, consolidating its commitment to accessibility and social impact.
Its challenges include funding and scaling up the education programme, while its future goals include scaling up school activities, displaying large-format sculptures in public spaces, and strengthening collaboration with artists and museums. Overall, it remains true to its mission of making data tangible, inclusive, and actionable.
UniversiDATA-Lab is a dynamic repository of analytical applications based on open data from Spanish universities, created in 2020 as a public-private collaboration and currently made up of six institutions. Its unified infrastructure facilitates the publication and reuse of data in standardized formats, reducing barriers and allowing students, researchers, companies and citizens to access useful information for education, research and decision-making.
Over the past three years, the project has grown from a prototype to a consolidated platform, with active applications such as the budget and retirement viewer, and a hiring viewer in beta. In addition, it organizes a periodic datathon that promotes innovation and projects with social impact.
Its challenges include internal resistance at some universities and the complex anonymization of sensitive data, although it has responded with robust protocols and a focus on transparency. Looking to the future, it seeks to expand its catalogue, add new universities and launch applications on emerging issues such as school dropouts, teacher diversity or sustainability, aspiring to become a European benchmark in the reuse of open data in higher education.
Conclusion
In conclusion, the third volume of the Use Case Observatory confirms that open data has established itself as a key tool to boost innovation, transparency and sustainability in Europe. The projects analysed – and in particular the Spanish initiatives Planttes, Tangible Data and UniversiDATA-Lab – demonstrate that the reuse of public information can translate into concrete benefits for citizens, education, research and the environment.