Blog
Artificial intelligence (AI) is revolutionising the way we create and consume content. From automating repetitive tasks to personalising experiences, AI offers tools that are changing the landscape of marketing, communication and creativity.
These artificial intelligences need to be trained with data that are fit for purpose and not copyrighted. Open data is therefore emerging as a very useful tool for the future of AI.
The Govlab has published the report "A Fourth Wave of Open Data? Exploring the Spectrum of Scenarios for Open Data and Generative AI" to explore this issue in more detail. It analyses the emerging relationship between open data and generative AI, presenting various scenarios and recommendations. Their key points are set out below.
The role of data in generative AI
Data is the fundamental basis for generative artificial intelligence models. Building and training such models requires a large volume of data, the scale and variety of which is conditioned by the objectives and use cases of the model.
The following graphic explains how data functions as a key input and output of a generative AI system. Data is collected from various sources, including open data portals, in order to train a general-purpose AI model. This model will then be adapted to perform specific functions and different types of analysis, which in turn generate new data that can be used to further train models.
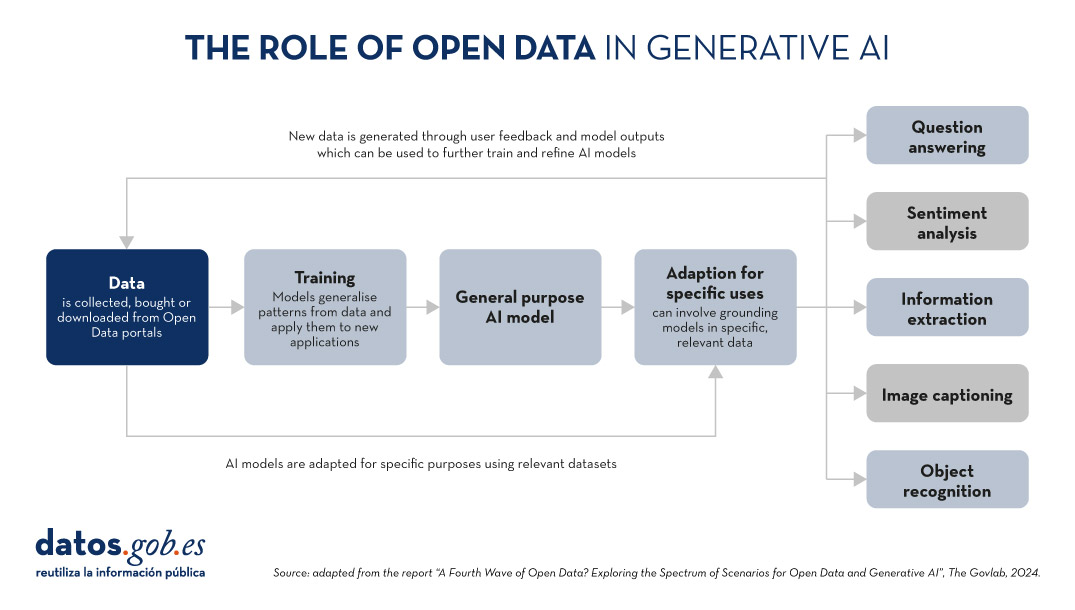
Figure 1. The role of open data in generative AI, adapted from the report “A Fourth Wave of Open Data? Exploring the Spectrum of Scenarios for Open Data and Generative AI”, The Govlab, 2024.
5 scenarios where open data and artificial intelligence converge
In order to help open data providers ''prepare'' their data for generative AI, The Govlab has defined five scenarios outlining five different ways in which open data and generative AI can intersect. These scenarios are intended as a starting point, to be expanded in the future, based on available use cases.
| Scenario | Function | Quality requirements | Metadata requirements | Example |
|---|---|---|---|---|
| Pre-training | Training the foundational layers of a generative AI model with large amounts of open data. | High volume of data, diverse and representative of the application domain and non-structured usage. | Clear information on the source of the data. | Data from NASA''s Harmonized Landsat Sentinel-2 (HLS) project were used to train the geospatial foundational model watsonx.ai. |
| Adaptation | Refinement of a pre-trained model with task-specific open data, using fine-tuning or RAG techniques. | Tabular and/or unstructured data of high accuracy and relevance to the target task, with a balanced distribution. | Metadata focused on the annotation and provenance of data to provide contextual enrichment. | Building on the LLaMA 70B model, the French Government created LLaMandement, a refined large language model for the analysis and drafting of legal project summaries. They used data from SIGNALE, the French government''s legislative platform. |
| Inference and Insight Generation | Extracting information and patterns from open data using a trained generative AI model. | High quality, complete and consistent tabular data. | Descriptive metadata on the data collection methods, source information and version control. | Wobby is a generative interface that accepts natural language queries and produces answers in the form of summaries and visualisations, using datasets from different offices such as Eurostat or the World Bank. |
| Data Augmentation | Leveraging open data to generate synthetic data or provide ontologies to extend the amount of training data. | Tabular and/or unstructured data which is a close representation of reality, ensuring compliance with ethical considerations. | Transparency about the generation process and possible biases. | A team of researchers adapted the US Synthea model to include demographic and hospital data from Australia. Using this model, the team was able to generate approximately 117,000 region-specific synthetic medical records. |
| Open-Ended Exploration | Exploring and discovering new knowledge and patterns in open data through generative models. | Tabular data and/or unstructured, diverse and comprehensive. | Clear information on sources and copyright, understanding of possible biases and limitations, identification of entities. | NEPAccess is a pilot to unlock access to data related to the US National Environmental Policy Act (NEPA) through a generative AI model. It will include functions for drafting environmental impact assessments, data analysis, etc. |
Figure 2. Five scenarios where open data and Artificial Intelligence converge, adapted from the report “A Fourth Wave of Open Data? Exploring the Spectrum of Scenarios for Open Data and Generative AI”, The Govlab, 2024.
You can read the details of these scenarios in the report, where more examples are explained. In addition, The Govlab has also launched an observatory where it collects examples of intersections between open data and generative artificial intelligence. It includes the examples in the report along with additional examples. Any user can propose new examples via this form. These examples will be used to further study the field and improve the scenarios currently defined.
Among the cases that can be seen on the web, we find a Spanish company: Tendios. This is a software-as-a-service company that has developed a chatbot to assist in the analysis of public tenders and bids in order to facilitate competition. This tool is trained on public documents from government tenders.
Recommendations for data publishers
To extract the full potential of generative AI, improving its efficiency and effectiveness, the report highlights that open data providers need to address a number of challenges, such as improving data governance and management. In this regard, they contain five recommendations:
- Improve transparency and documentation. Through the use of standards, data dictionaries, vocabularies, metadata templates, etc. It will help to implement documentation practices on lineage, quality, ethical considerations and impact of results.
- Maintaining quality and integrity. Training and routine quality assurance processes are needed, including automated or manual validation, as well as tools to update datasets quickly when necessary. In addition, mechanisms for reporting and addressing data-related issues that may arise are needed to foster transparency and facilitate the creation of a community around open datasets.
- Promote interoperability and standards. It involves adopting and promoting international data standards, with a special focus on synthetic data and AI-generated content.
- Improve accessibility and user-friendliness. It involves the enhancement of open data portals through intelligent search algorithms and interactive tools. It is also essential to establish a shared space where data publishers and users can exchange views and express needs in order to match supply and demand.
- Addressing ethical considerations. Protecting data subjects is a top priority when talking about open data and generative AI. Comprehensive ethics committees and ethical guidelines are needed around the collection, sharing and use of open data, as well as advanced privacy-preserving technologies.
This is an evolving field that needs constant updating by data publishers. These must provide technically and ethically adequate datasets for generative AI systems to reach their full potential.
Documentación
Before performing data analysis, for statistical or predictive purposes, for example through machine learning techniques, it is necessary to understand the raw material with which we are going to work. It is necessary to understand and evaluate the quality of the data in order to, among other aspects, detect and treat atypical or incorrect data, avoiding possible errors that could have an impact on the results of the analysis.
One way to carry out this pre-processing is through exploratory data analysis (EDA).
What is exploratory data analysis?
EDA consists of applying a set of statistical techniques aimed at exploring, describing and summarising the nature of the data, in such a way that we can guarantee its objectivity and interoperability.
This allows us to identify possible errors, reveal the presence of outliers, check the relationship between variables (correlations) and their possible redundancy, and perform a descriptive analysis of the data by means of graphical representations and summaries of the most significant aspects.
On many occasions, this exploration of the data is neglected and is not carried out correctly. For this reason, at datos.gob.es we have prepared an introductory guide that includes a series of minimum tasks to carry out a correct exploratory data analysis, a prior and necessary step before carrying out any type of statistical or predictive analysis linked to machine learning techniques.
What does the guide include?
The guide explains in a simple way the steps to be taken to ensure consistent and accurate data. It is based on the exploratory data analysis described in the freely available book R for Data Science by Wickman and Grolemund (2017). These steps are:
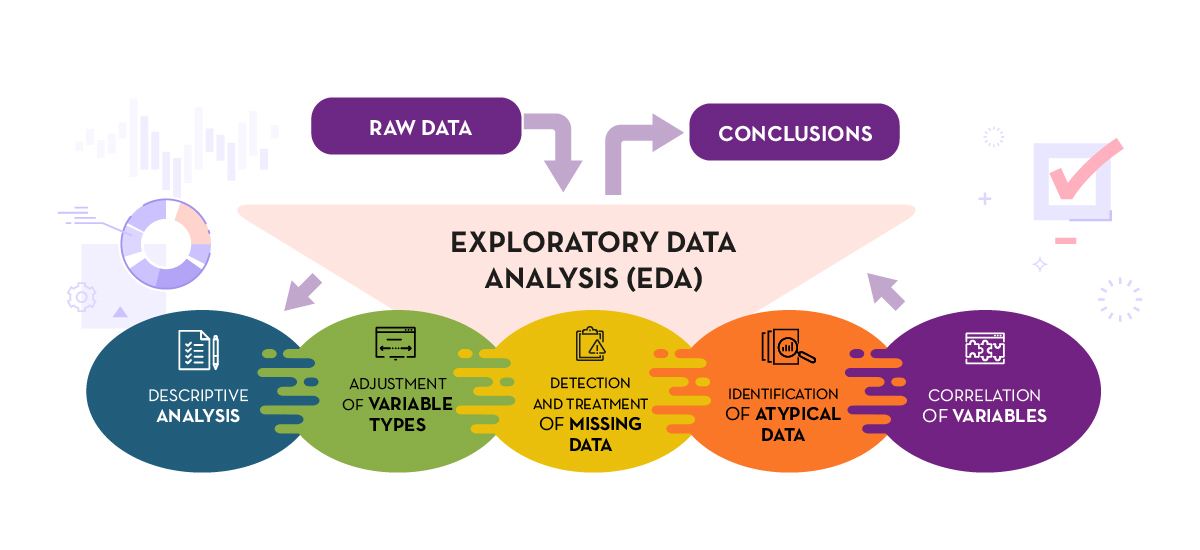
Figure 1. Phases of exploratory data analysis. Source: own elaboration.
The guide explains each of these steps and why they are necessary. They are also illustrated in a practical way through an example. For this case study, we have used the dataset relating to the air quality register in the Autonomous Community of Castilla y León included in our open data catalogue. The processing has been carried out with Open Source and free technological tools. The guide includes the code so that users can replicate it in a self-taught way following the indicated steps.
The guide ends with a section of additional resources for those who want to further explore the subject.
Who is the target audience?
The target audience of the guide is users who reuse open data. In other words, developers, entrepreneurs or even data journalists who want to extract as much value as possible from the information they work with in order to obtain reliable results.
It is advisable that the user has a basic knowledge of the R programming language, chosen to illustrate the examples. However, the bibliography section includes resources for acquiring greater skills in this field.
Below, in the documentation section, you can download the guide, as well as an infographic-summary that illustrates the main steps of exploratory data analysis. The source code of the practical example is also available in our Github.
Click to see the full infographic, in accessible version
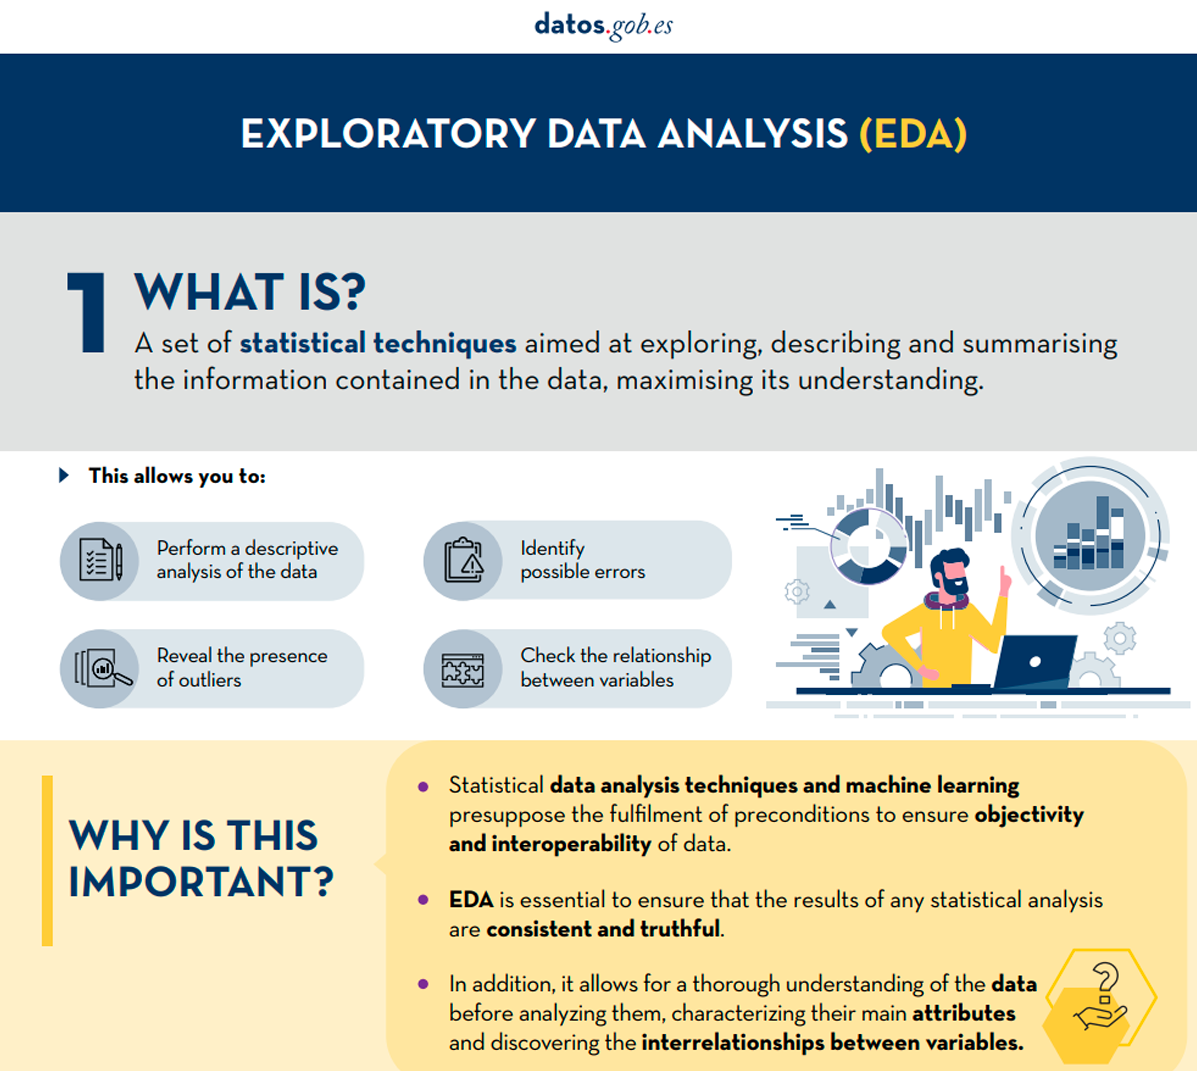
Figure 2. Capture of the infographic. Source: own elaboration.
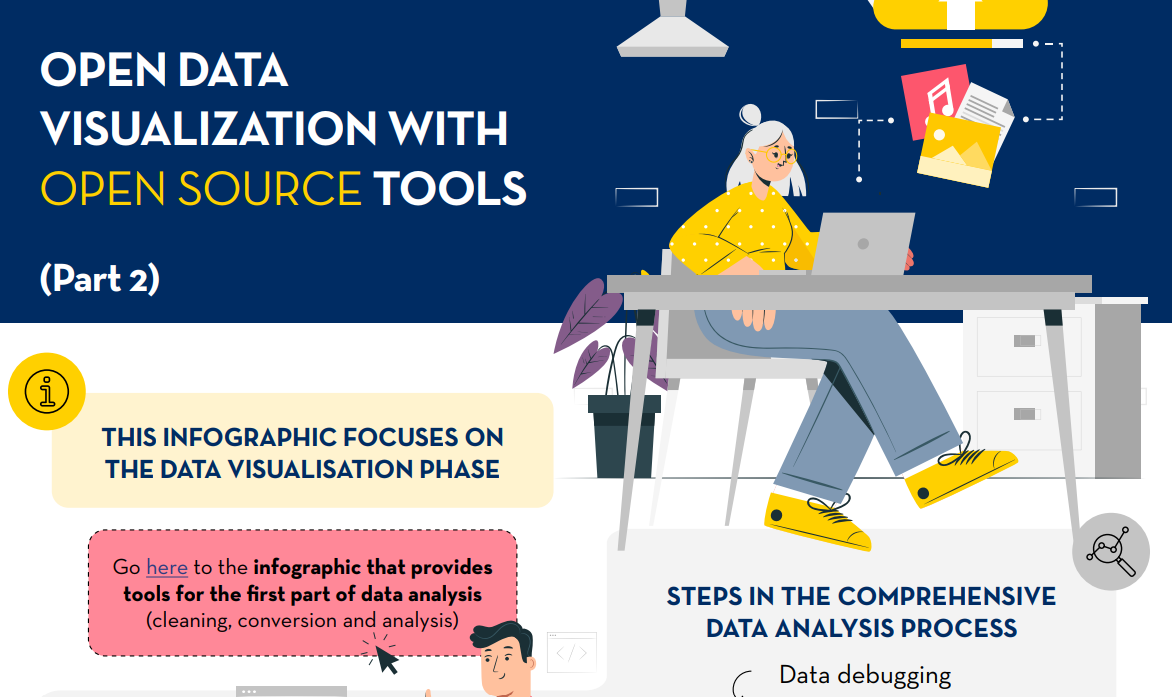
Open data visualization with open source tools (infographic part 2)
Documentación
1. Introduction
Visualizations are graphical representations of data that allow for the simple and effective communication of information linked to them. The possibilities for visualization are very broad, from basic representations such as line graphs, bar charts or relevant metrics, to visualizations configured on interactive dashboards.
In this section "Visualizations step by step" we are periodically presenting practical exercises using open data available on datos.gob.es or other similar catalogs. In them, the necessary steps to obtain the data, perform the transformations and relevant analyses to, finally obtain conclusions as a summary of said information, are addressed and described in a simple way.
Each practical exercise uses documented code developments and free-to-use tools. All generated material is available for reuse in the GitHub repository of datos.gob.es.
In this specific exercise, we will explore tourist flows at a national level, creating visualizations of tourists moving between autonomous communities (CCAA) and provinces.
Access the data laboratory repository on Github.
Execute the data pre-processing code on Google Colab.
In this video, the author explains what you will find on both Github and Google Colab.
2. Context
Analyzing national tourist flows allows us to observe certain well-known movements, such as, for example, that the province of Alicante is a very popular summer tourism destination. In addition, this analysis is interesting for observing trends in the economic impact that tourism may have, year after year, in certain CCAA or provinces. The article on experiences for the management of visitor flows in tourist destinations illustrates the impact of data in the sector.
3. Objective
The main objective of the exercise is to create interactive visualizations in Python that allow visualizing complex information in a comprehensive and attractive way. This objective will be met using an open dataset that contains information on national tourist flows, posing several questions about the data and answering them graphically. We will be able to answer questions such as those posed below:
- In which CCAA is there more tourism from the same CA?
- Which CA is the one that leaves its own CA the most?
- What differences are there between tourist flows throughout the year?
- Which Valencian province receives the most tourists?
The understanding of the proposed tools will provide the reader with the ability to modify the code contained in the notebook that accompanies this exercise to continue exploring the data on their own and detect more interesting behaviors from the dataset used.
In order to create interactive visualizations and answer questions about tourist flows, a data cleaning and reformatting process will be necessary, which is described in the notebook that accompanies this exercise.
4. Resources
Dataset
The open dataset used contains information on tourist flows in Spain at the CCAA and provincial level, also indicating the total values at the national level. The dataset has been published by the National Institute of Statistics, through various types of files. For this exercise we only use the .csv file separated by ";". The data dates from July 2019 to March 2024 (at the time of writing this exercise) and is updated monthly.
Number of tourists by CCAA and destination province disaggregated by PROVINCE of origin
The dataset is also available for download in this Github repository.
Analytical tools
The Python programming language has been used for data cleaning and visualization creation. The code created for this exercise is made available to the reader through a Google Colab notebook.
The Python libraries we will use to carry out the exercise are:
- pandas: is a library used for data analysis and manipulation.
- holoviews: is a library that allows creating interactive visualizations, combining the functionalities of other libraries such as Bokeh and Matplotlib.
5. Exercise development
To interactively visualize data on tourist flows, we will create two types of diagrams: chord diagrams and Sankey diagrams.
Chord diagrams are a type of diagram composed of nodes and edges, see Figure 1. The nodes are located in a circle and the edges symbolize the relationships between the nodes of the circle. These diagrams are usually used to show types of flows, for example, migratory or monetary flows. The different volume of the edges is visualized in a comprehensible way and reflects the importance of a flow or a node. Due to its circular shape, the chord diagram is a good option to visualize the relationships between all the nodes in our analysis (many-to-many type relationship).
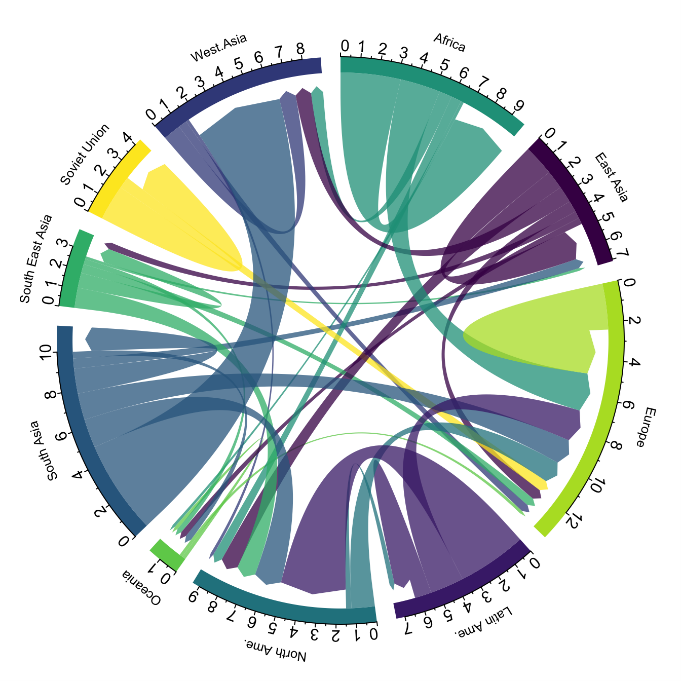
Figure 1. Chord Diagram (Global Migration). Source.
Sankey diagrams, like chord diagrams, are a type of diagram composed of nodes and edges, see Figure 2. The nodes are represented at the margins of the visualization, with the edges between the margins. Due to this linear grouping of nodes, Sankey diagrams are better than chord diagrams for analyses in which we want to visualize the relationship between:
- several nodes and other nodes (many-to-many, or many-to-few, or vice versa)
- several nodes and a single node (many-to-one, or vice versa)

Figure 2. Sankey Diagram (UK Internal Migration). Source.
The exercise is divided into 5 parts, with part 0 ("initial configuration") only setting up the programming environment. Below, we describe the five parts and the steps carried out.
5.1. Load data
This section can be found in point 1 of the notebook.
In this part, we load the dataset to process it in the notebook. We check the format of the loaded data and create a pandas.DataFrame that we will use for data processing in the following steps.
5.2. Initial data exploration
This section can be found in point 2 of the notebook.
In this part, we perform an exploratory data analysis to understand the format of the dataset we have loaded and to have a clearer idea of the information it contains. Through this initial exploration, we can define the cleaning steps we need to carry out to create interactive visualizations.
If you want to learn more about how to approach this task, you have at your disposal this introductory guide to exploratory data analysis.
5.3. Data format analysis
This section can be found in point 3 of the notebook.
In this part, we summarize the observations we have been able to make during the initial data exploration. We recapitulate the most important observations here:
| Province of origin | Province of origin | CCAA and destination province | CCAA and destination province | CCAA and destination province | Tourist concept | Period | Total |
|---|---|---|---|---|---|---|---|
| National Total | National Total | Tourists | 2024M03 | 13.731.096 | |||
| National Total | Ourense | National Total | Andalucía | Almería | Tourists | 2024M03 | 373 |
Figure 3. Fragment of the original dataset.
We can observe in columns one to four that the origins of tourist flows are disaggregated by province, while for destinations, provinces are aggregated by CCAA. We will take advantage of the mapping of CCAA and their provinces that we can extract from the fourth and fifth columns to aggregate the origin provinces by CCAA.
We can also see that the information contained in the first column is sometimes superfluous, so we will combine it with the second column. In addition, we have found that the fifth and sixth columns do not add value to our analysis, so we will remove them. We will rename some columns to have a more comprehensible pandas.DataFrame.
5.4. Data cleaning
This section can be found in point 4 of the notebook.
In this part, we carry out the necessary steps to better format our data. For this, we take advantage of several functionalities that pandas offers us, for example, to rename the columns. We also define a reusable function that we need to concatenate the values of the first and second columns with the aim of not having a column that exclusively indicates "National Total" in all rows of the pandas.DataFrame. In addition, we will extract from the destination columns a mapping of CCAA to provinces that we will apply to the origin columns.
We want to obtain a more compressed version of the dataset with greater transparency of the column names and that does not contain information that we are not going to process. The final result of the data cleaning process is the following:
| Origin | Province of origin | Destination | Province of destination | Period | Total |
|---|---|---|---|---|---|
| National Total | National Total | 2024M03 | 13731096.0 | ||
| Galicia | Ourense | Andalucía | Almería | 2024M03 | 373.0 |
Figure 4. Fragment of the clean dataset.
5.5. Create visualizations
This section can be found in point 5 of the notebook
In this part, we create our interactive visualizations using the Holoviews library. In order to draw chord or Sankey graphs that visualize the flow of people between CCAA and CCAA and/or provinces, we have to structure the information of our data in such a way that we have nodes and edges. In our case, the nodes are the names of CCAA or province and the edges, that is, the relationship between the nodes, are the number of tourists. In the notebook we define a function to obtain the nodes and edges that we can reuse for the different diagrams we want to make, changing the time period according to the season of the year we are interested in analyzing.
We will first create a chord diagram using exclusively data on tourist flows from March 2024. In the notebook, this chord diagram is dynamic. We encourage you to try its interactivity.
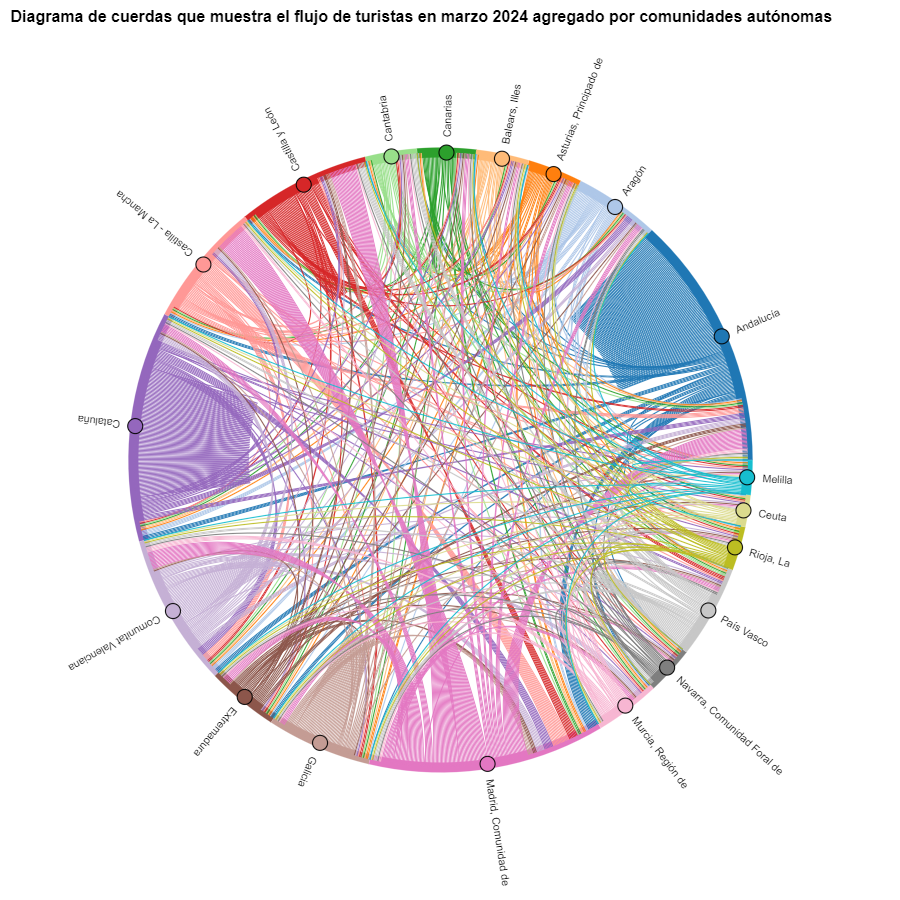
Figure 5. Chord diagram showing the flow of tourists in March 2024 aggregated by autonomous communities.
The chord diagram visualizes the flow of tourists between all CCAA. Each CA has a color and the movements made by tourists from this CA are symbolized with the same color. We can observe that tourists from Andalucía and Catalonia travel a lot within their own CCAA. On the other hand, tourists from Madrid leave their own CA a lot.
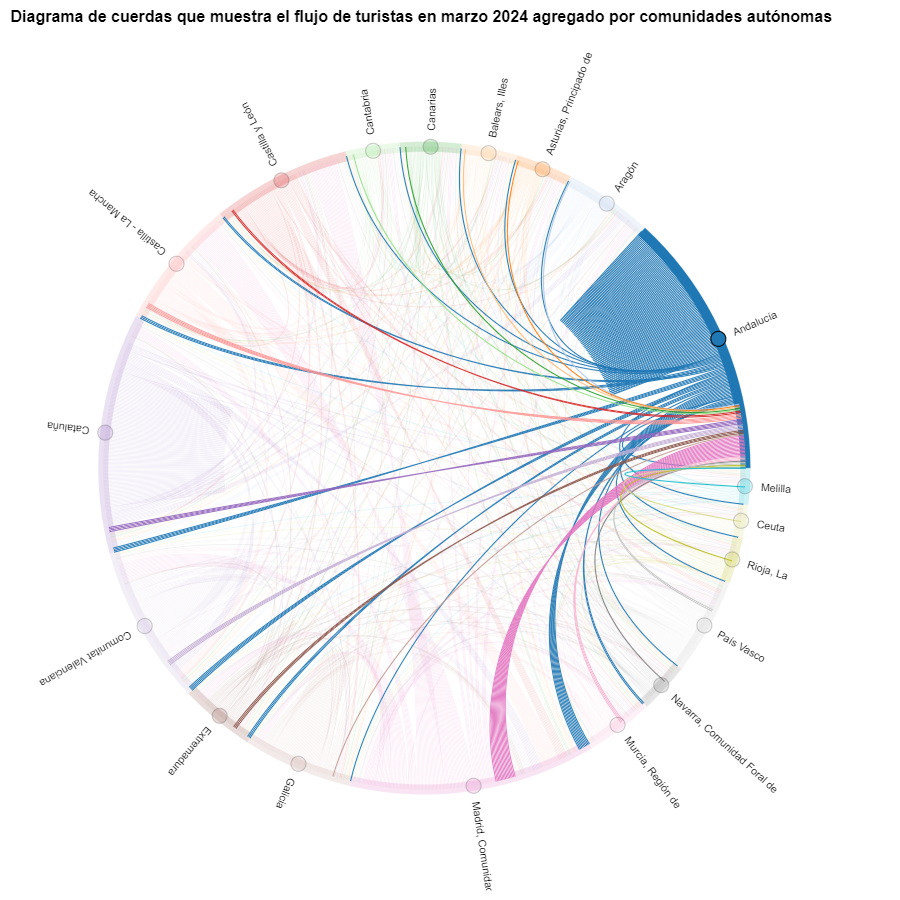
Figure 6. Chord diagram showing the flow of tourists entering and leaving Andalucía in March 2024 aggregated by autonomous communities.
We create another chord diagram using the function we have created and visualize tourist flows in August 2023.
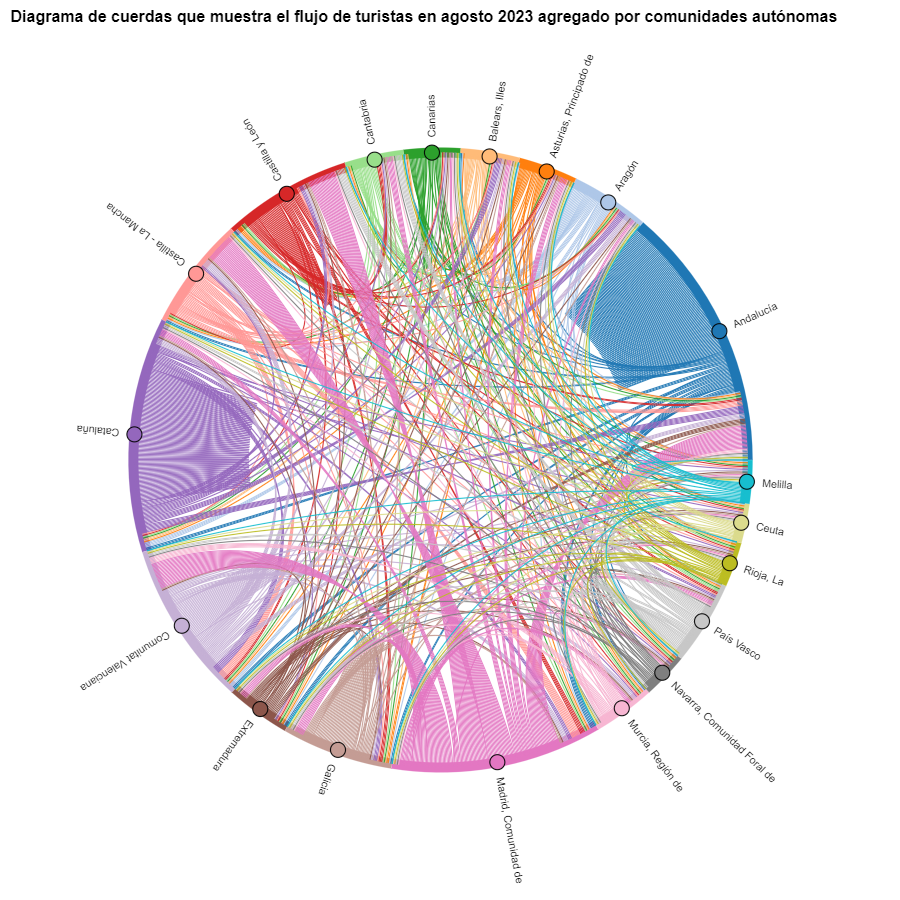
Figure 7. Chord diagram showing the flow of tourists in August 2023 aggregated by autonomous communities.
We can observe that, broadly speaking, tourist movements do not change, only that the movements we have already observed for March 2024 intensify.
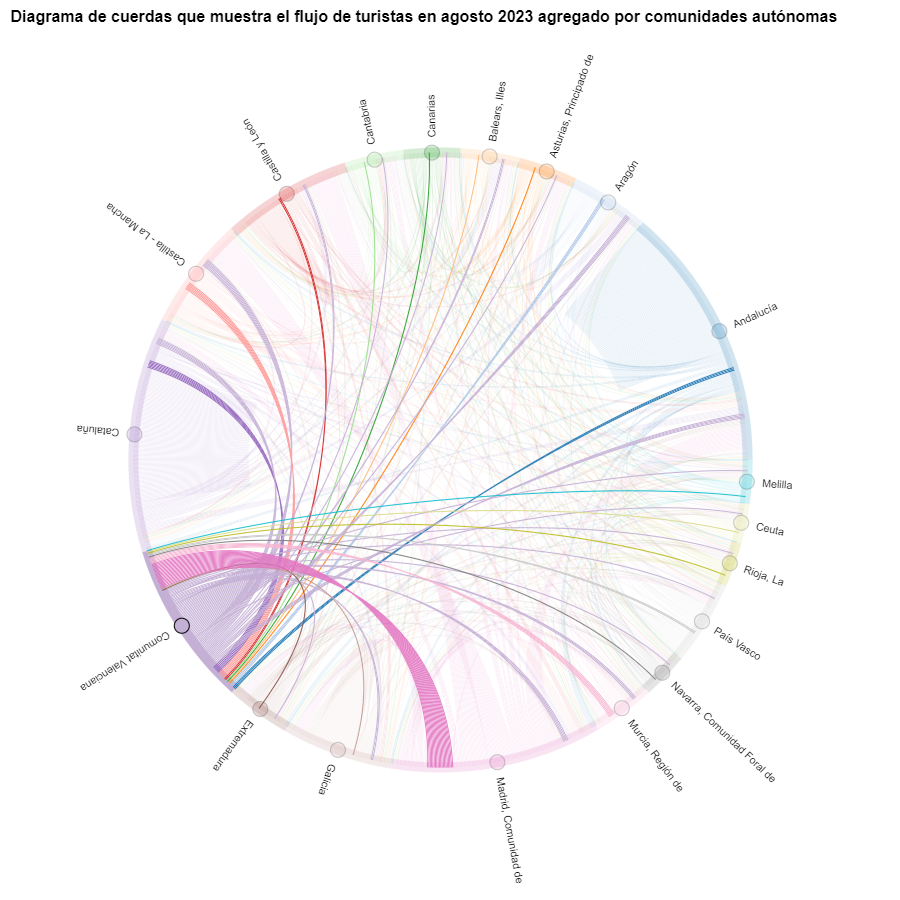
Figure 8. Chord diagram showing the flow of tourists entering and leaving the Valencian Community in August 2023 aggregated by autonomous communities.
The reader can create the same diagram for other time periods, for example, for the summer of 2020, in order to visualize the impact of the pandemic on summer tourism, reusing the function we have created.
For the Sankey diagrams, we will focus on the Valencian Community, as it is a popular holiday destination. We filter the edges we created for the previous chord diagram so that they only contain flows that end in the Valencian Community. The same procedure could be applied to study any other CA or could be inverted to analyze where Valencians go on vacation. We visualize the Sankey diagram which, like the chord diagrams, is interactive within the notebook. The visual aspect would be like this:
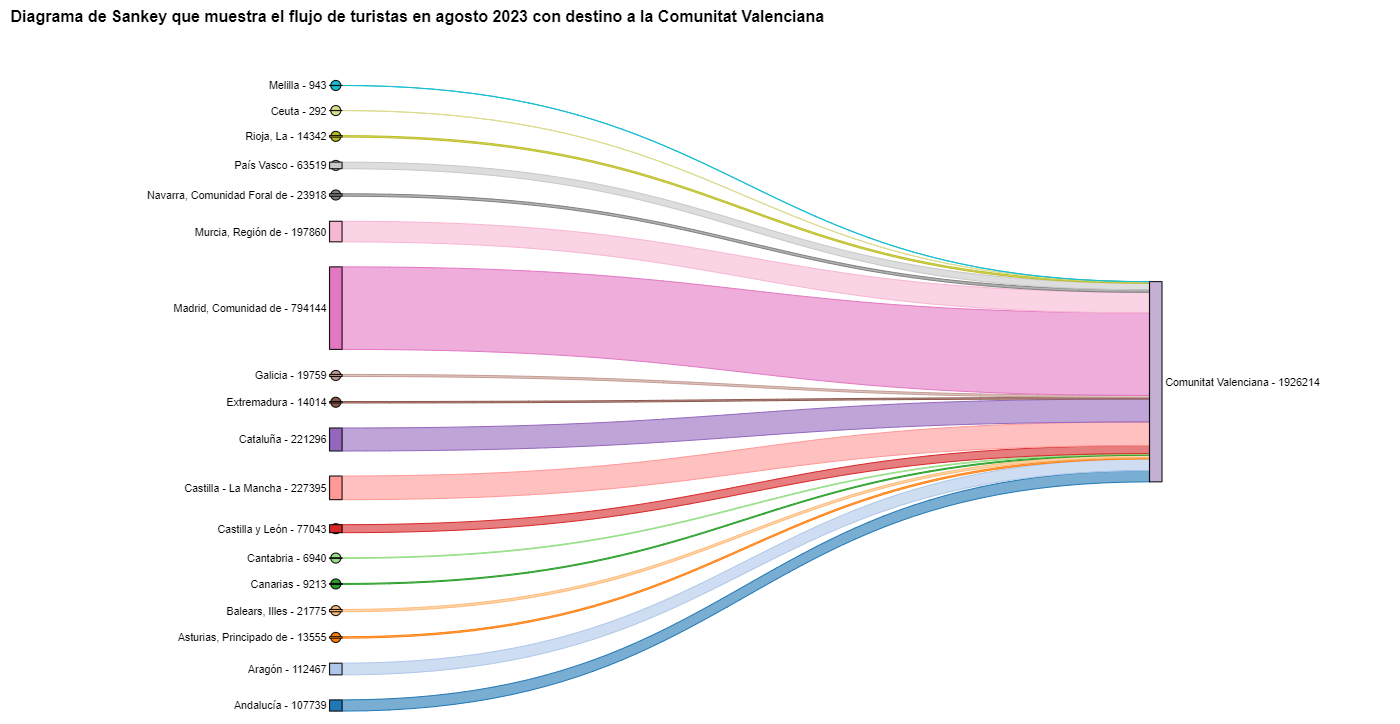
Figure 9. Sankey diagram showing the flow of tourists in August 2023 destined for the Valencian Community.
As we could already intuit from the chord diagram above, see Figure 8, the largest group of tourists arriving in the Valencian Community comes from Madrid. We also see that there is a high number of tourists visiting the Valencian Community from neighboring CCAA such as Murcia, Andalucía, and Catalonia.
To verify that these trends occur in the three provinces of the Valencian Community, we are going to create a Sankey diagram that shows on the left margin all the CCAA and on the right margin the three provinces of the Valencian Community.
To create this Sankey diagram at the provincial level, we have to filter our initial pandas.DataFrame to extract the relevant information from it. The steps in the notebook can be adapted to perform this analysis at the provincial level for any other CA. Although we are not reusing the function we used previously, we can also change the analysis period.
The Sankey diagram that visualizes the tourist flows that arrived in August 2023 to the three Valencian provinces would look like this:
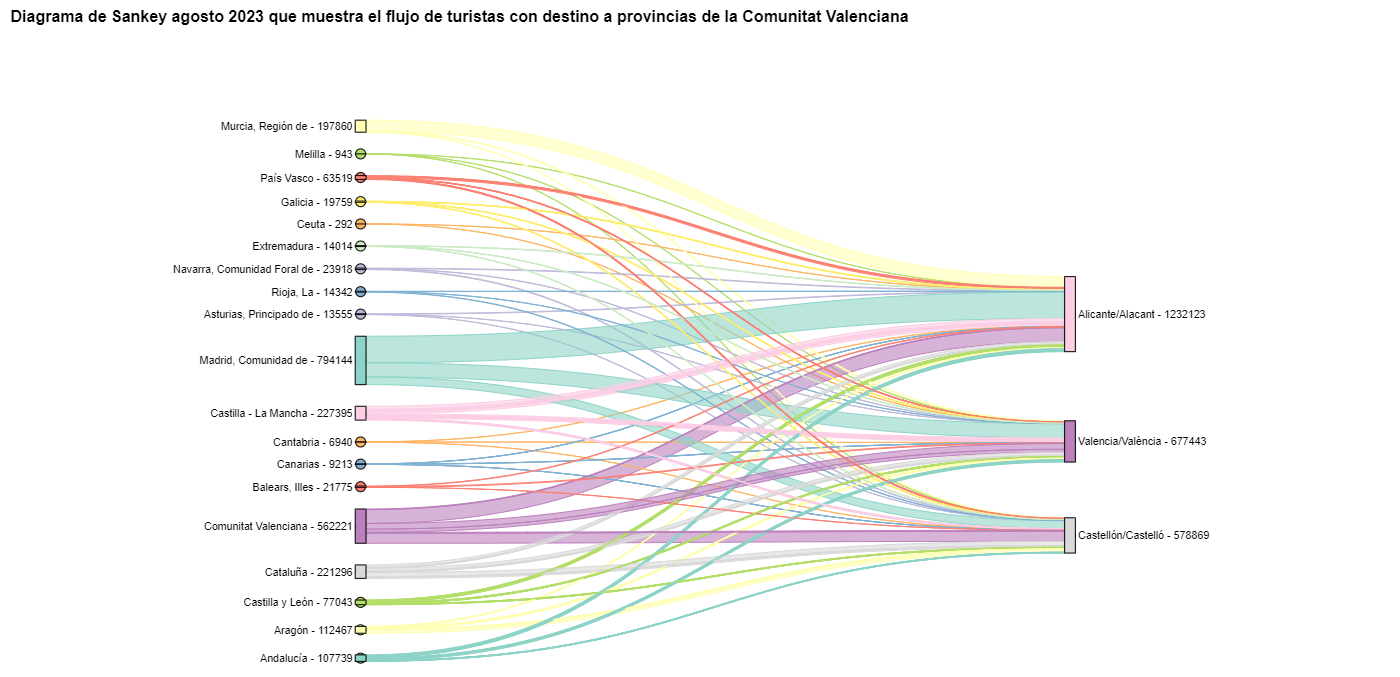
Figure 10. Sankey diagram August 2023 showing the flow of tourists destined for provinces of the Valencian Community.
We can observe that, as we already assumed, the largest number of tourists arriving in the Valencian Community in August comes from the Community of Madrid. However, we can verify that this is not true for the province of Castellón, where in August 2023 the majority of tourists were Valencians who traveled within their own CA.
6. Conclusions of the exercise
Thanks to the visualization techniques used in this exercise, we have been able to observe the tourist flows that move within the national territory, focusing on making comparisons between different times of the year and trying to identify patterns. In both the chord diagrams and the Sankey diagrams that we have created, we have been able to observe the influx of Madrilenian tourists on the Valencian coasts in summer. We have also been able to identify the autonomous communities where tourists leave their own autonomous community the least, such as Catalonia and Andalucía.
7. Do you want to do the exercise?
We invite the reader to execute the code contained in the Google Colab notebook that accompanies this exercise to continue with the analysis of tourist flows. We leave here some ideas of possible questions and how they could be answered:
- The impact of the pandemic: we have already mentioned it briefly above, but an interesting question would be to measure the impact that the coronavirus pandemic has had on tourism. We can compare the data from previous years with 2020 and also analyze the following years to detect stabilization trends. Given that the function we have created allows easily changing the time period under analysis, we suggest you do this analysis on your own.
- Time intervals: it is also possible to modify the function we have been using in such a way that it not only allows selecting a specific time period, but also allows time intervals.
- Provincial level analysis: likewise, an advanced reader with Pandas can challenge themselves to create a Sankey diagram that visualizes which provinces the inhabitants of a certain region travel to, for example, Ourense. In order not to have too many destination provinces that could make the Sankey diagram illegible, only the 10 most visited could be visualized. To obtain the data to create this visualization, the reader would have to play with the filters they apply to the dataset and with the groupby method of pandas, being inspired by the already executed code.
We hope that this practical exercise has provided you with sufficient knowledge to develop your own visualizations. If you have any data science topic that you would like us to cover soon, do not hesitate to propose your interest through our contact channels.
In addition, remember that you have more exercises available in the section "Data science exercises".
Documentación
The digital revolution is transforming municipal services, driven by the increasing adoption of artificial intelligence (AI) technologies that also benefit from open data. These developments have the potential to redefine the way municipalities deliver services to their citizens, providing tools to improve efficiency, accessibility and sustainability. This report looks at success stories in the deployment of applications and platforms that seek to improve various aspects of life in municipalities, highlighting their potential to unlock more of the vast untapped potential of open data and associated artificial intelligence technologies.
The applications and platforms described in this report have a high potential for replicability in different municipal contexts, as they address common problems. Replication of these solutions can take place through collaboration between municipalities, companies and developers, as well as through the release and standardisation of open data.
Despite the benefits, the adoption of open data for municipal innovation also presents significant challenges. The quality, updating and standardisation of data published by local authorities, as well as interoperability between different platforms and systems, must be ensured. In addition, the open data culture needs to be reinforced among all actors involved, including citizens, developers, businesses and public administrations themselves.
The use cases analysed are divided into four sections. Each of these sections is described below and some examples of the solutions included in the report are shown.
Transport and Mobility
One of the most significant challenges in urban areas is transport and mobility management. Applications using open data have proven to be effective in improving these services. For example, applications such as Park4Dis make it easy to locate parking spaces for people with reduced mobility, using data from multiple municipalities and contributions from volunteers. CityMapper, which has gone global, on the other hand, offers optimised public transport routes in real time, integrating data from various transport modes to provide the most efficient route. These applications not only improve mobility, but also contribute to sustainability by reducing congestion and carbon emissions.
Environment and Sustainability
Growing awareness of sustainability has spurred the development of applications that promote environmentally friendly practices. CleanSpot, for example, facilitates the location of recycling points and the management of municipal waste. The application encourages citizen participation in cleaning and recycling, contributing to the reduction of the ecological footprint. Liight gamifies sustainable behaviour by rewarding users for actions such as recycling or using public transport. These applications not only improve environmental management, but also educate and motivate citizens to adopt more sustainable habits.
Optimisation of Basic Public Services
Urban service management platforms, such as Gestdropper, use open data to monitor and control urban infrastructure in real time. These tools enable more efficient management of resources such as street lighting, water networks and street furniture, optimising maintenance, incident response and reducing operating costs. Moreover, the deployment of appointment management systems, such as CitaME, helps to reduce waiting times and improve efficiency in customer service.
Citizen Services Aggregators
Applications that centralise public information and services, such as Badajoz Es Más and AppValencia, improve accessibility and communication between administrations and citizens. These platforms provide real-time data on public transport, cultural events, tourism and administrative procedures, making life in the municipality easier for residents and tourists alike. For example, integrating multiple services into a single application improves efficiency and reduces the need for unnecessary travel. These tools also support local economies by promoting cultural events and commercial services.
Conclusions
The use of open data and artificial intelligence technologies is transforming municipal management, improving the efficiency, accessibility and sustainability of public services. The success stories presented in this report describe how these tools can benefit both citizens and public administrations by making cities smarter, more inclusive and sustainable environments, and more responsive to the needs and well-being of their inhabitants and visitors.
Listen the podcast (only availible in spanish)
Noticia
It seems like only yesterday that we were finishing eating our grapes and welcoming the new year. However, six months have already passed, during which we have witnessed many new developments in the world, in Spain and also in the open data ecosystem.
Join us as we take a look back at some of the most newsworthy open data events that have taken place in our country so far this year.
New regulations to boost open data and its use
During the first weeks of 2024, some legislative advances were made in Europe, applicable in our country. On 11 January, the Data Act came into force, which aims to democratise access to data, stimulate innovation and ensure fair use across Europe's digital landscape. You can learn more about it in this infographic that reviews the most important aspects.
On the other hand, at the national level, we have seen how open data is gaining prominence and its promotion is increasingly taken into account in sectoral regulations. This is the case of the Sustainable Mobility Bill, which, among other issues, includes the promotion of open data for administrations, infrastructure managers and public and private operators.
This is a trend that we had already seen in the last days of 2023 with the validation of Royal Decree-Law 6/2023, of 19 December, approving urgent measures for the implementation of the Recovery, Transformation and Resilience Plan for the public service of justice, the civil service, local government and patronage. This Royal Decree-Law includes the general principle of data orientation and emphasises the publication of automatically actionable data in open data portals accessible to citizens. The government's Artificial Intelligence Strategy 2024 also includes references to data held by public bodies. Specifically, it establishes that a common governance model will be created for the data and documentary corpus of the General State Administration in such a way as to guarantee the standards of security, quality, interoperability and reuse of all the data available for the training of models.
In relation to governance, we saw another development at the end of 2023 that has been reflected in 2024: the adoption of the Standard Ordinance on Data Governance in the Local Entity, approved by the Spanish Federation of Municipalities and Provinces (FEMP in its Spanish acronym). Over the last few months, various local councils have incorporated and adapted this ordinance to their territory. This is the case of Zaragoza or Fuenlabrada.
News on data platforms
In this time, new platforms or tools have also materialised that make data available to citizens and businesses:
- The Government of Spain has created the National Access Point for Traffic and Mobility which includes data on the facilities with electric vehicle charging points, detailing the type of connector, format, charging mode, etc.
- The National Institute of Statistics (INE in its Spanish acronym) has launched a Panel of Environmental Indicators. With it, it will be possible to quantify compliance with environmental targets, such as the Green Deal. It has also created a specific section for high-value data.
- The Statistical Institute of the Balearic Islands (IBESTAT in its Spanish acronym) has revamped its web portal which has a specific section on open data.
- Open Data Euskadi has published a new API that facilitates the reuse of public procurement data from the Basque administration.
- MUFACE (General mutual society of civil servants of the State) has launched a space with historical and current data on choice of entity, health care, etc.
- Some of the local authorities that have launched new data portals include the Diputation of Málaga and the City Council of Lucena (Cordoba).
- The Museo del Prado has set up a virtual tour which allows you to tour the main collections in 360º. It also offers a selection of 89 works digitised in gigapixel.
- Researchers from the University of Seville have collaborated in the launch of the PEPAdb (Prehistoric Europe's Personal Adornment database), an online and accessible tool with data on elements of personal adornment in recent prehistory.
In addition, agreements have been signed to make further progress in opening up data and boosting re-use, demonstrating the commitment to open and interoperable data.
- The INE, the State Tax Administration Agency (AEAT in its Spanish acronym), the Social Security, the Bank of Spain and the State Public Employment Service (SEPE) have signed a agreement to facilitate joint access to databases for research of public interest.
- The councils of Castelldefels, El Prat de Llobregat and Esparreguera have joined the Municipal Territorial Information System (SITMUN) to share geographic information and have access to a transversal information system.
- The Universidad Rey Juan Carlos and ASEDIE, the Multisectorial Association of Information, have joined forces to create the Open Data Reuse Observatory which is born with the vision of catalysing progress and transparency in the infomediary field, highlighting the importance of the data-driven economy.
Boosting the re-use of data
Both the data published previously and those published as a result of this work allow for the development of products and services that bring valuable information to the public. Some recently created examples include:
- The government has launched a tool to track the implementation and impact of the Recovery, Transformation and Resilience Plan investments.
- Data on the network of ports, airports, railway terminals, roads and railway lines can be easily consulted with the this visualiser of the Ministry of Transport and Sustainable Mobility.
- The Barcelona Open Data Initiative has presented a new version of the portal DadesXViolènciaXDones a tool for analysing the impact of policies against male violence.
- Madrid City Council has shown how it measures the use of the Cuña Verde Park through data analysis and its GovTech programme.
- Furthermore, in the field of data journalism, we find many examples, such as this article from elDiario.es where one can visualise, neighbourhood by neighbourhood, the price of rent and access to housing according to income.
These data combined with artificial intelligence makes it possible to solve and advance social challenges, as the following examples show:
- The wildINTEL project, of the University of Huelva, in collaboration with the state agency Consejo Superior de Investigaciones Científicas (CSIC), aims to monitor wildlife in Europe. It combines citizen science and AI for effective biodiversity data collection and management.
- Experts at the International University of La Rioja have developed AymurAI, a project that promotes judicial transparency and gender equality through artificial intelligence, based on methodologies with a gender perspective and open data.
- Two researchers from Cantabria have created a model that makes it possible to predict climatic variables in real time and in high resolution by means of artificial intelligence.
On the other hand, to boost the re-use of open data, public bodies have launched competitions and initiatives that have facilitated the creation of new products and services. Examples from recent months include:
- The7th Castile and Leon open data competition.
- The University of Zaragoza's Pedro R. Muro-Medrano Awards.
- The València City Council awards for open data and data journalism projects.
New reports and resources linked to open data
Some of the reports on open data and its re-use published in the first half of the year include:
- The "ASEDIE Report: Data Economy in the infomediary field", now in its twelfth edition.
- The ASEDIE report "Geospatial data in the Ministry of Transport and Sustainable Mobility. Impact of the information co-produced by IGN and CNIG".
- The report "The reuse of open data in Spain" by the COTEC Foundation.
- The "Guide of Good Practices for Data Journalists" elaborated by the Observatori de Dades Obertes i Transparència of the Universitat Politècnica de València (UPV).
A large number of events have also been held, some of which can be viewed online and some of which have been chronicled and summarised:
- The "III National Meeting of Open Data (ENDA): Data to boost the tourism sector", organised by the Deputation of Castellón, the Deputation of Barcelona and the Government of Aragón.
- The round table "Building Tourism Intelligence: Data Sharing for Strategic Decisions in the Tourism Sector" organised by SEGITTUR (State Trading Company for the Management of Innovation and Tourism Technologies) as part of Fitur Know-how & Export.
- The session "Managing Water with Open Data" organised within the framework of the CafèAmbDades initiative of the Generalitat de Catalunya.
- The European Data Portal's workshop "How to use open data for your research", with the participation of the Universidad Politécnica de Madrid.
These are just a fe examples that illustrate the great activity that has taken place in the open data environment over the last six months. Do you know of any other examples? Leave us a comment or write to dinamizacion@datos.gob.es!
Documentación
1. Introduction
In the information age, artificial intelligence has proven to be an invaluable tool for a variety of applications. One of the most incredible manifestations of this technology is GPT (Generative Pre-trained Transformer), developed by OpenAI. GPT is a natural language model that can understand and generate text, providing coherent and contextually relevant responses. With the recent introduction of Chat GPT-4, the capabilities of this model have been further expanded, allowing for greater customisation and adaptability to different themes.
In this post, we will show you how to set up and customise a specialised critical minerals wizard using GPT-4 and open data sources. As we have shown in previous publications critical minerals are fundamental to numerous industries, including technology, energy and defence, due to their unique properties and strategic importance. However, information on these materials can be complex and scattered, making a specialised assistant particularly useful.
The aim of this post is to guide you step by step from the initial configuration to the implementation of a GPT wizard that can help you to solve doubts and provide valuable information about critical minerals in your day to day life. In addition, we will explore how to customise aspects of the assistant, such as the tone and style of responses, to perfectly suit your needs. At the end of this journey, you will have a powerful, customised tool that will transform the way you access and use critical open mineral information.
Access the data lab repository on Github.
2. Context
The transition to a sustainable future involves not only changes in energy sources, but also in the material resources we use. The success of sectors such as energy storage batteries, wind turbines, solar panels, electrolysers, drones, robots, data transmission networks, electronic devices or space satellites depends heavily on access to the raw materials critical to their development. We understand that a mineral is critical when the following factors are met:
- Its global reserves are scarce
- There are no alternative materials that can perform their function (their properties are unique or very unique)
- They are indispensable materials for key economic sectors of the future, and/or their supply chain is high risk
You can learn more about critical minerals in the post mentioned above.
3. Target
This exercise focuses on showing the reader how to customise a specialised GPT model for a specific use case. We will adopt a "learning-by-doing" approach, so that the reader can understand how to set up and adjust the model to solve a real and relevant problem, such as critical mineral expert advice. This hands-on approach not only improves understanding of language model customisation techniques, but also prepares readers to apply this knowledge to real-world problem solving, providing a rich learning experience directly applicable to their own projects.
The GPT assistant specialised in critical minerals will be designed to become an essential tool for professionals, researchers and students. Its main objective will be to facilitate access to accurate and up-to-date information on these materials, to support strategic decision-making and to promote education in this field. The following are the specific objectives we seek to achieve with this assistant:
- Provide accurate and up-to-date information:
- The assistant should provide detailed and accurate information on various critical minerals, including their composition, properties, industrial uses and availability.
- Keep up to date with the latest research and market trends in the field of critical minerals.
- Assist in decision-making:
- To provide data and analysis that can assist strategic decision making in industry and critical minerals research.
- Provide comparisons and evaluations of different minerals in terms of performance, cost and availability.
- Promote education and awareness of the issue:
- Act as an educational tool for students, researchers and practitioners, helping to improve their knowledge of critical minerals.
- Raise awareness of the importance of these materials and the challenges related to their supply and sustainability.
4. Resources
To configure and customise our GPT wizard specialising in critical minerals, it is essential to have a number of resources to facilitate implementation and ensure the accuracy and relevance of the model''s responses. In this section, we will detail the necessary resources that include both the technological tools and the sources of information that will be integrated into the assistant''s knowledge base.
Tools and Technologies
The key tools and technologies to develop this exercise are:
- OpenAI account: required to access the platform and use the GPT-4 model. In this post, we will use ChatGPT''s Plus subscription to show you how to create and publish a custom GPT. However, you can develop this exercise in a similar way by using a free OpenAI account and performing the same set of instructions through a standard ChatGPT conversation.
- Microsoft Excel: we have designed this exercise so that anyone without technical knowledge can work through it from start to finish. We will only use office tools such as Microsoft Excel to make some adjustments to the downloaded data.
In a complementary way, we will use another set of tools that will allow us to automate some actions without their use being strictly necessary:
- Google Colab: is a Python Notebooks environment that runs in the cloud, allowing users to write and run Python code directly in the browser. Google Colab is particularly useful for machine learning, data analysis and experimentation with language models, offering free access to powerful computational resources and facilitating collaboration and project sharing.
- Markmap: is a tool that visualises Markdown mind maps in real time. Users write ideas in Markdown and the tool renders them as an interactive mind map in the browser. Markmap is useful for project planning, note taking and organising complex information visually. It facilitates understanding and the exchange of ideas in teams and presentations.
Sources of information
- Raw Materials Information System (RMIS): raw materials information system maintained by the Joint Research Center of the European Union. It provides detailed and up-to-date data on the availability, production and consumption of raw materials in Europe.
- International Energy Agency (IEA) Catalogue of Reports and Data: the International Energy Agency (IEA) offers a comprehensive catalogue of energy-related reports and data, including statistics on production, consumption and reserves of energy and critical minerals.
- Mineral Database of the Spanish Geological and Mining Institute (BDMIN in its acronym in Spanish): contains detailed information on minerals and mineral deposits in Spain, useful to obtain specific data on the production and reserves of critical minerals in the country.
With these resources, you will be well equipped to develop a specialised GPT assistant that can provide accurate and relevant answers on critical minerals, facilitating informed decision-making in the field.
5. Development of the exercise
5.1. Building the knowledge base
For our specialised critical minerals GPT assistant to be truly useful and accurate, it is essential to build a solid and structured knowledge base. This knowledge base will be the set of data and information that the assistant will use to answer queries. The quality and relevance of this information will determine the effectiveness of the assistant in providing accurate and useful answers.
Search for Data Sources
We start with the collection of information sources that will feed our knowledge base. Not all sources of information are equally reliable. It is essential to assess the quality of the sources identified, ensuring that:
- Information is up to date: the relevance of data can change rapidly, especially in dynamic fields such as critical minerals.
- The source is reliable and recognised: it is necessary to use sources from recognised and respected academic and professional institutions.
- Data is complete and accessible: it is crucial that data is detailed and accessible for integration into our wizard.
In our case, we developed an online search in different platforms and information repositories trying to select information belonging to different recognised entities:
- Research centres and universities:
- They publish detailed studies and reports on the research and development of critical minerals.
- Example: RMIS of the Joint Research Center of the European Union.
- Governmental institutions and international organisations:
- These entities usually provide comprehensive and up-to-date data on the availability and use of critical minerals.
- Example: International Energy Agency (IEA).
- Specialised databases:
- They contain technical and specific data on deposits and production of critical minerals.
- Example: Minerals Database of the Spanish Geological and Mining Institute (BDMIN).
Selection and preparation of information
We will now focus on the selection and preparation of existing information from these sources to ensure that our GPT assistant can access accurate and useful data.
RMIS of the Joint Research Center of the European Union:
- Selected information:
We selected the report "Supply chain analysis and material demand forecast in strategic technologies and sectors in the EU - A foresight study". This is an analysis of the supply chain and demand for minerals in strategic technologies and sectors in the EU. It presents a detailed study of the supply chains of critical raw materials and forecasts the demand for minerals up to 2050.
- Necessary preparation:
The format of the document, PDF, allows the direct ingestion of the information by our assistant. However, as can be seen in Figure 1, there is a particularly relevant table on pages 238-240 which analyses, for each mineral, its supply risk, typology (strategic, critical or non-critical) and the key technologies that employ it. We therefore decided to extract this table into a structured format (CSV), so that we have two pieces of information that will become part of our knowledge base.

Figure 1: Table of minerals contained in the JRC PDF
To programmatically extract the data contained in this table and transform it into a more easily processable format, such as CSV(comma separated values), we will use a Python script that we can use through the platform Google Colab platform (Figure 2).

Figure 2: Script Python para la extracción de datos del PDF de JRC desarrollado en plataforma Google Colab.
To summarise, this script:
- It is based on the open source library PyPDF2capable of interpreting information contained in PDF files.
- First, it extracts in text format (string) the content of the pages of the PDF where the mineral table is located, removing all the content that does not correspond to the table itself.
- It then goes through the string line by line, converting the values into columns of a data table. We will know that a mineral is used in a key technology if in the corresponding column of that mineral we find a number 1 (otherwise it will contain a 0).
- Finally, it exports the table to a CSV file for further use.
International Energy Agency (IEA):
- Selected information:
We selected the report "Global Critical Minerals Outlook 2024". It provides an overview of industrial developments in 2023 and early 2024, and offers medium- and long-term prospects for the demand and supply of key minerals for the energy transition. It also assesses risks to the reliability, sustainability and diversity of critical mineral supply chains.
- Necessary preparation:
The format of the document, PDF, allows us to ingest the information directly by our virtual assistant. In this case, we will not make any adjustments to the selected information.
Spanish Geological and Mining Institute''s Minerals Database (BDMIN)
- Selected information:
In this case, we use the form to select the existing data in this database for indications and deposits in the field of metallogeny, in particular those with lithium content.
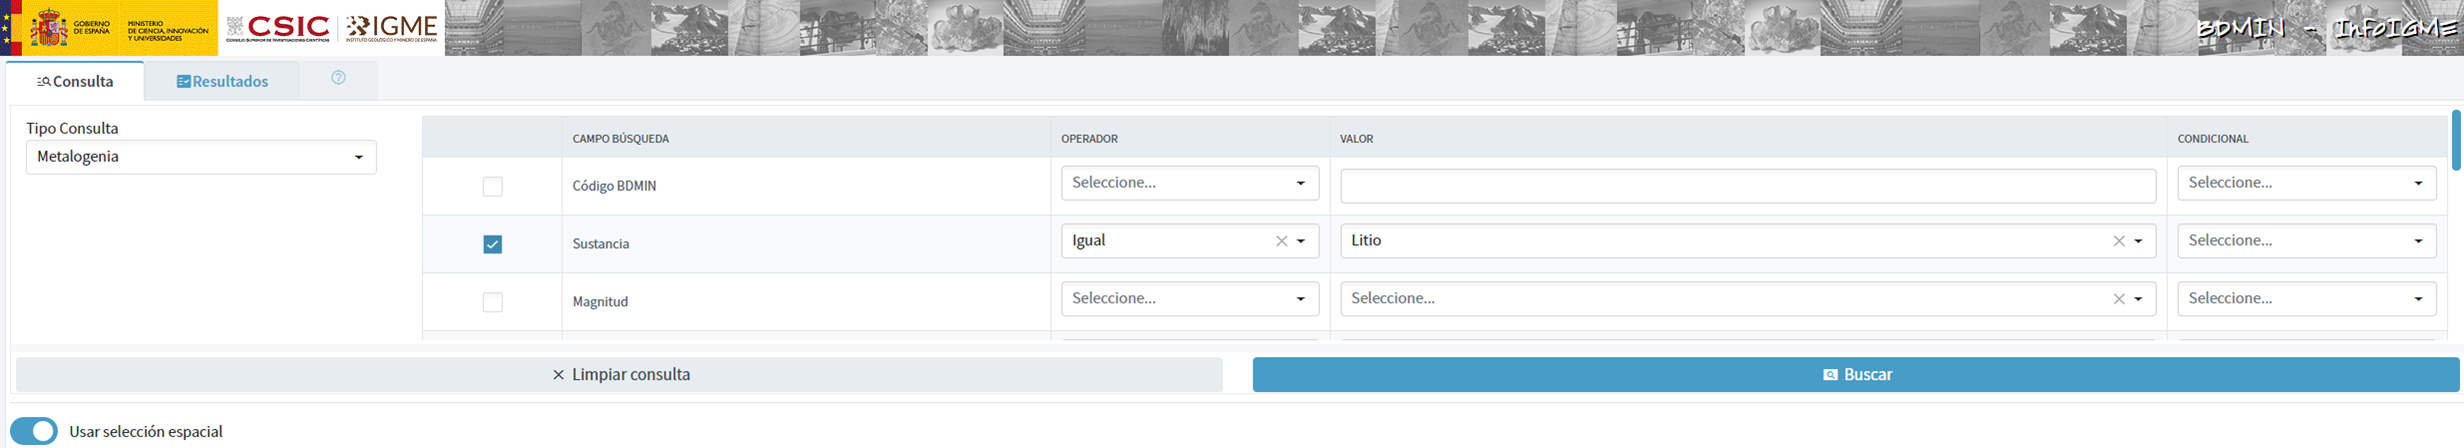
Figure 3: Dataset selection in BDMIN.
- Necessary preparation:
We note how the web tool allows online visualisation and also the export of this data in various formats. Select all the data to be exported and click on this option to download an Excel file with the desired information.

Figure 4: Visualization and download tool in BDMIN

Figure 5: BDMIN Downloaded Data.
All the files that make up our knowledge base can be found at GitHub, so that the reader can skip the downloading and preparation phase of the information.
5.2. GPT configuration and customisation for critical minerals
When we talk about "creating a GPT," we are actually referring to the configuration and customisation of a GPT (Generative Pre-trained Transformer) based language model to suit a specific use case. In this context, we are not creating the model from scratch, but adjusting how the pre-existing model (such as OpenAI''s GPT-4) interacts and responds within a specific domain, in this case, on critical minerals.
First of all, we access the application through our browser and, if we do not have an account, we follow the registration and login process on the ChatGPT platform. As mentioned above, in order to create a GPT step-by-step, you will need to have a Plus account. However, readers who do not have such an account can work with a free account by interacting with ChatGPT through a standard conversation.
Figure 6: ChatGPT login and registration page.
Once logged in, select the "Explore GPT" option, and then click on "Create" to begin the process of creating your GPT.

Figure 7: Creation of new GPT.
The screen will display the split screen for creating a new GPT: on the left, we will be able to talk to the system to indicate the characteristics that our GPT should have, while on the left we will be able to interact with our GPT to validate that its behaviour is adequate as we go through the configuration process.

Figure 8: Screen of creating new GPT.
In the GitHub of this project, we can find all the prompts or instructions that we will use to configure and customise our GPT and that we will have to introduce sequentially in the "Create" tab, located on the left tab of our screens, to complete the steps detailed below.
The steps we will follow for the creation of the GPT are as follows:
- First, we will outline the purpose and basic considerations for our GPT so that you can understand how to use it.
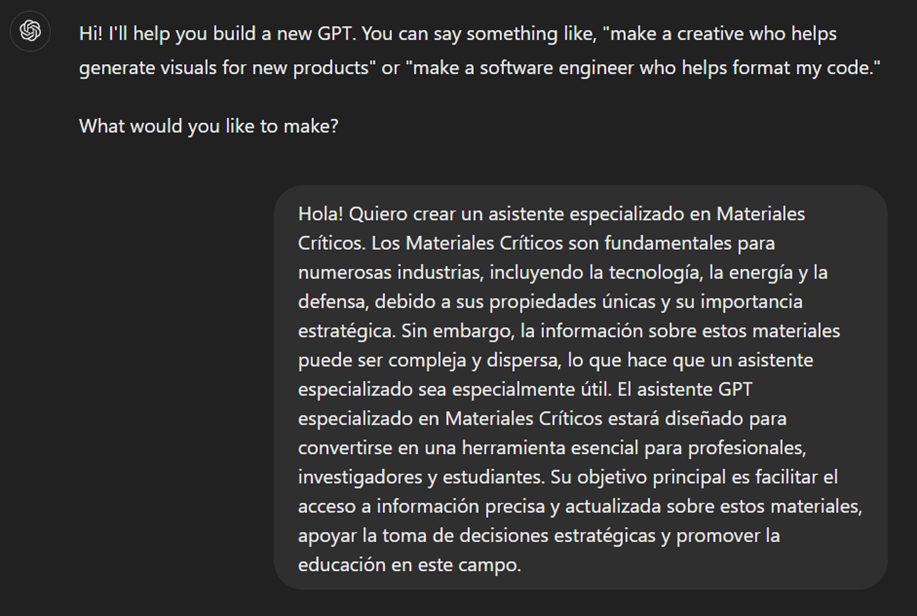
Figure 9: Basic instructions for new GPT.
2. We will then create a name and an image to represent our GPT and make it easily identifiable. In our case, we will call it MateriaGuru.

Figure 10: Name selection for new GPT.

Figure 11: Image creation for GPT.
3.We will then build the knowledge base from the information previously selected and prepared to feed the knowledge of our GPT.


Figure 12: Uploading of information to the new GPT knowledge base.
4. Now, we can customise conversational aspects such as their tone, the level of technical complexity of their response or whether we expect brief or elaborate answers.
5. Lastly, from the "Configure" tab, we can indicate the conversation starters desired so that users interacting with our GPT have some ideas to start the conversation in a predefined way.

Figure 13: Configure GPT tab.
In Figure 13 we can also see the final result of our training, where key elements such as their image, name, instructions, conversation starters or documents that are part of their knowledge base appear.
5.3. Validation and publication of GPT
Before we sign off our new GPT-based assistant, we will proceed with a brief validation of its correct configuration and learning with respect to the subject matter around which we have trained it. For this purpose, we prepared a battery of questions that we will ask MateriaGuru to check that it responds appropriately to a real scenario of use.
| # | Question | Answer |
|---|---|---|
| 1 | Which critical minerals have experienced a significant drop in prices in 2023? | Battery mineral prices saw particularly large drops with lithium prices falling by 75% and cobalt, nickel and graphite prices falling by between 30% and 45%. |
| 2 | What percentage of global solar photovoltaic (PV) capacity was added by China in 2023? | China accounted for 62% of the increase in global solar PV capacity in 2023. |
| 3 | What is the scenario that projects electric car (EV) sales to reach 65% by 2030? | The Net Zero Emissions (NZE) scenario for 2050 projects that electric car sales will reach 65% by 2030. |
| 4 | What was the growth in lithium demand in 2023? | Lithium demand increased by 30% in 2023. |
| 5 | Which country was the largest electric car market in 2023? | China was the largest electric car market in 2023 with 8.1 million electric car sales representing 60% of the global total. |
| 6 | What is the main risk associated with market concentration in the battery graphite supply chain? | More than 90% of battery-grade graphite and 77% of refined rare earths in 2030 originate in China, posing a significant risk to market concentration. |
| 7 | What proportion of global battery cell production capacity was in China in 2023? | China owned 85% of battery cell production capacity in 2023. |
| 8 | How much did investment in critical minerals mining increase in 2023? | Investment in critical minerals mining grew by 10% in 2023. |
| 9 | What percentage of battery storage capacity in 2023 was composed of lithium iron phosphate (LFP) batteries? | By 2023, LFP batteries would constitute approximately 80% of the total battery storage market. |
| 10 | What is the forecast for copper demand in a net zero emissions (NZE) scenario for 2040? | In the net zero emissions (NZE) scenario for 2040, copper demand is expected to have the largest increase in terms of production volume. |
Figure 14: Table with battery of questions for the validation of our GPT.
Using the preview section on the right-hand side of our screens, we launch the battery of questions and validate that the answers correspond to those expected.
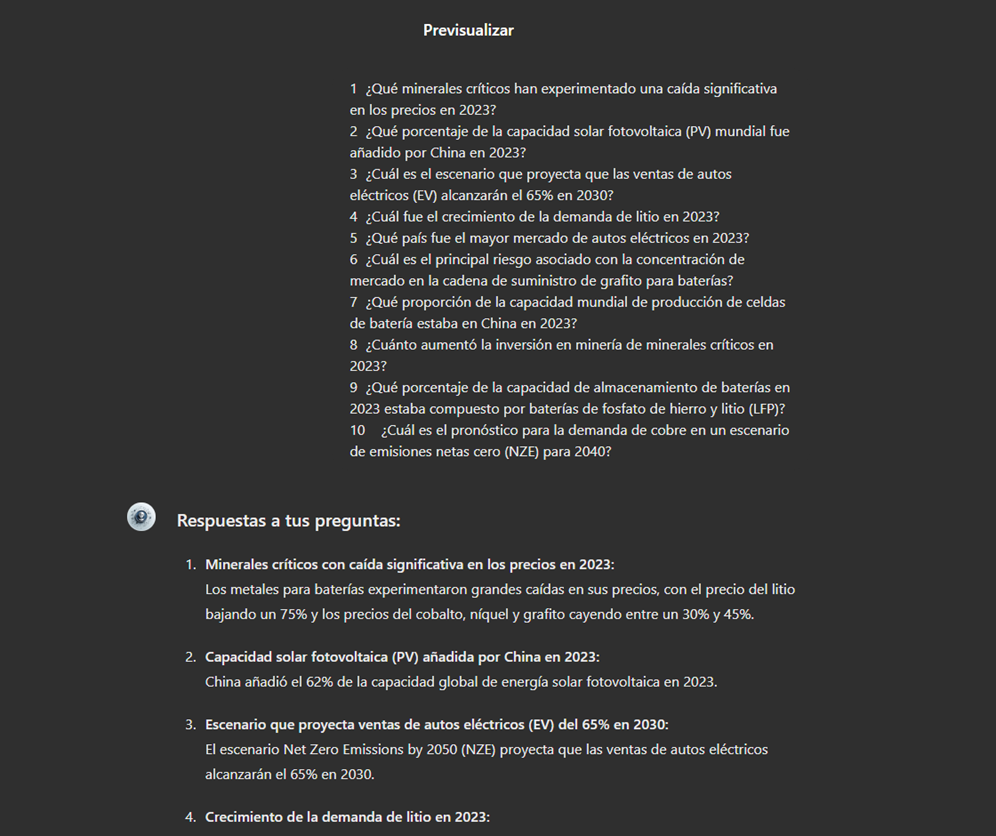
Figure 15: Validation of GPT responses.
Finally, click on the "Create" button to finalise the process. We will be able to select between different alternatives to restrict its use by other users.

Figure 16: Publication of our GPT.
6. Scenarios of use
In this section we show several scenarios in which we can take advantage of MateriaGuru in our daily life. On the GitHub of the project you can find the prompts used to replicate each of them.
6.1. Consultation of critical minerals information
The most typical scenario for the use of this type of GPTs is assistance in resolving doubts related to the topic in question, in this case, critical minerals. As an example, we have prepared a set of questions that the reader can pose to the GPT created to understand in more detail the relevance and current status of a critical material such as graphite from the reports provided to our GPT.

Figure 17: Resolution of critical mineral queries.
We can also ask you specific questions about the tabulated information provided on existing sites and evidence on Spanish territory.
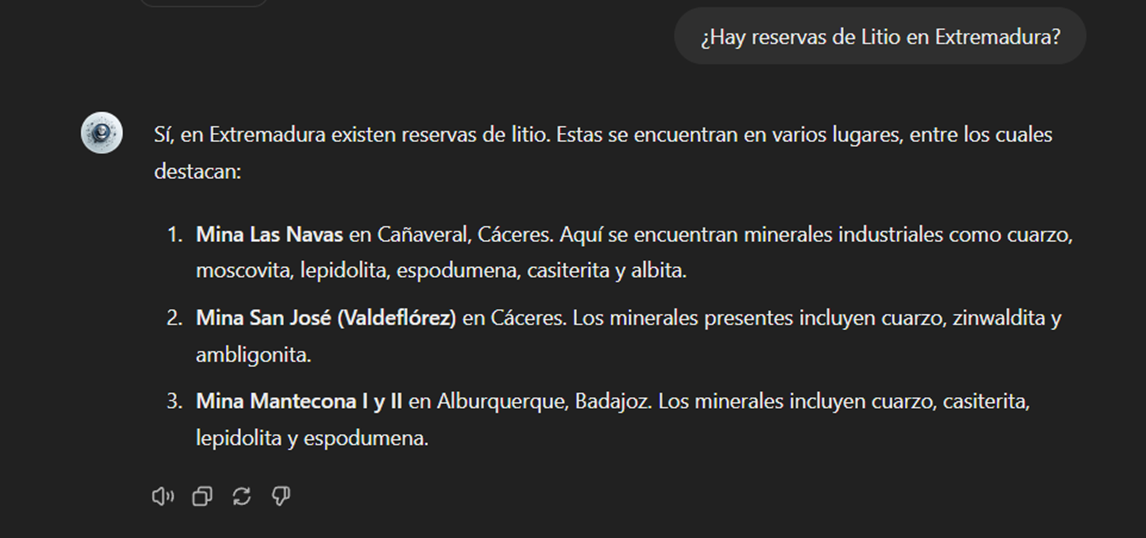
Figure 18: Lithium reserves in Extremadura.
6.2. Representation of quantitative data visualisations
Another common scenario is the need to consult quantitative information and make visual representations for better understanding. In this scenario, we can see how MateriaGuru is able to generate an interactive visualisation of graphite production in tonnes for the main producing countries.

Figure 19: Interactive visualisation generation with our GPT.
6.3. Generating mind maps to facilitate understanding
Finally, in line with the search for alternatives for a better access and understanding of the existing knowledge in our GPT, we will propose to MateriaGuru the construction of a mind map that allows us to understand in a visual way key concepts of critical minerals. For this purpose, we use the open Markmap notation (Markdown Mindmap), which allows us to define mind maps using markdown notation.

Figure 20: Generation of mind maps from our GPT
We will need to copy the generated code and enter it in a markmapviewer in order to generate the desired mind map. We facilitate here a version of this code generated by MateriaGuru.

Figure 21: Visualisation of mind maps.
7. Results and conclusions
In the exercise of building an expert assistant using GPT-4, we have succeeded in creating a specialised model for critical minerals. This wizard provides detailed and up-to-date information on critical minerals, supporting strategic decision making and promoting education in this field. We first gathered information from reliable sources such as the RMIS, the International Energy Agency (IEA), and the Spanish Geological and Mining Institute (BDMIN). We then process and structure the data appropriately for integration into the model. Validations showed that the wizard accurately answers domain-relevant questions, facilitating access to your information.
In this way, the development of the specialised critical minerals assistant has proven to be an effective solution for centralising and facilitating access to complex and dispersed information.
The use of tools such as Google Colab and Markmap has enabled better organisation and visualisation of data, increasing efficiency in knowledge management. This approach not only improves the understanding and use of critical mineral information, but also prepares users to apply this knowledge in real-world contexts.
The practical experience gained in this exercise is directly applicable to other projects that require customisation of language models for specific use cases.
8. Do you want to do the exercise?
If you want to replicate this exercise, access this this repository where you will find more information (the prompts used, the code generated by MateriaGuru, etc.)
Also, remember that you have at your disposal more exercises in the section "Step-by-step visualisations".
Content elaborated by Juan Benavente, industrial engineer and expert in technologies linked to the data economy. The contents and points of view reflected in this publication are the sole responsibility of the author.
Blog
The promotion of energy efficiency and sustainability is one of the priorities of the European Union and Spain, as reflected in the European Green Pact. The availability of open data related to energy production, distribution and consumption allows governments, businesses and citizens to access essential information to address the challenges of climate change and promote a more sustainable future.
In this post, we explore examples of use cases that show the impact of open data on the energy landscape, as well as sources of interest where to find quality data on the subject.
Open data use cases in the energy sector
EUR 79,600 million. This is the estimated annual savings from open data in the energy sector in the European Union, according to the report "The Economic Impact of Open Data: Opportunities for Value Creation in Europe (2020)". This is possible thanks to multiple projects and applications based on open data that affect various areas.
-
More efficient resource planning
Access to open data on available energy resources makes it possible to identify the most suitable areas to develop projects, ensuring that the use of available natural resources is maximised. For example, in the Baltic Sea, natural gas infrastructure is being expanded to meet the region's growing needs. By taking advantage of Copernicus' advanced data together with its own monitoring and forecasting services (including data on wind, waves, sea water level, currents, sea ice, etc.), the Estonian and Finnish governments were able to carry out more efficient planning for the installation of a new plant.
Likewise, the National Geographic Institute has made available to users a viewer to find out the incidence of the sun and determine the best location for solar panels. Thanks to this viewer, different locations and orientations can be analysed to identify the position that maximises solar energy collection.
-
More responsible and efficient consumption
Open data also includes information on the use and performance of different energies. The Junta de Castilla y León, for example, has a dataHub that collects information from more than 1,500 consumer centres. This dashboard allows the analysis by type of energy (electricity, gas, diesel) and by geographical location (educational centres, health centres, administrative offices, hospitals, etc.). This allows them to compare consumption between the buildings they manage and make efficiency decisions, which has resulted in savings of €2M per year since 2015 on the fixed cost of electricity alone.
The Urban3r viewer allows the visualisation of different indicators on the current state of the building, the energy demand data of residential buildings in their current state and after energy refurbishment, as well as the estimated costs of these interventions, facilitating decision making.
Commercial solutions are also available on the market for this purpose, such as Opower, a tool that uses artificial intelligence to provide personalised information to each customer, identifying and suggesting the replacement of inefficient heating and cooling systems. Another example is uplight, which performs energy efficiency analyses for commercial buildings, utilities and government entities with operational and retrofit recommendations to reduce consumption. These examples highlight the business opportunity in this niche market.
-
Possibility to choose cheaper suppliers
Open data provides detailed information on tariffs and prices of different energy suppliers. This transparency allows consumers to easily compare offers and choose the option that best suits their needs. This is the case of applications for choosing petrol stations, such as Mejorgasolinera.com or Precioil.es, which offer detailed information on the country's petrol stations and allow filtering by brand, location or road and sorted by price and distance. We also find similar solutions for the electricity market, such as Tarifaluzhora.
The National Commission for Markets and Competition (CNMC in Spanish) also has a Energy Offers Comparator (CNMC), which allows you to consult gas and electricity offers.
-
Transparency, accountability and harm minimisation
The publication of open data not only allows citizens and organisations to access detailed information on energy production, distribution and consumption. It also increases transparency in resource management and promotes accountability of energy companies and governments.
To this end, OpenOil was born, which aims to reduce the opacity of the oil industry and thereby increase the accountability of oil companies. It provides an open data framework for natural resource management at the supranational level, as well as consultancy and training services for the creation of natural resource management mechanisms and processes.
In order to minimise the impact of oil spills in the oceans, the Spanish National Research Council (CSIC), in collaboration with Digital Earth Solutions (DES), has developed a unique software, capable of predicting in a few minutes and with great precision the geographic evolution of any oil slick, forecasting its future trajectory in the ocean or studying its movement backwards in time to find its origin.
Where can I find energy data?
If you are thinking of developing such a solution, you are in luck, because there is a wealth of open energy data available on the web.
If you are looking for data from Spain, in addition to datos.gob.es, you can visit the following websites:
- Institute for Energy Diversification and Saving (IDAE). IDAE provides sectorised statistics and energy balances for both primary and final energy, in thousands of tonnes of oil equivalent (ktoe). In total, 69 energy types and 128 energy flows and/or sectors are detailed. The data currently available cover the historical series from 1990 to 2022.
- Red Eléctrica de España. REData is the website of Red eléctrica where we can find national statistical series related to the Spanish electricity system, updated month by month. In this space you can also access information on demand, generation, balancing, exchange, transmission and electricity markets, whose data are available through a REST API. Depending on the nature of the dataset, we can find data that are updated annually, quarterly or even daily. Another useful tool of Red Eléctrica is ESIOS, with updated data on generation, consumption, market, prices, etc.
- National Commission for Markets and Competition (CNMC): The CNMC Data open data portal provides direct access to data and indicators relating to the energy markets overseen by the CNMC: electricity, natural gas and oil products. We can find statistics on market prices, the number of users benefiting from the social bonus or the percentage of renewable energy in the total amount, among other values. Data are updated regularly, on a monthly, quarterly or annual basis.
A wealth of information is also available worldwide:
- European Union. On the EU's energy policy website, we find various data and analyses ranging from oil price developments in individual member states to possible energy market scenarios for 2030 and 2050, among many others. In addition, the European Commission's Directorate-General for Energy produces energy statistical fact sheets every two years, based on data from Eurostat and EU greenhouse gas monitoring. The data is broken down by country, which allows for easy comparisons. Also available is the ENSPRESO database, which focuses on the wind, solar and biomass sectors.
- International Energy Agency (IEA). IEA is an international organisation created in 1974 by the Organisation for Economic Co-operation and Development (OECD) to secure energy supplies. Although some of the datasets offered are paid for, open data can also be found on the website and can be downloaded upon registration.
- Other countries: At the international level, we can find detailed portals by country, such as the US Open Energy Data Initiative (OEDI) or the UK.
These are just a few examples of solutions and data sources that highlight the impact that opening up energy data can have on our environment, both in terms of cost savings and efficiency gains. We invite you to share other open data solutions and portals in comments.
Blog
The carbon footprint is a key indicator for understanding the environmental impact of our actions. It measures the amount of greenhouse gas emissions released into the atmosphere as a result of human activities, most notably the burning of fossil fuels such as oil, natural gas and coal. These gases, which include carbon dioxide (CO2), methane (CH4) and nitrous oxide (N2O), contribute to global warming by trapping heat in the earth's atmosphere.
Many actions are being carried out by different organisations to try to reduce the carbon footprint. These include those included in the European Green Pact or the Sustainable Development Goals. But this is an area where every small action counts and, as citizens, we can also contribute to this goal through small changes in our lifestyles.
Moreover, this is an area where open data can have a major impact. In particular, the report "The economic impact of open data: opportunities for value creation in Europe (2020)" highlights how open data has saved the equivalent of 5.8 million tonnes of oil every year in the European Union by promoting greener energy sources. This include 79.6 billion in cost savings on energy bills.
This article reviews some solutions that help us measure our carbon footprint to raise awareness of the situation, as well as useful open data sources .
Calculators to know your carbon footprint
The European Union has a web application where everyone can analyse the life cycle of products and energy consumed in five specific areas (food, mobility, housing, household appliances and household goods), based on 16 environmental impact indicators. The user enters certain data, such as his energy expenditure or the details of his vehicle, and the solution calculates the level of impact. The website also offers recommendations for improving consumption patterns. It was compiled using data from Ecoinvent y Agrifoot-print, as well as different public reports detailed in its methodology.
The UN also launched a similar solution, but with a focus on consumer goods. It allows the creation of product value chains by mapping the materials, processes and transports that have been used for their manufacture and distribution, using a combination of company-specific activity data and secondary data. The emission factors and datasets for materials and processes come from a combination of data sources such as Ecoinvent, the Swedish Environment Institute, DEFRA (UK Department for Environment, Food and Rural Affairs), academic papers, etc. The calculator is also linked to the the Platform for carbon footprint offsetting of the United Nations. This allows users of the application to take immediate climate action by contributing to UN green projects.
Looking at Spain, the Ministry for Ecological Transition and the Demographic Challenge has several tools to facilitate the calculation of the carbon footprint aimed at different audiences: organisations, municipalities and farms. They take into account both direct emissions and indirect emissions from electricity consumption. Among other data sources, it uses information from National Greenhouse Gas Inventory. It also provides an estimate of the carbon dioxide removals generated by an emission reduction project.
Another tool linked to this ministry is ComidaAPrueba, launched by the Fundación Vida Sostenible and aimed at finding out the sustainability of citizens' diets. The mobile application, available for both iOs and Android, allows us to calculate the environmental footprint of our meals to make us aware of the impact of our actions. It also proposes healthy recipes that help us to reduce food waste.
But not all actions of this kind are driven by public bodies or non-profit associations. The fight against the deterioration of our environment is also a niche market offering business opportunities. Private companies also offer solutions for calculating the carbon footprint, such as climate Hero, which is based on multiple data sources.
Data sources to feed carbon footprint calculators
As we have seen, in order to make these calculations, these solutions need to be based on data that allow them to calculate the relationship between certain consumption habits and the emissions generated. To do this, they draw on a variety of data sources, many of which are open. In Spain, for example, we find:
- National Statistics Institute (INE). The INE provides data on atmospheric emissions by branch of activity, as well as for households. It can be filtered by gas type and its equivalence in thousands of tonnes of CO2. It also provides data on the historical evolution of the achievement of carbon footprint reduction targets, which are based on the National Inventories of Emissions to the Atmosphere, prepared by the Ministry for Ecological Transition and the Demographic Challenge.
- Autonomous Communities. Several regional governments carry out inventories of pollutant emissions into the atmosphere. This is the case of the Basque Country and the Community of Madrid. Some regions also publish open forecast data, such as the Canary Islands, which provides projections of climate change in tourism or drought situations.
Other international data services to consider are:
- EarthData. This service provides full and open access to NASA' s collection of Earth science data to understand and protect our planet. This web provides links to commonly used data on greenhouse gases, including carbon dioxide, methane, nitrous oxide, ozone, chlorofluorocarbons and water vapour, as well as information on their environmental impact.
- Eurostat. The Statistical Office of the European Commission regularly publishes estimates of quarterly greenhouse gas emissions in the European Union, broken down by economic activity. The estimates cover all quarters from 2010 to the present.
- Life Cycle Assessment (LCA). This platform is the EU's knowledge base on sustainable production and consumption. It provides a product life cycle inventory for supply chain analysis. Data from business associations and other sources related to energy carriers, transport and waste management are used.
- Our World in Data. One of the most widely used datasets of this portal contains information on CO2 and greenhouse gas emissions through key metrics. Various primary data sources such as the US Energy Information Agency and The Global Carbon Project have been used for its elaboration. All raw data and scripts are available in their GitHub repository.
These repositories are just a sample, but there are many more sources whit valuable data to help us become more aware of the climate situation we live in and the impact our small day-to-day actions have on our planet. Reducing our carbon footprint is crucial to preserving our environment and ensuring a sustainable future. And only together will we be able to achieve our goals.
Noticia
The unstoppable advance of ICTs in cities and rural territories, and the social, economic and cultural context that sustains it, requires skills and competences that position us advantageously in new scenarios and environments of territorial innovation. In this context, the Provincial Council of Badajoz has been able to adapt and anticipate the circumstances, and in 2018 it launched the initiative "Badajoz Es Más - Smart Provincia".
What is "Badajoz Es Más"?
The project "Badajoz Is More" is an initiative carried out by the Provincial Council of Badajoz with the aim of achieving more efficient services, improving the quality of life of its citizens and promoting entrepreneurship and innovation through technology and data governance in a region made up of 135 municipalities. The aim is to digitally transform the territory, favouring the creation of business opportunities, social improvement andsettlement of the population.
Traditionally, "Smart Cities" projects have focused their efforts on cities, renovation of historic centres, etc. However, "Badajoz Es Más" is focused on the transformation of rural areas, smart towns and their citizens, putting the focus on rural challenges such as depopulation of rural municipalities, the digital divide, talent retention or the dispersion of services. The aim is to avoid isolated "silos" and transform these challenges into opportunities by improving information management, through the exploitation of data in a productive and efficient way.

Citizens at the Centre
The "Badajoz es Más" project aims to carry out the digital transformation of the territory by making available to municipalities, companies and citizens the new technologies of IoT, Big Data, Artificial Intelligence, etc. The main lines of the project are set out below.
Provincial Platform for the Intelligent Management of Public Services
It is the core component of the initiative, as it allows for the integration of information from any IoT device, information system or data source in one place for storage, visualisation and in a single place for storage, visualisation and analysis. Specifically, data is collected from a variety of sources: the various sensors of smart solutions deployed in the region, web services and applications, citizen feedback and social networks.
All information is collected on a based on the open source standard FIWARE an initiative promoted by the European Commission that provides the capacity to homogenise data (FIWARE Data Model) and favour its interoperability. Built according to the guidelines set by AENOR (UNE 178104), it has a central module Orion Context Broker (OCB) which allows the entire information life cycleto be managed. In this way, it offers the ability to centrally monitor and manage a scalable set of public services through internal dashboards.
The platform is "multi-entity", i.e. it provides information, knowledge and services to both the Provincial Council itself and its associated Municipalities (also known as "Smart Villages"). The visualisation of the different information exploitation models processed at the different levels of the Platform is carried out on different dashboards, which can provide service to a specific municipality or locality only showing its data and services, or also provide a global view of all the services and data at the level of the Provincial Council of Badajoz.
Some of the information collected on the platform is also made available to third parties through various channels:
- Portal of open dopen data portal. Collected data that can be opened to third parties for reuse is shared through its open data portal. In it we can find information as diverse as real time data on the beaches with blue flags blue flag beaches in the region (air quality, water quality, noise pollution, capacity, etc. are monitored) or traffic flow, which makes it possible to predict traffic jams.
- Portal for citizens Digital Province Badajoz. This portal offers information on the solutions currently implemented in the province and their data in real time in a user-friendly way, with a simple user experience that allows non-technical people to access the projects developed.
The following graph shows the cycle of information, from its collection, through the platform and distribution to the different channels. All this under strong data governance.
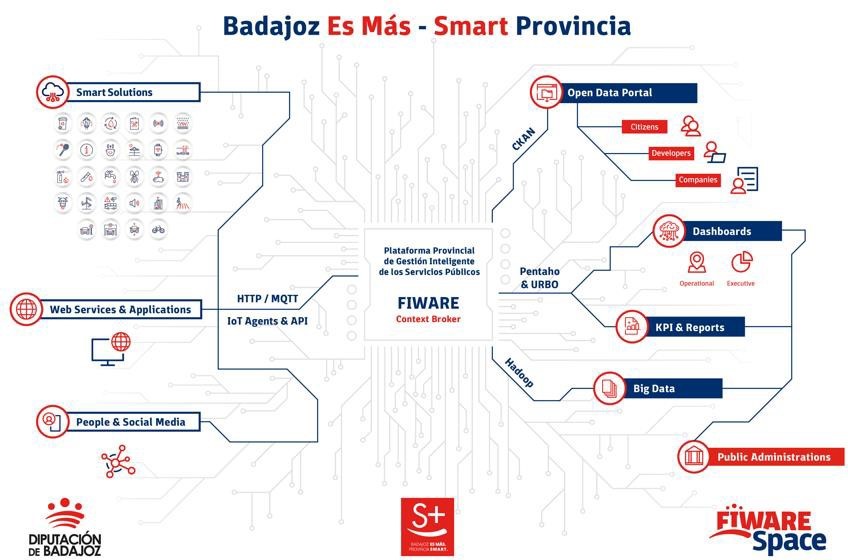
Efficient public services
In addition to the implementation and start-up of the Provincial Platform for the Intelligent Management of Public Services, this project has already integrated various existing services or "verticals" for:
-
To start implementing these new services in the province and to be the example and the "spearhead" of this technological transformation.
- Show the benefits of the implementation of these technologies in order to disseminate and demonstrate them, with the aim of causing sufficient impact so that other local councils and organisations will gradually join the initiative.
There are currently more than 40 companies sending data to the Provincial Platform, more than 60 integrated data sources, more than 800 connected devices, more than 500 transactions per minute... It should be noted that work is underway to ensure that the new calls for tender include a clause so that data from the various works financed with public money can also be sent to the platform.
The idea is to be able to standardise management, so that the solution that has been implemented in one municipality can also be used in another. This not only improves efficiency, but also makes it possible to compare results between municipalities. You can visualise some of the services already implemented in the Province, as well as their Dashboards built from the Provincial Platform at this video.

Innovation Ecosystem
In order for the initiative to reach its target audience, the Provincial Council of Badajoz has developed an innovation ecosystem that serves as a meeting point for the Badajoz Provincial Council:
-
Citizens, who demand these services.
-
Entrepreneurs and educational entities, which have an interest in these technologies.
-
Companies, which have the capacity to implement these solutions.
- Public entities, which can implement this type of project.
The aim is to facilitate and provide the necessary tools, knowledge and advice so that the projects that emerge from this meeting can be carried out.
At the core of this ecosystem is a physical innovation centre called the FIWARE Space. FIWARE Space carries out tasks such as the organisation of events for the dissemination of Smart technologies and concepts among companies and citizens, demonstrative and training workshops, Hackathons with universities and study centres, etc. It also has a Showroom for the exhibition of solutions, organises financially endowed Challenges and is present at national and international congresses.
In addition, they carry out mentoring work for companies and other entities. In total, around 40 companies have been mentored by FIWARE Space, launching their own solutions on several occasions on the FIWARE Market, or proposing the generated data models as standards for the entire global ecosystem. These companies are offered a free service to acquire the necessary knowledge to work in a standardised way, generating uniform data for the rest of the region, and to connect their solutions to the platform, helping and advising them on the challenges that may arise.
One of the keys to FIWARE Space is its open nature, having signed many collaboration agreements and agreements with both local and international entities. For example, work on the standardisation of advanced data models for tourism is ongoing with the Future Cities Institute (Argentina). For those who would like more information, you can follow your centre's activity through its weekly blog.

Next steps: convergence with Data Spaces and Gaia-X
As a result of the collaborative and open nature of the project, the Data Space concept fits perfectly with the philosophy of "Badajoz is More". The Badajoz Provincial Council currently has a multitude of verticals with interesting information for sharing (and future exploitation) of data in a reliable, sovereign and secure way. As a Public Entity, comparing and obtaining other sources of data will greatly enrich the project, providing an external view that is essential for its growth. Gaia-X is the proposal for the creation of a data infrastructure for Europe, and it is the standard towards which the "Badajoz es Más" project is currently converging, as a result of its collaboration with the gaia-X Spain hub.
Noticia
The Use Case Observatory is an initiative led by data.europa.eu, the European Open Data Portal. This is a research project on the economic, governmental, social and environmental impact of open data. The project will run for three years, from 2022 to 2025, during which the European Data Portal will monitor 30 cases of open data re-use and publish findings in regular deliverables.
In 2022 it made a first report and now, in April 2024, it has presented volume 2 of the exploratory analysis on the use of open data. In this second instalment, he analyses thirteen of the initial use cases that remain under study, three of them Spanish, and draws the following conclusions:
- The paper first of all underlines the high potential of open data re-use.
- It stresses that many organisations and applications owe their very existence to open data.
- It also points to the need to unlock more broadly the potential impact of open data on the economy, society and the environment.
- To achieve the above point, it points to continued support for the reuse community as crucial to identifying opportunities for financial growth.
The three Spanish cases: UniversiDATA-Lab, Tangible Data and Planttes
To select the use cases, the Use Case Observatory conducted an inventory based on three sources: the examples collected in the European portal's annual maturity studies , the solutions participating in the EU Datathon and the reuse examples available in the data.europa.eu use case repository. Only projects developed in Europe were taken into account, trying to maintain a balance between the different countries.
In addition, projects that had won an award or were aligned with the European Commission's priorities for 2019 to 2024 were highlighted. To finalise the selection, data.europa.eu conducted interviews with representatives of eligible use cases interested in participating in the project.
On this second occasion, the new report reviews one project in the economic impact area, three in the governmental area, six in the social area and four in the environmental area.
In both the first volume and this one, he highlights three Spanish cases: UniversiDATA-Lab and Tangible Data in the social field and Planttes in the environmental category.
UniversiDATA-Lab, the union of six universities around open data
In the case of UniversiDATA-Lab it is focused on higher education. It is a public portal for the advanced and automatic analysis of datasets published by the six Spanish universities that are part of the UniversiDATAportal: the Autonomous University of Madrid (UAM), the Carlos III University of Madrid, the Complutense University of Madrid (UCM), the University of Huelva, the University of Valladolid (UVa) and the Juan Carlos I University.
The aim of UniversiDATA-Lab is to transform the static analyses of the portal section into dynamic results. The Observatory's report notes that this project "encourages the use of shared resources" between the different university centres. Another notable impact is the implementation of dynamic web applications that read the UniversiDATA catalogue in real time, retrieve all available data and perform online data analysis.
Regarding the previous report, it praises its "considerable effort to convert intricate data into user-friendly information", and notes that this project provides detailed documentation to help users understand the nature of the data analysed.
Tangible Data, making spatial data understandable
Tangible Data is a project that transforms data from its digital context into a physical context by creating data sculptures in public space. These data sculptures help people who lack certain digital skills to understand them. It uses data from international agencies (e.g. NASA, World Bank) and other similar platforms as data sources.
In this second volume, they highlight its "significant" evolution, as since last year the project has moved from minimum viable product testing to the delivery of integral projects. This has allowed them to "explore commercial and educational opportunities, such as exhibitions, workshops, etc.", as extrapolated from the interviews conducted. In addition, the four key processes (design, creation, delivery and measurement) have been standardised and have made the project globally accessible and rapidly deployable.
Planttes, an environmental initiative that is making its way into the Observatory
The third Spanish example, Planttes, is a citizen science app that informs users about which plants are in flower and whether this can affect people allergic to pollen. It uses open data from the Aerobiology Information Point (PIA-UAB), among others, which it complements with data provided by users to create personalised maps.
Of this project, the Observatory notes that, by harnessing community involvement and technology, "the initiative has made significant progress in understanding and mitigating the impact of pollen allergies with a commitment to furthering awareness and education in the years to come".
Regarding the work developed, he points out that Planttes has evolved from a mobile application to a web application in order to improve accessibility. The aim of this transition is to make it easier for users to use the platform without the limitations of mobile applications.
The Use Case Observatory will deliver its third volume in 2025. Its raison d'être goes beyond analysing and outlining achievements and challenges. As this is an ongoing project over three years, it will allow for the extrapolation of concrete ideas for improving open data impact assessment methodologies.