Noticia
The concept of High-Value data (High-Value datasets) was introduced by the European Parliament and the Council of the European Union 4 years ago, in Directive (EU) 2019/1024. In it, they were defined as a series of datasets with a high potential to generate "benefits for society, the environment and the economy". Therefore, member states were to push for their openness for free, in machine-readable formats, via APIs, in the form of bulk download and comprehensively described by metadata.
Initially, the directive proposed in its annex six thematic categories to be considered as high value: geospatial, earth observation and environmental, meteorological, statistical, business records and transport network data. These categories were subsequently detailed in an implementing regulation published in December 2022. In addition, to facilitate their openness, a document with guidelines on how to use DCAT-AP for publication was published in June 2023.
New categories of data to be considered of high value
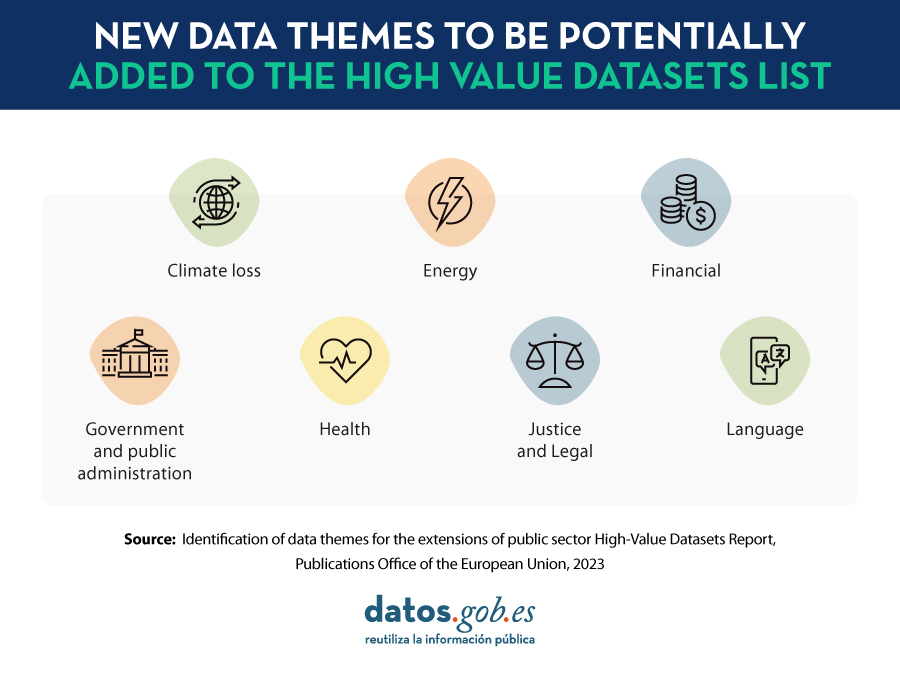
These initial categories were always open to extension. In this sense, the European Commission has just published the report "Identification of data themes for the extensions of public sector High-Value Datasets" which includes seven new categories to be considered as high-value data
-
Climate loss: This refers to data related to approaches and actions needed to avoid, minimize and address damages associated with climate change. Examples of datasets in this category are economic and non-economic losses from extreme weather events or slow-onset changes such as sea level rise or desertification. It also includes data related to early warning systems for natural disasters, the impact of mitigation measures, or research data on the attribution of extreme events to climate change.
-
Energy: This category includes comprehensive statistics on the production, transport, trade and final consumption of primary and secondary energy sources, both renewable and non-renewable. Examples of data sets to consider are price and consumption indicators or information on energy security.
-
Finance: This is information on the situation of private companies and public administrations, which can be used to assess business performance or economic sustainability, as well as to define spending and investment strategies. It includes datasets on company registers, financial statements, mergers and acquisitions, as well as annual financial reports.
-
Government and public administration: This theme includes data that public services and companies collect to inform and improve the governance and administration of a specific territorial unit, be it a state, a region or a municipality. It includes data relating to government (e.g. minutes of meetings), citizens (census or registration in public services) and government infrastructures. These data are then reused to inform policy development, deliver public services, optimize resources and budget allocation, and provide actionable and transparent information to citizens and businesses.
-
Health: This concept identifies data sets covering the physical and mental well-being of the population, referring to both objective and subjective aspects of people's health. It also includes key indicators on the functioning of health care systems and occupational safety. Examples include data relating to Covid-19, health equity or the list of services provided by health centers.
-
Justice and legal affairs: Identifies datasets to strengthen the responsiveness, accountability and interoperability of EU justice systems, covering areas such as the application of justice, the legal system or public security, i.e. that which ensures the protection of citizens. The data sets on justice and legal matters include documentation of national or international jurisprudence, decisions of courts and prosecutors general, as well as legal acts and their content.
-
Linguistic data: Refers to written or spoken expressions that are at the basis of artificial intelligence, natural language processing and the development of related services. The Commission provides a fairly broad definition of this category of data, all of which are grouped under the term "multimodal linguistic data". They may include repositories of text collections, corpora of spoken languages, audio resources, or video recordings.
To make this selection, the authors of the report conducted desk research as well as consultations with public administrations, data experts and private companies through a series of workshops and surveys. In addition to this assessment, the study team mapped and analyzed the regulatory ecosystem around each category, as well as policy initiatives related to their harmonization and sharing, especially in relation to the creation of European Common Data Spaces.
Potential for SMEs and digital platforms
In addition to defining these categories, the study also provides a high-level estimate of the impact of the new categories on small and medium-sized companies, as well as on large digital platforms. One of the conclusions of the study is that the cost-benefit ratio of data openness is similar across all new topics, with those relating to the categories "Finance" and "Government and public administration" standing out in particular.
Based on the publicly available datasets, an estimate was also made of the current degree of maturity of the data belonging to the new categories, according to their territorial coverage and their degree of openness (taking into account whether they were open in machine-readable formats, with adequate metadata, etc.). To maximize the overall cost-benefit ratio, the study suggests selecting a different approach for each thematic category: based on their level of maturity, it is recommended to indicate a higher or lower number of mandatory criteria for publication, thus ensuring to avoid overlaps between new topics and existing high-value data.
You can read the full study at this link.
Blog
Since 24 September last year, the Regulation (EU) 2022/868 of the European Parliament and of the Council of 30 May 2022, on European Data Governance (Data Governance Regulation) has been applicable throughout the European Union. Since it is a Regulation, its provisions are directly effective without the need for transposing State legislation, as is the case with directives. However, with regard to the application of its regulation to Public Administrations, the Spanish legislator has considered it appropriate to make some amendments to the Law 37/2007, of 16 November 2007, on the re-use of public sector information. Specifically:
- A specific sanctioning regime has been incorporated within the scope of the General State Administration for cases of non-compliance with its provisions by re-users, as will be explained in detail below;
- Specific criteria have been established on the calculation of the fees that may be charged by public administrations and public sector entities that are not of an industrial or commercial nature;
- And finally, some singularities have been established in relation to the administrative procedure for requesting re-use, in particular a maximum period of two months is established for notifying the corresponding resolution -which may be extended to a maximum of thirty days due to the length or complexity of the request-, after which the request will be deemed to have been rejected.
What is the scope of this new regulation?
As is the case with the Directive (EU) 2019/1024 of the European Parliament and of the Council of 20 June 2019 on open data and the reuse of public sector informationthis Regulation applies to data generated in the course of the "public service remit" in order to facilitate its re-use. However, the former did not contemplate the re-use of those data protected by the concurrence of certain legal assets, such as confidentiality, trade secrets, the intellectual property or, singularly, the protection of personal data.
You can see a summary of the regulations in this infographic.
Indeed, one of the main objectives of the Regulation is to facilitate the re-use of this type of data held by administrations and other public sector entities for research, innovation and statistical purposes, by providing for enhanced safeguards for this purpose. It is therefore a matter of establishing the legal conditions that allow access to the data and their further use without affecting other rights and legal interests of third parties. Consequently, the Regulation does not establish new obligations for public bodies to allow access to and re-use of information, which remains a competence reserved for Member States. It simply incorporates a number of novel mechanisms aimed at making access to information compatible, as far as possible, with respect for the confidentiality requirements mentioned above. In fact, it is expressly warned that, in the event of a conflict with the Regulation (EU) 2016/679 on the protection of natural persons with regard to the processing of personal data and on the free movement of such data (GDPR), the latter shall in any case prevail (GDPR), the latter shall in any case prevail.
Apart from the regulation referring to the public sector, to which we will refer below, the Regulation incorporates specific provisions for certain types of services which, although they could also be provided by public entities in some cases, will normally be assumed by private entities. Specifically, intermediation services and the altruistic transfer of data are regulated, establishing a specific legal regime for both cases. The Ministry of Economic Affairs and Digital Transformation will be in charge of overseeing this process in Spain
As regards, in particular, the impact of the Regulation on the public sector, its provisions do not apply to public undertakings , i.e. those in which there is a dominant influence of a public sector body, to broadcasting activities and, inter alia, to cultural and educational establishments. Nor to data which, although generated in the performance of a public service mission, are protected for reasons of public security, defence or national security.
Under what conditions can information be re-used?
In general, the conditions under which re-use is authorised must preserve the protected nature of the information. For this reason, as a general rule, access will be to data that are anonymised or, where appropriate, aggregated, modified or subject to prior processing to meet this requirement. In this respect, public bodies are authorised to charge fees which, among other criteria, are to be calculated on the basis of the costs necessary for the anonymisation of personal data or the adaptation of data subject to confidentiality.
It is also expressly foreseen that access and re-use take place in a secure environment controlled by the public body itself, be it a physical or virtual environment. In this way, direct supervision can be carried out, which could consist not only in verifying the activity of the re-user, but also in prohibiting the results of processing operations that jeopardise the rights and interests of third parties whose integrity must be guaranteed. Precisely, the cost for the maintenance of these spaces is included among the criteria that can be taken into account when calculating the corresponding fee that can be charged by the public body.
In the case of personal data, the Regulation does not add a new legal basis to legitimise the re-use of personal data other than those already established by the general rules on re-use. Public bodies are therefore encouraged to provide assistance to re-usersin such cases to help them obtain permission from stakeholders. However, this is a support measure that can in no way place disproportionate burdens on the agencies. In this respect, the possibility to re-use pseudonymised data should be covered by some of the cases provided for in the GDPR. Furthermore, as an additional guarantee, the purpose for which the data are intended to be re-used must be compatible with the purpose for which the data were originally intended justified the processing of the data by the public body in the exercise of its main activity, and appropriate safeguards must be adopted.
A practical example of great interest concerns the re-use of health data for biomedical research purposes reuse of health data for biomedical research purposes, which the Spanish legislator which has been established by the Spanish legislator under the provisions of the latter precept. Specifically, the 17th additional provision of Organic Law 3/2018, of 5 December, on the Protection of Personal Data and the Guarantee of Digital Rightsallows the reuse of pseudonymised data in this area when certain specific guarantees are established, which could be reinforced with the use of the aforementioned secure environments in the case of the use of particularly incisive technologies, such as artificial intelligence. This is without prejudice to compliance with other obligations which must be taken into account depending on the conditions of the data processing, in particular the carrying out of impact assessments.
What instruments are foreseen to ensure effective implementation?
From an organisational perspective, States need to ensure thatinformation is easily accessible through a single point. In the case of Spain, this point is available through the platform enabled through the platform datos.gob.esplatform, although there may also be other access points for specific sectors and different territorial levels, in which case they must be linked. Re-users may contact this point in order to make enquiries and requests, which shall be forwarded to thethese will be forwarded to the competent body or entity for processing and response.
The following must also be designated and notified to the notify to the European Commission one or more specialised entities with the appropriate technical and human resources, which could be some of the existing ones, that perform the function of assisting public bodies in granting or refusing re-use. However, if foreseen by European or national regulations, these bodies could assume decision-making functions and not only mere assistance. In any case, it is foreseen that the administrations and, where appropriate, the entities of the institutional public sector, according to the ‑‑according to the terminology of article 2 of Law 27/2007‑‑who make this designation and communicate it to the Ministry of Economic Affairs and Digital Transformationwhich, for its part, will be responsible for the corresponding notification at European level.
Finally, as indicated at the beginning, the following have been classified as specific infringements for the scope of the General Administration of the State certain conducts of re-users which are punishable by fines ranging from 10,001 to 100,000 euros. Specifically, it concerns conduct that, either deliberately or negligently, involves a breach of the main guarantees provided for in European legislation: in particular, failure to comply with the conditions for access to data or to secure areas, re-identification or failure to report security problems.
In short, as pointed out in the European Data Strategyif the European Union wants to play a leading role in the data economy , it is essential, among other measures, to improve governance structures and increase repositories of quality data , which are often affected by significant legal obstacles. With the Data Governance Regulation an important step has been taken at the regulatory level, but it now remains to be seen whether public bodies are able to take a proactive stance to facilitate the implementation of its measures, which ultimately imply important challenges in the digital transformation of their document management.
Content prepared by Julián Valero, Professor at the University of Murcia and Coordinator of the "Innovation, Law and Technology" Research Group (iDerTec).
The contents and points of view reflected in this publication are the sole responsibility of the author.
Blog
On September 8, the webinar \"Geospatial Trends 2023: Opportunities for data.europa.eu\" was held, organized by the Data Europa Academy and focused on emerging trends in the geospatial field. Specifically, the online conference addressed the concept of GeoAI (Geospatial Artificial Intelligence), which involves the application of artificial intelligence (AI) combined with geospatial data.
Next, we will analyze the most cutting-edge technological developments of 2023 in this field, based on the knowledge provided by the experts participating in the aforementioned webinar.
What is GeoAI?
The term GeoAI, as defined by Kyoung-Sook Kim, co-chair of the GeoAI Working Group of the Open Geospatial Consortium (OGC), refers to \"a set of methods or automated entities that use geospatial data to perceive, construct (automate), and optimize spaces in which humans, as well as everything else, can safely and efficiently carry out their geographically referenced activities.\"
GeoAI allows us to create unprecedented opportunities, such as:
- Extracting geospatial data enriched with deep learning: Automating the extraction, classification, and detection of information from data such as images, videos, point clouds, and text.
- Conducting predictive analysis with machine learning: Facilitating the creation of more accurate prediction models, pattern detection, and automation of spatial algorithms.
- Improving the quality, uniformity, and accuracy of data: Streamlining manual data generation workflows through automation to enhance efficiency and reduce costs.
- Accelerating the time to gain situational knowledge: Assisting in responding more rapidly to environmental needs and making more proactive, data-driven decisions in real-time.
- Incorporating location intelligence into decision-making: Offering new possibilities in decision-making based on data from the current state of the area that needs governance or planning.
Although this technology gained prominence in 2023, it was already discussed in the 2022 geospatial trends report, where it was indicated that integrating artificial intelligence into spatial data represents a great opportunity in the world of open data and the geospatial sector.
Use Cases of GeoAI
During the Geospatial Trends 2023 conference, companies in the GIS sector, Con terra and 52ºNorth, shared practical examples highlighting the use of GeoAI in various geospatial applications.
Examples presented by Con terra included:
- KINoPro: A research project using GeoAI to predict the activity of the \"black arches\" moth and its impact on German forests.
- Anomaly detection in cell towers: Using a neural network to detect causes of anomalies in towers that can affect the location in emergency calls.
- Automated analysis of construction areas: Aiming to detect building areas for industrial zones using OpenData and satellite imagery.
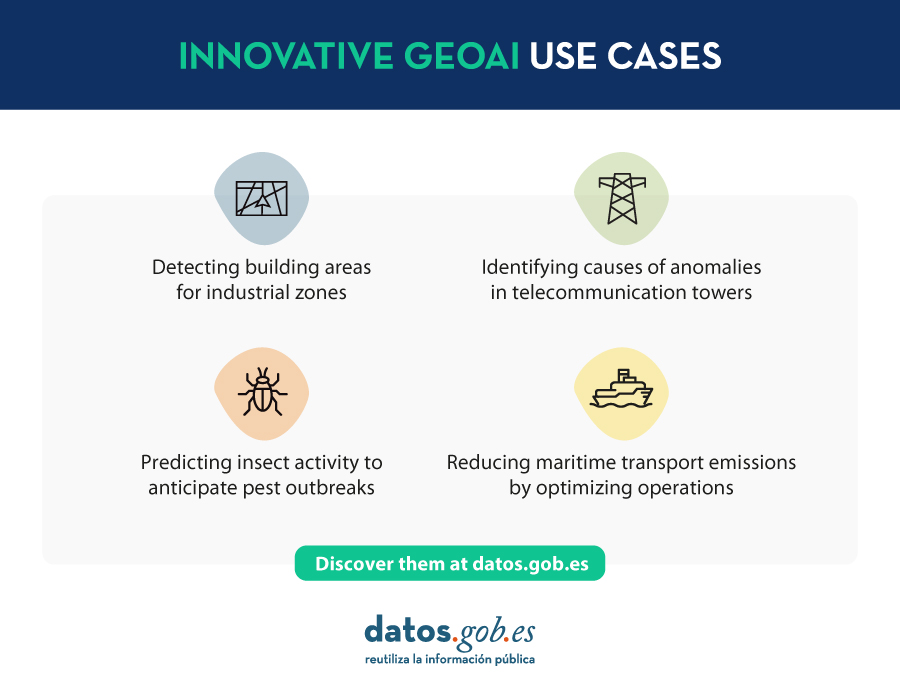
On the other hand, 52ºNorth presented use cases such as MariData, which seeks to reduce emissions from maritime transport by using GeoAI to calculate optimal routes, considering ship position, environmental data, and maritime traffic regulations. They also presented KI:STE, which applies artificial intelligence technologies in environmental sciences for various projects, including classifying Sentinel-2 images into (un)protected areas.
These projects highlight the importance of GeoAI in various applications, from predicting environmental events to optimizing maritime transport routes. They all emphasize that this technology is a crucial tool for addressing complex problems in the geospatial community.
GeoAI not only represents a significant opportunity for the spatial sector but also tests the importance of having open data that adheres to FAIR principles (Findable, Accessible, Interoperable, Reusable). These principles are essential for GeoAI projects as they ensure transparent, efficient, and ethical access to information. By adhering to FAIR principles, datasets become more accessible to researchers and developers, fostering collaboration and continuous improvement of models. Additionally, transparency and the ability to reuse open data contribute to building trust in results obtained through GeoAI projects.
Reference
| Reference video | https://www.youtube.com/watch?v=YYiMQOQpk8A |
Noticia
The Canary Islands Statistics Institute (ISTAC) has taken a significant step forward in the volume of geographic data thanks to the publication of a total of 4,002 new datasets (3,859 thematic maps and 143 statistical cubes) in datos.gob.es, following its federation in Canarias Datos Abiertos.
This type of initiative is aligned with the European Union's Data Strategy, which establishes the guidelines to achieve a single data market that benefits companies, researchers and public administrations. The automation of publication processes through common standards is key to ensure interoperability and adequate access to open data sets of public administrations.
The generation of these datasets is the culmination of an automation work that has allowed the expansion of the number of published cubes, as now combinations of granularity and year since 2004 are presented. In early October, the ISTAC added to its catalog more than 500 semantic assets and more than 2100 statistical cubes, as we told in this post on datos.gob.es.
In addition, the sets published to date have undergone a renewal process to become the aforementioned 143 statistical cubes. The increase of these datasets not only improves the directory of datos.canarias.es and datos.gob.es in quantitative terms, but also broadens the uses it offers thanks to the type of information added.
The indicators of these cubes are represented on the cartography through choropleth maps and in multiple formats. This automation will, in turn, not only allow other datasets to be published more easily in the future, but also more frequently.
Another of the advances of this work is that the services are generated on the fly from the Geoserver map server, and not through an upload to CKAN, as was done until now, which reduces their storage and speeds up their updating.
How to bring demographic indicators closer to the population
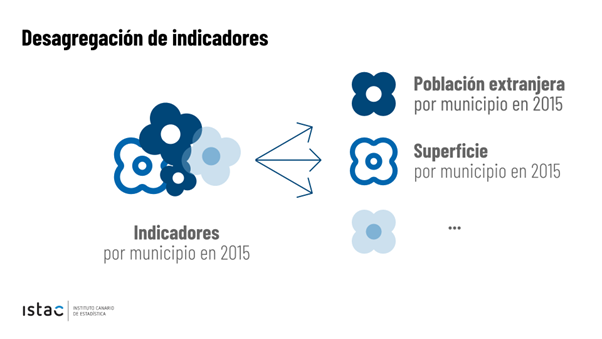
Demographic indicators are dense data cubes that offer a large amount of detailed geographic information, including total population, disaggregated by sex, residence, age and other indices up to a total of 27 different variables.
As so much information is contained in each cube, it can be difficult to represent specific indicators on the cartography, especially if the user is not used to working with certain GIS (Geographical Information System) software.
To bring this content to all types of users, the ISTAC has generated 3,859 new maps, representing on a choropleth map each of the indicators contained in the 143 statistical cubes. The publication of these new cartographic data is thus presented as a more efficient and simplified way of obtaining the information already represented, allowing users to easily access the specific data they need.
We could compare this transformation to flowers. Previously, only whole bouquets were published, with 27 flowers per bouquet, which had to be managed and handled to represent the flowers that were of interest. Now, in addition to continuing to publish the bouquets, new processes have been generated to be able to publish each flower separately, automating the generation of each of these sets, which will also be updated more frequently.
This new option facilitates the use of these choropleth maps (like the one shown in the image) by people without technical GIS knowledge, since they are presented in easily downloadable formats as images (.jpg and .png) for professional, educational or personal use.
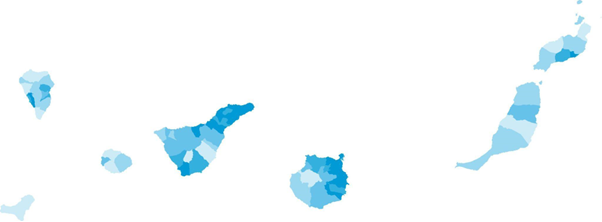

Mapa de población de 65 o más años (% sobre total) por municipios. Año 2022
For more advanced users, ISTAC has also expanded the range of formats in which the original indicator cubes are served. The "bouquets", which previously only showed data in CSV format, now have a wide variety of distributions: KML, GML, GeoPackage, GeoJSON, WFS, WMS. Taking advantage of the benefits provided by the use of styles in the WMS format, all the styles associated with the indicators have been generated, so that, using them, it is possible to represent the same map that is downloaded in image format. These styles are calculated for each indicator-granularity-year combination, according to the method of calculating quantiles for five intervals.
This new approach with both simple and complex geographic data enriches the catalog and allows users without specific knowledge to access and reuse them. In addition, it should be noted that this opens the door to other massive publications of data based on other statistical operations.
In short, this is an important step in the process of opening up data. A process that improves the use and sharing of data, both for the user on the ground and for professionals in the sector. Given the growing need to share, process and compare data, it is essential to implement processes that facilitate interoperability and appropriate access to open data. In this sense, the Canary Islands Institute of Statistics is concentrating its efforts to ensure that its open data sets are accessible and in the appropriate formats for sharing. All this in order to obtain value from them.
Blog
The active participation of young people in civic and political life is one of the keys to strengthening democracy in Europe. Analyzing and understanding the voice of young people provides insight into their attitudes and opinions, something that helps to foresee future trends in society with sufficient room for maneuver to address their needs and concerns towards a more prosperous and comfortable future for all.
In the mission to gain a clearer perspective on how they participate in Europe, open data has become a valuable tool. In this post, we will explore how young people in Europe actively engage in society and politics through relevant European Union (EU) open data published on the European open data portal.
Youth commitment in the European elections
The European Union has as one of its objectives to promote the active participation of young people in democracy and society. Their participation in elections and civic activities enriches European democracy. Young people bring diverse ideas and perspectives, which contributes to decision-making and ensures that policies are tailored to their needs and challenges. In addition, their participation contributes to a political system that reflects the interests of all citizens, which in turn fosters an inclusive and peaceful society.
In the last European Parliament elections, the highest turnout in the last 20 years was achieved, with more than 50% of the European population voting, as corroborated by the EU's Eurobarometer post-election survey. This increase in turnout was largely due to an increase in youth participation.
The data show that the younger generation (under 25) increased their electoral participation by 14% to 42%, while the participation of 25-39 year olds increased by 12% to 47%, compared between the 2014 and 2019 European elections. This growth in youth participation raises a question: what motivated young people to participate more? According to the 2021 Eurobarometer Youth Survey, a sense of duty as a citizen (32%) and a willingness to take responsibility for the future (32%) were the main factors motivating young people to vote in the European elections.

Why do young people want to participate in the EU?
In addition to voting in elections, there are other ways in which young people demonstrate that they are an active part of citizenship. The Youth Survey 2021 reveals interesting data about their interest in politics and civic life.
In general, politics is a topic that interests them. The majority of participants in the Youth Survey 2021 claimed to discuss politics with friends or family (85%). In addition, many said they understand how their country's national government works (58%). However, most young people feel they have little influence on important decisions, laws, and policies that affect them. Young people feel they have more say in their local government (47%), than in the national government (40%) or at the EU level (30%).
The next step, after understanding the policy, is action. Young people believe that certain political and civic activities are more effective than others in getting their voice to decision-makers. In order, voting in elections (41%), participating in protests or street demonstrations (33%) and participating in petitions (30%) were considered the three most effective activities by respondents. Many young people had voted in their last local, national or European elections (46%) and had created or signed a petition (42%).
However, the survey reveals an interesting divergence between young people's perceptions and their actions. On some occasions, youth get involved in activities even though they are not what they consider to be the most effective, as in the case of online signature petitions. On the other hand, they do not always participate in activities that they perceive to be effective, such as street protests or contact with politicians.

The youth impulse for European democracy
Young people want the issues they see as priorities to be on the political agenda of the next European elections. A more recent special Eurobarometer on democracy in action in 2023 revealed that young people aged 15-24 are the age group most satisfied with the functioning of democracy in the EU (61%, compared to the EU average of 54%).
Climate change is a particularly prominent concern among young people, with 40% of respondents aged 15-24 considering this issue a priority, compared to 31% of the general EU population.
To encourage youth participation in the European political agenda, initiatives have been developed that use open data to bring politics closer to citizens. Examples such as TrackmyEU and Democracy Game seek to engage young people in politics and enable them to access information on EU policies and participate in debates and civic activities.
In general, open data provides valuable insights into many realities, for example, that affecting youth and their interaction in society and politics. This analysis enables governments and public administrations to make informed decisions on issues affecting this social group. Young Europeans are interested in politics, actively participate in elections and get involved in youth organizations; they are concerned about issues such as inequality and climate change. Open data is also used in initiatives that promote the participation of young people in political and civic life, further strengthening European democracy.
In an increasingly digital and data-driven society, access to open data is essential to understand the concerns and interests of youth and their participation in civic and political decision-making. As a part of an active and engaged citizenry, youth have an important role to play in Europe's future, and open data is an essential tool to support their participation.
Content based on the post from the European open data portal Understanding youth engagement in Europe through open data.
Noticia
El Instituto de Estadística y Cartografía de Andalucía (IECA), in collaboration with the Andalusian Agency for International Development Cooperation (AACID), has incorporated new indicators at the municipal level into its Sustainable Development Indicators System for Andalusia for the Agenda 2030. This effort aims to integrate statistical and geographical information while enhancing the efficiency of the Andalusian public administration and the information services provided to society.
Thanks to these efforts, Andalusia has been selected as one of the participating regions in the European project "REGIONS 2030: Monitoring the SDGs in EU regions," along with nine other regions in the European Union. All of these regions share a strong commitment to the analysis and fulfillment of the Sustainable Development Goals (SDGs), recognizing the importance of this work in decision-making and sustainable regional development.
The "REGIONS 2030" project, funded by the European Parliament and developed by the Joint Research Centre (JRC) of the European Commission in collaboration with the Directorate-General for Regional and Urban Policy (DG REGIO) and EUROSTAT, aims to fill data gaps in monitoring the SDGs in EU regions.

Image 1: "REGIONS 2030" Project: Monitoring the SDGs in EU regions.
Source: Andalusian Institute of Statistics and Cartography (IECA)
The new indicators incorporated are essential for measuring the progress of the SDGs
The Andalusian Institute of Statistics and Cartography, in collaboration with AACID, has created a set of indicators that allow for evaluating the advancement of the Sustainable Development Goals at the regional level, available on their website. All the new municipal-level indicators are identified with the Joint Research Centre (municipal) for Andalusia, and they address 9 of the 17 Sustainable Development Goals.
The methodology used for most of the indicators is based on georeferenced information from the Andalusian Institute of Statistics and Cartography, using publications on the Spatial Distribution of the Population in Andalusia and the Characterization and Distribution of Built Space in Andalusia as reference points.
One of the indicators provides information on Goal 1: No Poverty and measures the risks of poverty by assessing the percentage of people residing at an address where none of their members are affiliated with Social Security. This indicator reveals more unfavorable conditions in urban municipalities compared to rural ones, consistent with previous studies that identify cities as having more acute poverty situations than rural areas.
Similarly, the per capita Built-up Area indicator for Goal 11: Sustainable Cities and Communities has been calculated using cadastral data and geospatial processes in geographic information systems.
Visualization and query of the new municipal indicators
Allow for obtaining information at the municipal level about the value and variation of the indicators compared to the previous year, both for the entire Andalusia region and different degrees of urbanization.
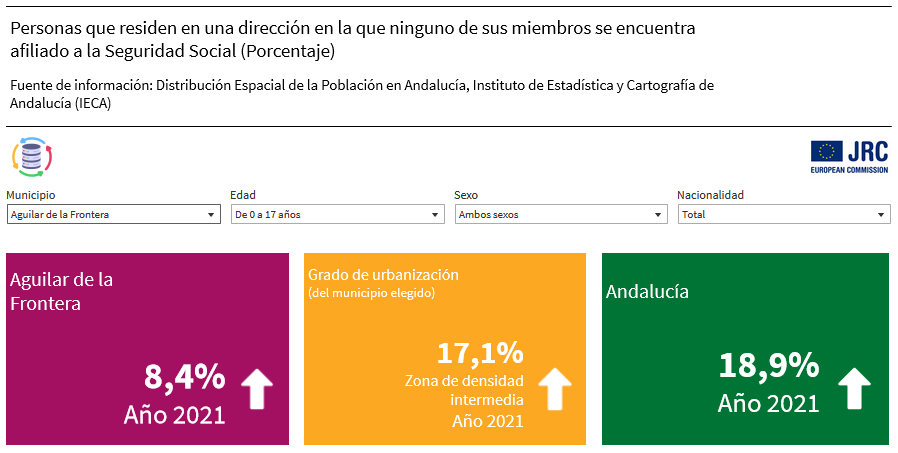
Image 2: Data visualization of the indicator.
Source: Andalusian Institute of Statistics and Cartography (IECA)
Moreover, the applied filter enables an analysis of the temporal and geographical evolution of the indicators in each of the considered areas, providing a temporal and territorial perspective.
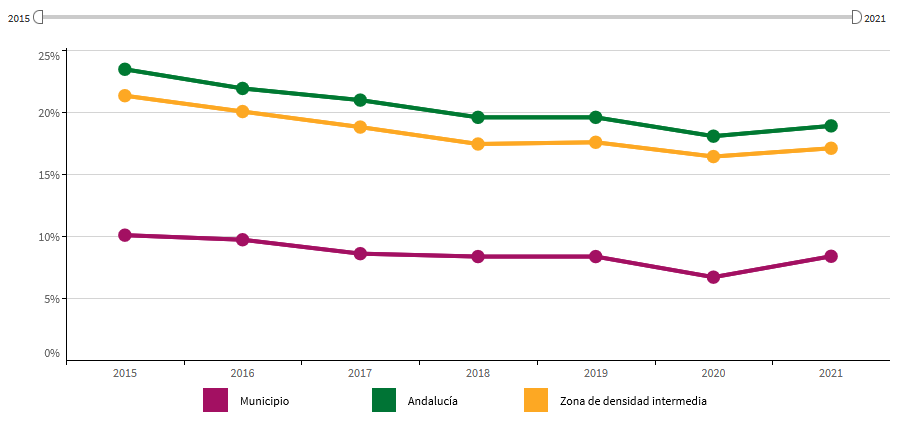
Image 3: Visualization of the indicator's evolution by area.
Source: Andalusian Institute of Statistics and Cartography (IECA)
These results are presented through an interactive map at the municipal level, displaying the distribution of the indicator in the territory.
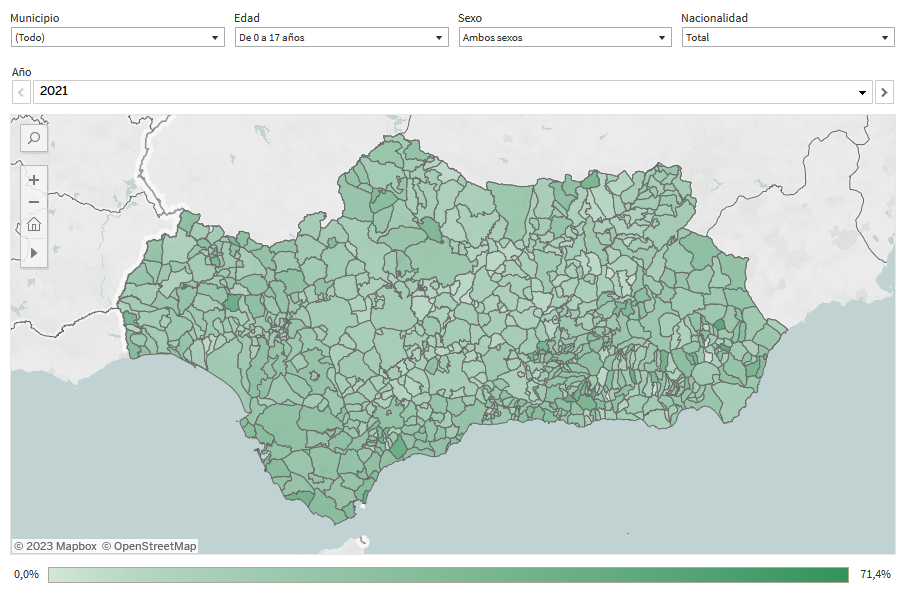
Image 4: Interactive map of the indicator.
Source: Andalusian Institute of Statistics and Cartography (IECA)
The data for the indicators are also available in downloadable structured formats (XLS, CSV, and JSON). Methodological information regarding the calculations for each indicator is provided as well.
The inclusion of Andalusia in the "REGIONS 2030" project
Has integrated all of this work with the existing Sustainable Development Indicators System for Andalusia for the Agenda 2030, which has been calculated and published by the IECA to date. This collective effort among different regions will serve to establish a methodology and select the most relevant regional indicators in Europe (NUTS2 European level) so that this methodology can be applied to all European regions in the future.
The "REGIONS 2030" project, after completing its initial work in Andalusia, has disseminated its results in the article "Monitoring the SDGs in Andalusia region, Spain," published by the European Commission in July 2023, and in an event held at the Three Cultures Foundation of the Mediterranean on September 27, under the title 'SDG Localisation and Monitoring Framework for 2030 Agenda Governance: Milestones & Challenges in Andalusia.' In this event, each selected region presented their results and discussed the needs, deficiencies, or lessons learned in generating their reports.
The "REGIONS 2030" project will conclude in December 2023 with the presentation and publication of a final report. This report will consolidate the ten regional reports generated during the monitoring of the Sustainable Development Goals at the regional level in Europe, contributing to their effective monitoring as part of the proper implementation of the Agenda 2030.
Application
This application is a tool that presents in real time the costs of electricity in Spain for the Regulated Tariff PVPC (Voluntary Price for Small Consumers). The objective is that any user can check the hours with the lowest electricity costs in order to save on their electricity bill.
Different graphs of the price of electricity hour by hour are offered, as well as useful data for users obtained from the open API of ESIOS (Red Eléctrica de España). All these graphs and data show information about fluctuations in the price of electricity in Spain.
The user can easily find out at what time electricity is cheapest at any given moment and the exact price, as well as an estimate of the next day's prices as of 8:30 p.m. the previous day.
Open data sources are:
-
Data from Red Eléctrica: https://api.esios.ree.es/
Blog
Data activism is an increasingly significant citizen practice in the platform era for its growing contribution to democracy, social justice and rights. It is an activism that uses data and data analysis to generate evidence and visualisations with the aim of revealing injustices, improving people's lives and promoting social change.
In the face of the massive use of surveillance data by certain corporations, data activism is exercised by citizens and non-governmental organisations. For example, the organisation Forensic Architecture (FA)a centre at Goldsmiths under the University of London, investigates human rights violations, including state violence, using public, citizen and satellite data, and methodologies such as open source intelligence (known as OSINT). The analysis of data and metadata, the synchronisation of video footage taken by witnesses or journalists, as well as official recordings and documents, allows for the reconstruction of facts and the generation of an alternative narrative about events and crises.
Data activism has attracted the interest of research centres and non-governmental organisations, generating a line of work within the discipline of critical studies. This has allowed us to reflect on the effect of data, platforms and their algorithms on our lives, as well as on the empowerment that is generated when citizens exercise their right to data and use it for the common good.

Image 1: Ecocide in Indonesia (2015)
Source: Forensic Architecture (https://forensic-architecture.org/investigation/ecocide-in-indonesia)
Research centres such as Datactive o Data + Feminism Lab have created theory and debates on the practice of data activism. Likewise, organisations such as Algorights -a collaborative network that encourages civil society participation in the field of aI technologies- y AlgorithmWatch -a human rights organisation - generate knowledge, networks and arguments to fight for a world in which algorithms and artificial Intelligence (AI) contribute to justice, democracy and sustainability, rather than undermine them.
This article reviews how data activism emerged, what interest it has sparked in social science, and its relevance in the age of platforms.
History of a practice
The production of maps using citizen data could be one of the first manifestations of data activism as it is now known. A seminal map in the history of data activism was generated by victims and activists with data from the 2010 Haiti earthquakeon the Kenyan platform Ushahidi ("testimony" in Swahili). A community of digital humanitarianscreated the map from other countries and called on victims and their families and acquaintances to share data on what was happening in real time. Within hours, the data was verified and visualised on an interactive map that continued to be updated with more data and was instrumental in assisting the victims on the ground. Today, such mapsare generated whenever a crisis arises, and are enriched with citizen, satellite and camera-equipped drone data to clarify events and generate evidence.
Emerging from movements known as cypherpunk and technopositivism or technoptimism (based on the belief that technology is the answer to humanity's challenges), data activism has evolved as a practice to adopt more critical stances towards technology and the power asymmetries that arise between those who originate and hand over their data, and those who capture and analyse it.
Today, for example, the Ushahidi community map production platform has been used to create data on gender-based violence in Egypt and Syria, and on trusted gynaecologists in India, for example. Today, the invisibilisation and silencing of women is the reason why some organisations are fighting for recognition and a policy of visibility, something that became evident with the #MeToo movement. Feminist data practices seek visibility and critical interpretations of datification(or the transformation of all human and non-human action into measurable data that can be transformed into value). For example, Datos Contra el Feminicidio or Feminicidio.net offer maps and data analysis on femicide in various parts of the world.
The potential for algorithmic empowerment offered by these projects removes barriers to equality by improving the conditions conditions that enable women to solve problems, determine how data is collected and used, and exercise power.
Birth and evolution of a concept
In 2015, Citizen Media Meets Big Data: The Rise of Data Activismwas published, in which, for the first time, data activism was coined and defined as a concept based on practices observed in activists who engage politically with data infrastructure. Data infrastructure includes the data, software, hardware and processes needed to turn data into value. Later, Data activism and social change (London, Palgrave) and Data activism and social change. Alliances, maps, platforms and action for a better world (Madrid: Dykinson) develop analytical frameworks based on real cases that offer ways to analyse other cases.
Accompanying the varied practices that exist within data activism, its study is creating spaces for feminist and post-colonialist research on the consequences of datification. Whereas the chroniclers of history (mainly male sources) defined technology in relation to the value of their productsfeminist data studies consider women as users and designers of technology as users and designers of algorithmic systems and seek to use data for equality, and to move away from capitalist exploitation and its structures of domination.
Data activism is now an established concept in social science. For example, Google Scholar offers more than 2,000 results on "data activism". Several researchers use it as a perspective to analyse various issues. For example, Rajão and Jarke explore environmental activism in Brazil; Gezgin studies critical citizenship and its use of data infrastructure; Lehtiniemi and Haapoja explore data agency and citizen participation; and Scott examines the need for platform users to develop digital surveillance and care for their personal data.
At the heart of these concerns is the concept of data agency, which refers to people not only being aware of the value of their data, but also exercising control over it, determining how it is used and shared. It could be defined as actions and practices related to data infrastructure based on individual and collective reflection and interest. That is, while liking a post would not be considered an action with a high degree of data agency, participating in a hackathon - a collective event in which a computer programme is improved or created - would be. Data agency is based on data literacy, or the degree of knowledge, access to data and data tools, and opportunities for data literacy that people have. Data activism is not possible without a data agency.
In the rapidly evolving landscape of the platform economy, the convergence of data activism, digital rights and data agency has become crucial. Data activism, driven by a growing awareness of the potential misuse of personal data, encourages individuals and collectives to use digital technology for social change, as well as to advocate for greater transparency and accountability on the part of tech giants. As more and more data generation and the use of algorithms shape our lives in areas such as education, employment, social services and health, data activism emerges as a necessity and a right, rather than an option.
____________________________________________________________________
Content prepared by Miren Gutiérrez, PhD and researcher at the University of Deusto, expert in data activism, data justice, data literacy and gender disinformation.
The contents and views reflected in this publication are the sole responsibility of its author.
Documentación
In the era of data, we face the challenge of a scarcity of valuable data for building new digital products and services. Although we live in a time when data is everywhere, we often struggle to access quality data that allows us to understand processes or systems from a data-driven perspective. The lack of availability, fragmentation, security, and privacy are just some of the reasons that hinder access to real data.
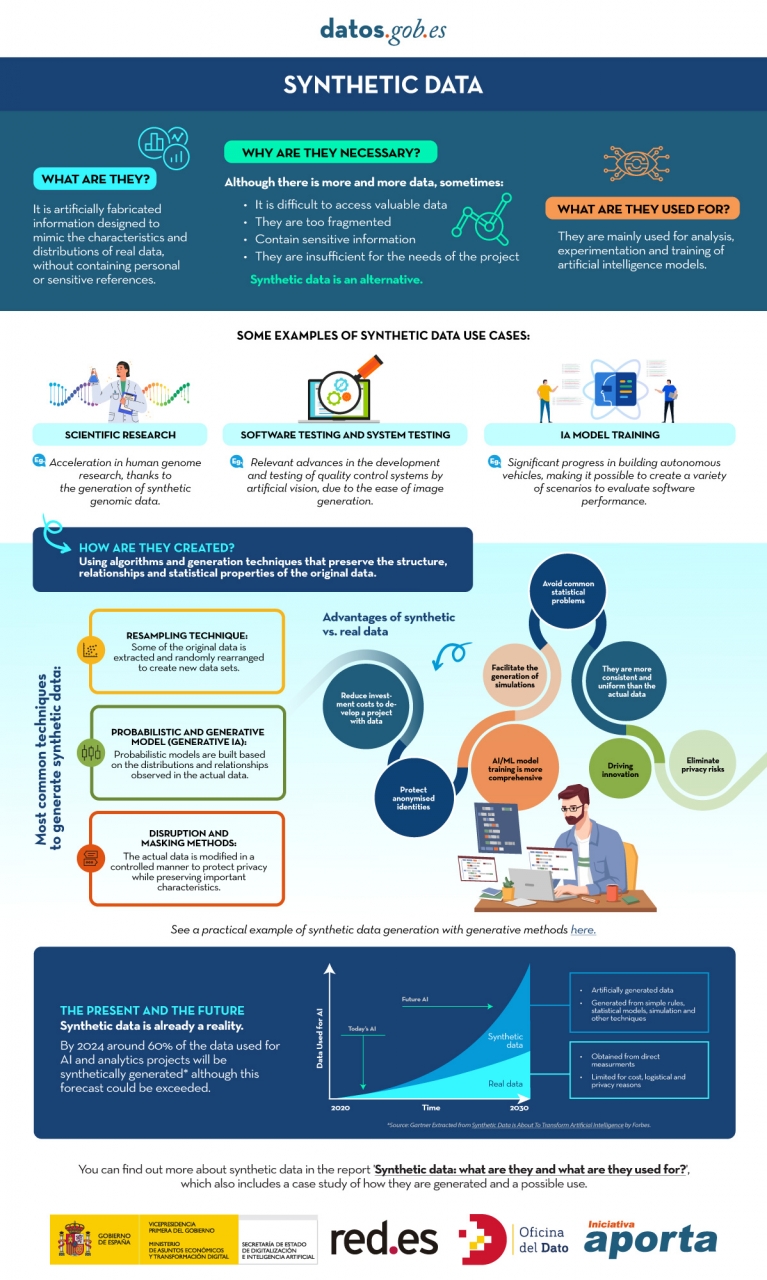
However, synthetic data has emerged as a promising solution to this problem. Synthetic data is artificially created information that mimics the characteristics and distributions of real data, without containing personal or sensitive information. This data is generated using algorithms and techniques that preserve the structure and statistical properties of the original data.
Synthetic data is useful in various situations where the availability of real data is limited or privacy needs to be protected. It has applications in scientific research, software and system testing, and training artificial intelligence models. It enables researchers to explore new approaches without accessing sensitive data, developers to test applications without exposing real data, and AI experts to train models without the need to collect all the real-world data, which is sometimes simply impossible to capture within reasonable time and cost.
There are different methods for generating synthetic data, such as resampling, probabilistic and generative modeling, and perturbation and masking methods. Each method has its advantages and challenges, but overall, synthetic data offers a secure and reliable alternative for analysis, experimentation, and AI model training.
It is important to highlight that the use of synthetic data provides a viable solution to overcome limitations in accessing real data and address privacy and security concerns. Synthetic data allows for testing, algorithm training, and application development without exposing confidential information. However, ensuring the quality and fidelity of synthetic data is crucial through rigorous evaluations and comparisons with real data.
In this report, we provide an introductory overview of the discipline of synthetic data, illustrating some valuable use cases for different types of synthetic data that can be generated. Autonomous vehicles, DNA sequencing, and quality controls in production chains are just a few of the cases detailed in this report. Furthermore, we highlight the use of the open-source software SDV (Synthetic Data Vault), developed in the academic environment of MIT, which utilizes machine learning algorithms to create tabular synthetic data that imitates the properties and distributions of real data. We present a practical example in a Google Colab environment to generate synthetic data about fictional customers hosted in a fictional hotel. We follow a workflow that involves preparing real data and metadata, training the synthesizer, and generating synthetic data based on the learned patterns. Additionally, we apply anonymization techniques to protect sensitive data and evaluate the quality of the generated synthetic data.
In summary, synthetic data is a powerful tool in the data era, as it allows us to overcome the scarcity and lack of availability of valuable data. With its ability to mimic real data without compromising privacy, synthetic data has the potential to transform the way we develop AI projects and conduct analysis. As we progress in this new era, synthetic data is likely to play an increasingly important role in generating new digital products and services.
If you want to know more about the content of this report, you can watch the interview with its author.
Below, you can download the full report, the executive summary and a presentation-summary.
Blog
Aspects as relevant to our society as environmental sustainability, climate change mitigation or energy security have led to the energy transition taking on a very important role in the daily lives of nations, private and public organisations, and even in our daily lives as citizens of the world. The energy transition refers to the transformation of our energy production and consumption patterns towards less dependence on fossil fuels through low or zero carbon sources, such as renewable sources.
The measures needed to achieve a real transition are far-reaching and therefore complex. In this process, open data initiatives can contribute enormously by facilitating public awareness, improving the standardisation of metrics and mechanisms to measure the impact of measures taken to mitigate climate change globally, promoting the transparency of governments and companies in terms ofCO2emission reductions, or increasing the participation of citizens in the process citizen and scientific and scientific participation for the creation of new digital solutions, as well as the advancement of knowledge and innovation.
What initiatives are providing guidance?
The best way to understand how open data helps us to observe the effects of highCO2 emissions as well as the impact of different measures taken by all kinds of actors in favour of the energy transition is by looking at real examples.
The Energy Institute (IE), an organisation dedicated to accelerating the energy transition, publishes its annual World Energy Statistical Review, which in its latest version includes up to 80 datasets, some dating back as far as 1965, describing the behaviour of different energy sources as well as the use of key minerals in the transition to sustainability. Using its own online reporting tool to represent those variables we want to analyse, we can see how, despite the exponential growth of renewable energy generation in recent years (figure 1), there is still an increasing trend inCO2emissions (figure 2), although not as drastic as in the first decade of the 2000s.
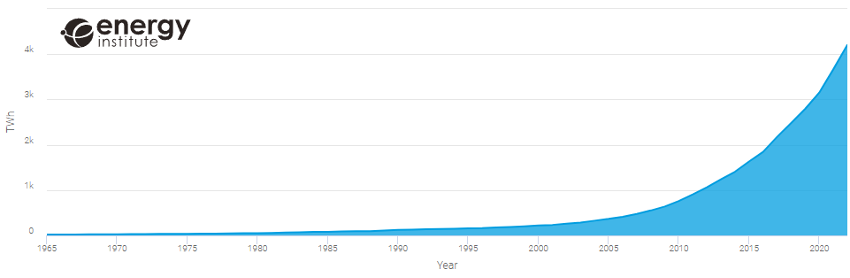
Figure 1: Evolution of global renewable generation in TWh.
Source: Energy Institute Statistical Review 2023
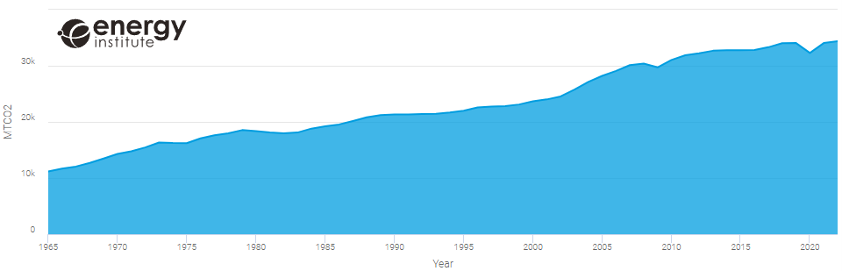
Figure 2: Evolution of global CO2 emissions in MTCO2
Source: Energy Institute Statistical Review 2023
Another international energy transition driver that offers an interesting catalogue of data is the International Energy Agency (IEA). In this case we can find more than 70 data sets, not all of them open without subscription, which include both historical energy data and future projections in order to reach the Net Zero 2050targets. The following is an example of this data taken from their library of graphical displays, in particular the expected evolution of energy generation to reach the Net Zero targets in 2050. In Figure 3 we can examine how, in order to achieve these targets, two main simultaneous processes must occur: reducing the total annual energy demand and progressively moving to lowerCO2emitting generation sources.
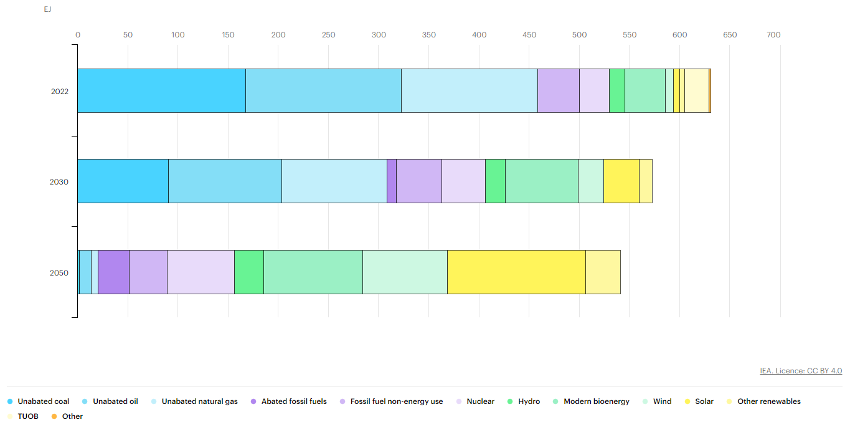
Figure 3: Energy generation 2020-2050 to achieve Net Zero emissions targets in Exajulios.
Source: IEA, Total energy supply by source in the Net Zero Scenario, 2022-2050, IEA, Paris, IEA. Licence: CC BY 4.0
To analyse in more detail how these two processes must happen in order to achieve the Net Zero objectives, IEA offers another very relevant visualisation (figure 4). In it, we can see how, in order to achieve the reduction of the total annual energy demand, it is necessary to make accelerated progress in the decade 2025-2035, thanks to measures such as electrification, technical improvements in the efficiency of energy systems or demand reduction. In this way, a reduction of close to 100EJs per year should be achieved by 2035, which should then be maintained throughout the rest of the period analysed. To try to understand the significance of these measures and taking as a reference the average electricity consumption of Spanish households, some 3,500kWh/year, the desired annual reduction would be equivalent to avoiding the consumption of some 7,937,000,000 households or, in other words, to avoiding in one year the electricity consumption that all Spanish households would consume for 418 years.
ith respect to the transition to lower emission sources, we can see in this figure how the expectation is that solar energy will be the leader in growth, ahead of wind energy, while unabated coal (energy from burning coal without usingCO2capture systems) is the source whose use is expected to be reduced the most.
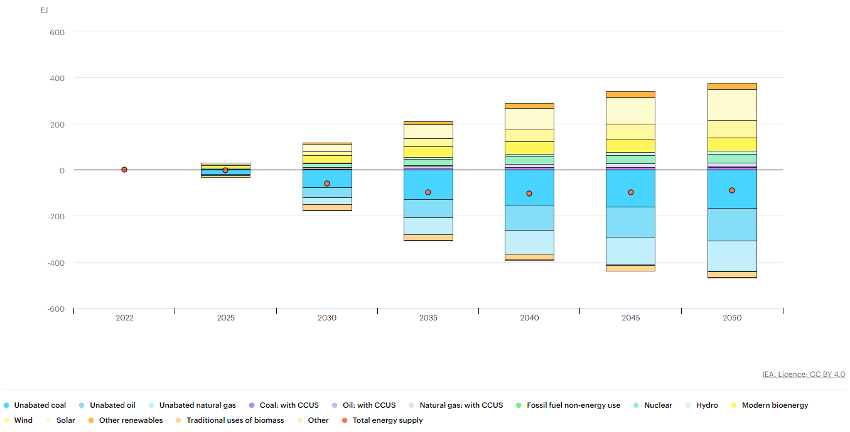
Figure 4: Changes in energy generation 2020-2050 to achieve Net Zero emissions targets in Exajulios.
Source: IEA, Changes in total energy supply by source in the Net Zero Scenario, 2022-2050, IEA, Paris, IEA. Licence: CC BY 4.0
Other interesting open data initiatives from an energy transition perspective are the catalogues of the European Commission (more than 1.5 million datasets) and of the Spanish Government through datos.gob.es (more than 70 thousand datasets). Both provide open datasets on topics such as environment, energy or transport.
In both portals, we can find a wide variety of information, such as energy consumption of cities and companies, authorised projects for the construction of renewable generation facilities or the evolution of hydrocarbon prices.
Finally, the REDatainitiative of Red Eléctrica Española (REE)offers a data area with a wide range of information related to the Spanish electricity system. Among others, information related to electricity generation, markets or the daily behaviour of the system.
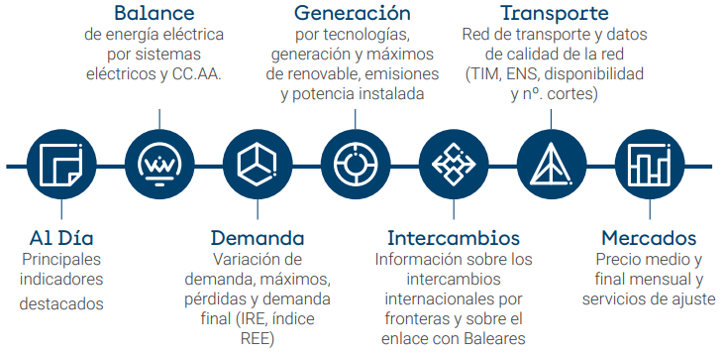
Figure 5: Sections of information provided from REData
Source: El sistema eléctrico: Guía de uso de REData, November 2022. Red Eléctrica Española.
The website also offers an interactive viewer for consulting and downloading data, as shown below for electricity generation, as well as a programmatic interface (API - Application Programming Interface) for consulting the data repository provided by this entity.

Figure 6: REE REData Platform
Source: https://www.ree.es/es/datos/aldia
What conclusions can we draw from this movement?
As we have been able to observe, the enormous concern about the energy transition has motivated multiple organisations of different types to make data openly available for analysis and use by other organisations and the general public. Entities as varied as the Energy Institute, the International Energy Agency, the European Commission, the Spanish Government and Red Eléctrica Española publish valuable information through their data portals in search of greater transparency and awareness.
In this short article we have been able to examine how these data have been of great help to better understand the historical evolution ofCO2emissions, the installed wind power capacity or the expectations of energy demand to reach the Net Zero targets. Open data is a very good tool to improve the understanding of the need and depth of the energy transition, as well as the progress of the measures that are progressively being taken by multiple entities around the world, and we expect to see an increasing number of initiatives along these lines.
Content prepared by Juan Benavente, senior industrial engineer and expert in technologies linked to the data economy. The contents and points of view reflected in this publication are the sole responsibility of the author.