Blog
After months of new developments, the pace of advances in artificial intelligence does not seem to be slowing down - quite the contrary. A few weeks ago, when reviewing the latest developments in this field on the occasion of the 2023 deadline, video generation from text instructions was considered to be still in its infancy. However, just a few weeks later, we have seen the announcement of SORA. With this tool, it seems that the possibility to generate realistic videos, up to one minute long, from textual descriptions is here.
Every day, the tools we have access to become more sophisticated and we are constantly amazed by their ability to perform tasks that once seemed exclusive to the human mind. We have quickly become accustomed to generating text and images from written instructions and have incorporated these tools into our daily lives to enhance and improve the way we do our jobs. With each new development, pushing the boundaries a little further than we imagined, the possibilities seem endless.
Advances in Artificial Intelligence, powered by open data and other technologies such as those associated with the Web3, are helping to rethink the future of virtually every field of our activity: from solutions to address the challenges of climate change, to artistic creation, be it music, literature or painting[6], to medical diagnosis, agriculture or the generation of trust to drive the creation of social and economic value.
In this article we will review the developments that impact on a field where, in the coming years, interesting advances are likely to be made thanks to the combination of artificial intelligence and open data. We are talking about the design and planning of smarter, more sustainable and liveable cities for all their inhabitants.
Urban Planning and Management
Urban planning and management is complicated because countless complex interactions need to be anticipated, analysed and resolved. Therefore, it is reasonable to expect major breakthroughs from the analysis of the data that cities increasingly open up on mobility, energy consumption, climatology and pollution, planning and land use, etc. New techniques and tools provided by generative artificial intelligence combined, for example, with intelligent agents will allow a deeper interpretation and simulation of urban dynamics.
In this sense, this new combination of technologies could be used for example to design more efficient, sustainable and liveable cities, anticipating the future needs of the population and dynamically adapting to changes in real time. Thus, new smart urban models would be used to optimise everything from traffic flow to resource allocation by simulating behaviour through intelligent agents.

Figure 1: Images generated by Urbanistai.com
Urbanist.ai is one of the first examples of an advanced urban analytics platform, based on generative artificial intelligence, that aims to transform the way urban planning tasks are currently conceived. The services it currently provides already allow the participatory transformation of urban spaces from images, but its ambition goes further and it plans to incorporate new techniques that redefine the way cities are planned. There is even a version of UrbanistAI designed to introduce children to the world of urban planning.
Going one step further, the generation of 3D city models is something that tools such as InfiniCity have already made available to users. Although there are still many challenges to be overcome, the results are promising. These technologies could make it substantially cheaper to generate digital twins on which to run simulations that anticipate problems before they are built.
Available data
However, as with other developments based on Generative AI, these issues would not be possible without data, and especially not without open data. All new developments in AI use a combination of private and public data in their training, but in few cases is the training dataset known with certainty, as it is not made public. Data can come from a wide variety of sources, such as IoT sensors, government records or public transport systems, and is the basis for providing a holistic view of how cities function holistic view of how cities function and how and how their inhabitants interact with the urban environment.
The growing importance of open data in training these models is reflected in initiatives such as the Task Force on AI Data Assets and Open Government, launched by the US Department of Commerce, which will be tasked with preparing open public data for Artificial Intelligence. This means not only machine-readable formats, but also machine-understandable metadata. With open data enriched by metadata and organised in interpretable formats, artificial intelligence models could yield much more accurate results.
A long-established and basic data source is OpenStreetmap (OSM), a collaborative project that makes a free and editable map of open global geographic dataavailable to the community. It includes detailed information on streets, squares, parks, buildings, etc. which is crucial as a basis for urban mobility analysis, transport planning or infrastructure management. The immense cost of developing such a resource is only within the reach of large technology companies, making it invaluable to all initiatives that use it as a basis.

Figure 2: OpenStreetmap Images (OSM)
More specific datasets such as HoliCity, a 3D data asset with rich structural information, including 6,300 real-world views, are proving valuable. For example, recent scientific work based on this dataset has shown that it is possible for a model fed with millions of street images to predict neighbourhood characteristics, such as home values or crime rates.
Along these lines, Microsoft has released an extensive collection of building contours automatically generated from satellite imagery, covering a large number of countries and regions.

Figure 3: Urban Atlas Images (OSM)
Microsoft Building Footprints provide a detailed basis for 3D city modelling, urban density analysis, infrastructure planning and natural hazard management, giving an accurate picture of the physical structure of cities.
We also have Urban Atlas, an initiative that provides free and open access to detailed land use and land cover information for more than 788 Functional Urban Areas in Europe. It is part of the Copernicus Land Monitoring Serviceprogramme, and provides valuable insights into the spatial distribution of urban features, including residential, commercial, industrial, green areas and water bodies, street tree maps, building block height measurements, and even population estimates.
Risks and ethical considerations
However, we must not lose sight of the risks posed, as in other domains, by the incorporation of artificial intelligence into the planning and management of cities, as discussed in the UN report on "Risks, Applications and Governance of AI for Cities". For example, concerns about privacy and security of personal information raised by mass data collection, or the risk of algorithmic biases that may deepen existing inequalities. It is therefore essential to ensure that data collection and use is conducted in an ethical and transparent manner, with a focus on equity and inclusion.
This is why, as city design moves towards the adoption of artificial intelligence, dialogue and collaboration between technologists, urban planners, policy makers and society at large will be key to ensuring that smart city development aligns with the values of sustainability, equity and inclusion. Only in this way can we ensure that the cities of the future
are not only more efficient and technologically advanced, but also more humane and welcoming for all their inhabitants.
Content prepared by Jose Luis Marín, Senior Consultant in Data, Strategy, Innovation & Digitalization. The contents and views reflected in this publication are the sole responsibility of the author.
Documentación
The Sustainable Development Goals (SDGs) are a set of targets adopted by the international community aimed at addressing the most pressing challenges of our time. These goals were born simultaneously with the Global Partnership for Sustainable Development Data and the International Open Data Charter, which provided a coalition of experts willing to harness the benefits of open data for the new development agenda.
In this regard, open data plays a very relevant role within the development agenda as indicators of progress towards the SDGs, as they allow measuring and evaluating their progress, as well as improving accountability through sharing that data with the rest of the community, providing great value in multiple ways:
- Facilitating decision-making when designing policies and strategies to help meet the objectives;
- Identifying inequalities and specific challenges among different regions or population groups;
- Improving efficiency in policy and program implementation;
- As an engine of innovation through research and development.
Today, there are large global databases, both generalist and thematic, that we can use for these purposes, in addition to all the national data sources available in our own country. However, there is still a long way to go in this regard: the proportion of SDG indicators that are conceptually clear and have good national coverage is still 66%, according to the latest SDG progress report published in 2023. This leads us to continue facing data gaps in vital areas such as poverty, hunger, education, equality, sustainability, climate, seas, and justice, among others. Additionally, there is also a fairly general and significant lack of data disaggregated by age and/or sex, making it very difficult to properly monitor the potential progress of the objectives regarding the most vulnerable population groups.
This report takes a journey through the dual role that open data plays in supporting national and global progress in achieving the SDGs. The first part of the report focuses on the better-known role of open data as mere indicators when measuring progress towards the objectives, while the second part addresses its role as a key tool and fundamental raw material for the development of society in general and for the achievement of the objectives themselves in particular. To this end, it explores which datasets could have the greatest potential in each case, showing some practical examples, both national and at the European level, in various specific development objectives.
If you want to learn more about the content of this report, you can watch the interview with its author.
Noticia
The awards ceremony for the seventh edition of the Castilla y León open data competition was held on Monday 12 February seventh edition of the Castilla y León open data competition, which aims to recognise and value the good use of open dataas well as promoting and encouraging its use and exploitation.
The competition, which has been running since 2016, aims to to raise interest in open data and the and the multiple economic possibilities associated with it. In this way, the initiative, organised by the Regional Ministry of the Presidency of the Junta de Castilla y Leónthe initiative, organised by the Regional Ministry of the Presidency of Castile and Leon, recognises projects that generate ideas, studies, services, websites or mobile applications. As has been the case in previous editions, the common denominator of the entries in this competition is the use of datasets from the Open Data Portal of the Junta de Castilla y León.
Thirty-two entries were submitted in this call, of which eight were awarded in one of the four categories eight of them have been awarded in one of the four categories: Ideas, Products and Services, Didactic Resource and Data Journalism.
Eight award-winning projects in this edition of the competition
The winners in the different categories, chosen from the 32 entries submitted, were:
Category Ideas:
- First prize of 1500 €: Health supply in Castilla y León / Dashboard - Author: Almudena María Moreno Maderuelo.
- Scorecard related to public health in Castilla y León, based on open data.
- Second prize of 500 €: "Geographical names and their oral transmission" - Author: Guillermo Herrero Gacimartín.
- An idea to take advantage of open data to promote the conservation and dissemination of the wealth of geographical names and histories of the peoples of our autonomous community.
Category Products and Services:
- First prize of 2500 €: EnergyCyl. Boosting energy efficiency through energy analysis in Castilla y León - Author: David Aparicio Sanz.
- Web application that compiles, analyses and provides detailed information on the energy sector in the autonomous community of Castilla y León.
- Second prize 1500 €: Active Territories Project.Webmapping for the characterisation and sustainable promotion of innovative initiatives in the rural environment of Castilla y León - Authors: Víctor Pérez Eguíluz, María A. Castrillo Romón, Elvira Khairulina, José Luis Lalana Soto and Enrique Rodrigo González.
- Website of the "Territorios Activos" project to study innovation in the context of rural environments in the autonomous community of Castilla y León.
- Third prize 500 €: Anomalous pattern monitoring for operational optimisation of logistics infrastructures - Author: Unai Beristain.
- Open data and IoT solution for logistics management and early detection of anomalous patterns in logistics infrastructures. 3D web map based on open data.
- Student prizes of €1500: Offers for young people in Castilla y León - Authors: Ismael Martín Moakil, Alberto Herrero Jiménez, Oscar Antona Gutierrez, Daniel Herranz Herranz, Alberto Aguilar García, Joel Garrido Hernández, Rafael Martín Domínguez and Alonso Gallego. IES Alonso de Madrigal (Ávila).
- App for Android that allows you to find out about discounts and promotions for young people with the Carnet Joven de Castilla y León (Youth Card of Castilla y León)
Didactic Resource Category:
- First prize: 1500 €: CHEST: an application to support the creation and reuse of ubiquitous educational experiences related to cultural heritage around the world - Authors: Pablo García Zarza, Guillermo Vega Gorgojo, Miguel L. Bote Lorenzo, Juan I. Asensio Pérez, Eduardo Gómez Sánchez and Yannis Dimitriadis.
- Application to support teachers in the design and implementation of ubiquitous learning when teaching subjects related to cultural heritage.
Data Journalism Category:
- First prize of 1500 €: what is life like without a bar? How the villages manage to play the game - Authors: Ana Isabel Ruíz Espinar, Marta Ley and Guillermo Cid.
- Journalistic article that analyses how the existence of hotel and catering establishments affects the municipalities of Castilla y León.
The Junta de Castilla y León has published a list of all the projects that entered the competition, available on its website: https://datosabiertos.jcyl.es/web/es/concurso-datos-abiertos/proyectos-presentados.html
During the awards ceremony, the Minister of the Presidency of the Junta de Castilla y León, Luis Miguel González Gago, insisted on the premise of continuing to improve the presentation and accessibility of open data accessibility of open data. In this sense, the aim is to improve the visualisation of the data presented by all the departments of the Junta de Castilla y León, which in a homogeneous and coordinated way will use the same presentation schemes so that they can be easily located, understood and interpreted easily located, understood and interpreted by citizens by citizens. A commitment to interoperability.
Application
This mobile application developed by the City Council of Ourense allows you to consult updated information about the city: news, notices or upcoming events on different topics such as:
- Arts and festivities: Cultural events organized by the city council.
- Tourism: Information about thermal facilities, tourist attractions, heritage, routes and gastronomy.
- Notifications: Real time notifications about possible traffic cuts, opening of monuments or other specific issues.
- Information: Data of general interest such as emergency telephone numbers or citizen services of the city council.
The mOUbil app, developed through local open data sets, unifies all the information of interest to the neighbors of Ourense, as well as tourists who want to know the city. In addition, anyone can make suggestions for improvement on the application through this form: Queries and Suggestions (ourense.gal).
Your download is available for both Android mOUbil - Ourense no peto! - Apps in Google Play and iOS: moubil - Ourense no peto! in App Store (apple.com)
Blog
The Spanish Federation of Municipalities and Provinces (FEMP) approved at the end of 2023 two model ordinances that address progress in two key areas: transparency and data governance. Both documents will not only improve the quality of processes, but also facilitate access, management and re-use of data. In this post, we will analyse the second ordinance drafted within the FEMP's Network of Entities for Transparency and Citizen Participation in its quest to define common reference models. In particular, the ordinance on data governance.
The usefulness and good work of the Model Ordinance on Data Governance in Local Entities has been highlighted by the Multisectoral Association of Information (ASEDIE), which awarded it the prize in the category 'Promoting data literacy' at its 15th ASEDIE International Conference.
Under this premise, the document addresses all elements related to the collection, management and exploitation of data in order to approach them as a commongood, i.e. ensuring their openness, accessibility and re-use. This is a relevant objective for local administrations, as it enables them to improve their functioning, service delivery and decision-making. Data governance is the framework that guides and guarantees this process and this ordinance proposes a flexible regulatory framework that different administrations can adapt according to their specific needs.
What is data governance?
Data Governance comprehensively addresses all aspects related to the collection, management and exploitation of data, as well as its openness and re-use by society as a whole on an equal basis. Itcan therefore bedefined as an organisational function responsible for being accountable for the effective, efficient and acceptable use of databy the organisation, which is necessary to deliver the business strategy. This is described in the specifications UNE 0077:2023 on Data Governance and UNE 78:2023 on Data Management, which include standardised processes to guide organisations in the establishment of approved and validated mechanisms that provide organisational support to aspects related to the opening and publication of data, for subsequent use by citizens and other institutions.
How was the FEMP Data Governance Ordinance developed?
In order to develop the Model Ordinance on Data Governance in the Local Entity, a multidisciplinary working group was set up in 2022, which included workers from the Public Administrations, private companies, representatives of the infomediary sector, the Data Office, universities, etc. This team set out two main objectives that would mark the content of the document:
- Develop guidelines for municipalities and other public authorities defining the strategy to be followed in order to implement an open data project.
- Create a reference model of datasets common to all public administrations to facilitate the re-use of information.
With these two challenges in mind, in early 2023 the FEMP working group started to establish aspects, structure, contents and work plan. During the following months, work was carried out to draft, elaborate and reach consensus on a single draft.
In addition, a participatory process was organised on the Idea Zaragoza platform to nurture the document with contributions from experts from all over the country and FEMP partners.
The result of all the work was based on the Open Data Charter (ODC), the recommendations issued by the Spanish Government's Data Office and the existing European and national regulations on this matter.
New features and structure of the Data Governance Ordinance
The FEMP's Model Ordinance on Data Governance is in line with the context in which it has been presented, i.e. it recognises relevant aspects of the current moment we are living in. One of the document's salient features is the premise of guaranteeing and enhancing the rights of both natural and legal persons and respecting the General Data Protection Regulation. The regulation places particular emphasis on the proportionality of anonymisation to ensure the privacy of individuals.
Another novel aspect of the standard is that it brings the vision of high-value data defined by the European Commission from the perspective of local government. In addition, the Model Ordinance recognises a single regime for access and re-use of public information, in accordance with Law 19/2013 of 9 December on transparency, access to public information and good governance, and Law 37/2007 on the re-use of public sector information.
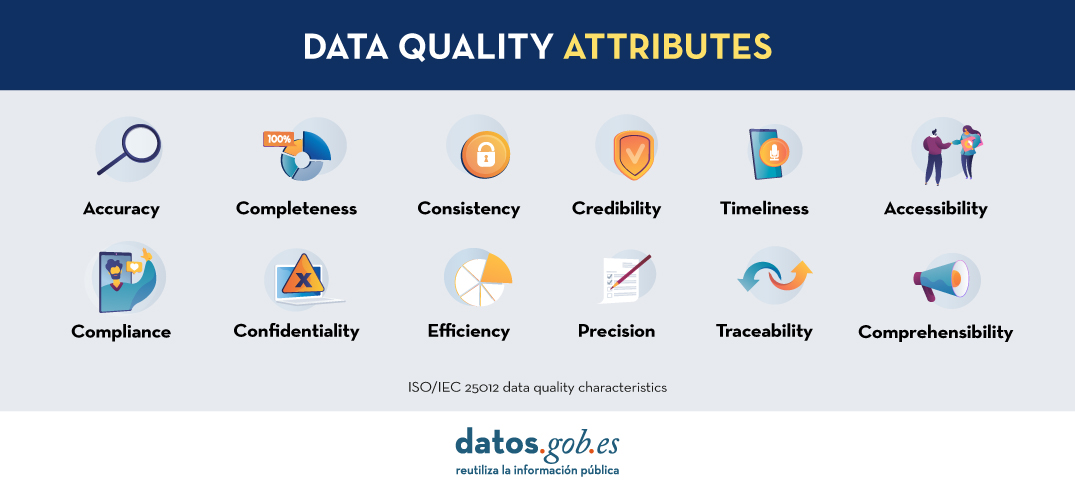
Beyond ensuring the legal and regulatory framework, the FEMP Ordinance also addresses the data associated with artificial intelligence, a cutting-edge technological synergy that every day offers great innovative solutions. For an artificial intelligence to function properly, it is necessary to have quality data to help train it. In relation to this point, the ordinance defines quality requirements (Article 18) and metrics for their assessment that are adapted to each specific context and address issues such as accuracy, portability or confidentiality, among others. The document establishes guarantees that the use of the data will be carried out in a way that respects the rights of individuals.
All these new aspects are part of the FEMP's Model Ordinance on Data Governance for Local Entities, which is organised in the following structure:
- General provisions: This first section presents data as the main digital asset of Public Administrations as a strategic asset, and the object, principles and right of citizenship.
- Planning, organisation and tools for data governance: Here the organisation and competencies for data governance are defined. In addition, the importance of maintaining an inventory of datasets and information sources is stressed (Article 9).
- The data: This chapter recognises the publication requirements and security standards, the importance of the use of reference vocabularies, and the categories of datasets whose openness should be prioritised, namely the 80 typologies referred to by FEMP as most relevant.
- Life cycle: This section highlights, on the one hand, the collection, opening, storage and use of data; and, on the other hand, the limits, deletion and destruction of data when these actions are required. when these actions are required.
- Access, publication and re-use: The fifth chapter deals with issues related to the exploitation of data such as the use of specific licences, exclusive rights, payment for re-use or prior request for access to certain datasets.
- Liability and guarantees: The last point describes the sanctioning and disciplinary regime and the civil and criminal liabilities of the re-user.
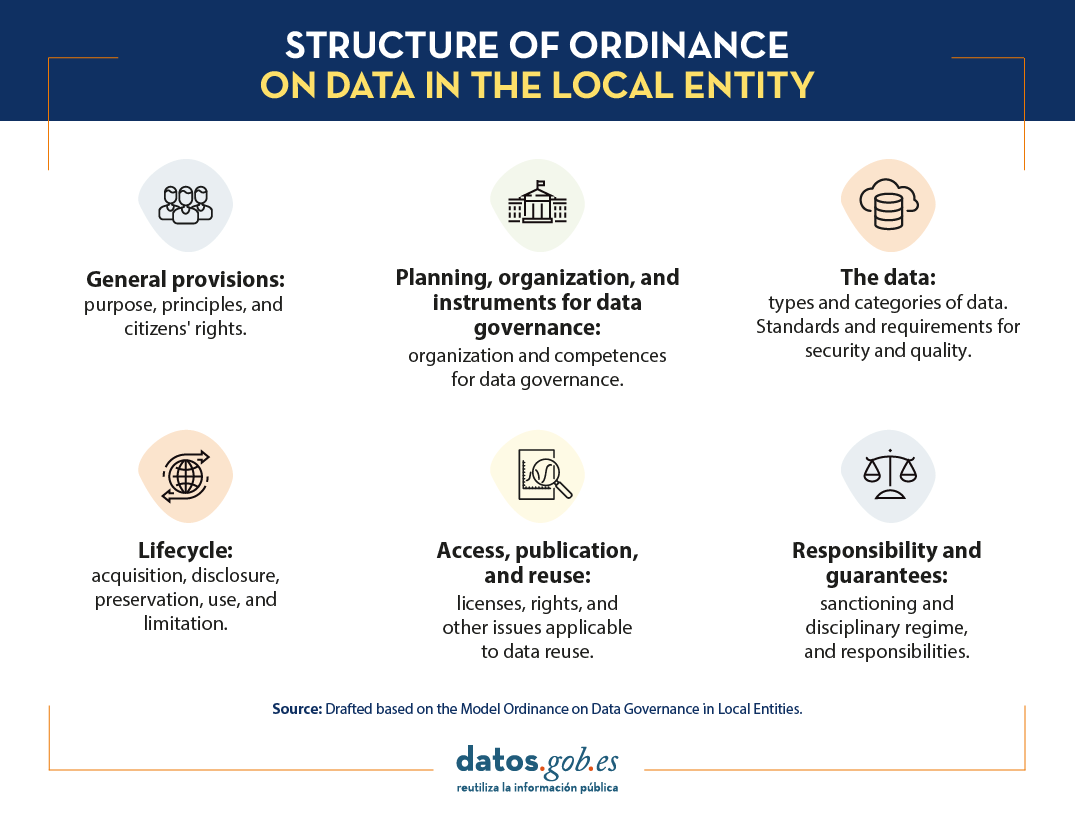
In short, the publication of the Ordinance on Data Governance in Local Entities provides local administrations with a flexible regulation and defines administrative structures that seek to improve management, reuse and the promotion of a data-driven society.
You can access the full document here: Standard Ordinance on Data Governance in the Local Entity
Noticia
The Centre de documentació i biblioteca del Institut Català d'Arqueologia Clàssica (ICAC) has the repository Open Science ICAC. This website is a space where science is shared in an accessible and inclusive way. The space introduces recommendations and advises on the process of publishing content. Also, on how to make the data generated during the research process available for future research work.
The website, in addition to being a repository of scientific research texts, is also a place to find tools and tips on how to approach the research data management process in each of its phases: before, during and at the time of publication.
- Before you begin: create a data management plan to ensure that your research proposal is as robust as possible. The Data Management Plan (DMP) is a methodological document that describes the life cycle of the data collected, generated and processed during a research project, a doctoral thesis, etc.
- During the research process: at this point it points out the need to unify the nomenclature of the documents to be generated before starting to collect files or data, in order to avoid an accumulation of disorganised content that will lead to lost or misplaced data. In addition, this section provides information on directory structure, folder names and file names, the creation of a txt file (README) describing the nomenclatures or the use of short, descriptive names such as project name/acronym, file creation date, sample number or version number. Recommendations on how to structure each of these fields so that they are reusable and easily searchable can also be found on the website.
- Publication of research data: in addition to the results of the research itself in the form of a thesis, dissertation, paper, etc., it recommends the publication of the data generated by the research process itself. The ICAC itself points out that research data remains valuable after the research project for which it was generated has ended, and that sharing data can open up new avenues of research without future researchers having to recreate and collect identical data. Finally, it outlines how, when and what to consider when publishing research data.
Graphical content for improving the quality of open data
Recently, the ICAC has taken a further step to encourage good practice in the use of open data. To this end, it has developed a series of graphic contents based on the "Practical guide for the improvement of the quality of open data"produced by datos.gob.es. Specifically, the cultural body has produced four easy-to-understand infographics, in Catalan and English, on good practices with open data in working with databases and spreadsheets, texts and docs and CSV format.
All the infographics resulting from the adaptation of the guide are available to the general public and also to the centre's research staff at Recercat, Catalonia's research repository. Soon it will also be available on the Open Science website of the Institut Català d'Arqueologia Clàssica (ICAC)open Science ICAC.
The infographics produced by the ICAC review various aspects. The first ones contain general recommendations to ensure the quality of open data, such as the use of standardised character encoding, such as UTF-8, or naming columns correctly, using only lowercase letters and avoiding spaces, which are replaced by hyphens. Among the recommendations for generating quality data, they also include how to show the presence of null or missing data or how to manage data duplication, so that data collection and processing is centralised in a single system so that, in case of duplication, it can be easily detected and eliminated.
The latter deal with how to set the format of thenumerical figures and other data such as dates, so that they follow the ISO standardised system, as well as how to use dots as decimals. In the case of geographic information, as recommended by the Guide, its materials also include the need to reserve two columns for inserting the longitude and latitude of the geographic points used.
The third theme of these infographics focuses on the development of good databases or spreadsheets databases or spreadsheetsso that they are easily reusable and do not generate problems when working with them. Among the recommendations that stand out are consistency in generating names or codes for each item included in the data collection, as well as developing a help guide for the cells that are coded, so that they are intelligible to those who need to reuse them.
In the section on texts and documents within these databases, the infographics produced by the Institut Català d'Arqueologia Clàssica include some of the most important recommendations for creating texts and ensuring that they are preserved in the best possible way. Among them, it points to the need to save attachments to text documents such as images or spreadsheets separately from the text document. This ensures that the document retains its original quality, such as the resolution of an image, for example.
Finally, the fourth infographic that has been made available contains the most important recommendations for working with CSV format working with CSV format (comma separated value) format, such as creating a CSV document for each table and, in the case of working with a document with several spreadsheets, making them available independently. It also notes in this case that each row in the CSV document has the same number of columns so that they are easily workable and reusable, without the need for further clean-up.
As mentioned above, all infographics follow the recommendations already included in the Practical guide for improving the quality of open data.
The guide to improving open data quality
The "Practical guide for improving the quality of open data" is a document produced by datos.gob.es as part of the Aporta Initiative and published in September 2022. The document provides a compendium of guidelines for action on each of the defining characteristics of quality, driving quality improvement. In turn, this guide takes the data.europe.eu data quality guide, published in 2021 by the Publications Office of the European Union, as a reference and complements it so that both publishers and re-users of data can follow guidelines to ensure the quality of open data.
In summary, the guide aims to be a reference framework for all those involved in both the generation and use of open data so that they have a starting point to ensure the suitability of data both in making it available and in assessing whether a dataset is of sufficient quality to be reused in studies, applications, services or other.
Blog
The Open Government Guide for Public Employees is a manual to guide the staff of public administrations at all levels (local, regional and state) on the concept and conditions necessary to achieve an "inclusive open government in a digital environment". Specifically, the document seeks for the administration to assume open government as a cross-cutting element of society, fostering its connection with the Sustainable Development Goals.
It is a comprehensive, practical and well-structured guide that facilitates the understanding and implementation of the principles of open government, providing examples and best practices that foster the development of the necessary skills to facilitate the long-term sustainability of open government.
What is open government?
The guide adopts the most widely accepted definition of open government, based on three axes:
- Transparency and access to information (vision axis): Refers to open access to public information to facilitate greater accountability.
- Citizen participation (voice axis): It offers the possibility for citizens to be heard and intervene to improve decision-making and co-creation processes in public policies.
- Collaboration (value axis): Focuses on cooperation within the administration or externally, with citizens or civil society organizations, through innovation to generate greater co-production in the design and implementation of public services.
This manual defines these axes and breaks them down into their most relevant elements for better understanding and application. According to the guide, the basic elements of open administration are:
- An integrity that cuts across all public action.
- Data are "the raw material of governments and public administrations" and, for this reason, must be made available to "any actor", respecting the limits established by law. The use of information and communication technologies (digital) is conceived as a "space for the expansion of public action", without neglecting the digital divide.
- The citizenry is placed at the center of open administration, because it is not only the object of public action, but also "must enjoy a leading role in all the dynamics of transparency, participation and collaboration".
- Sustainability of government initiatives.
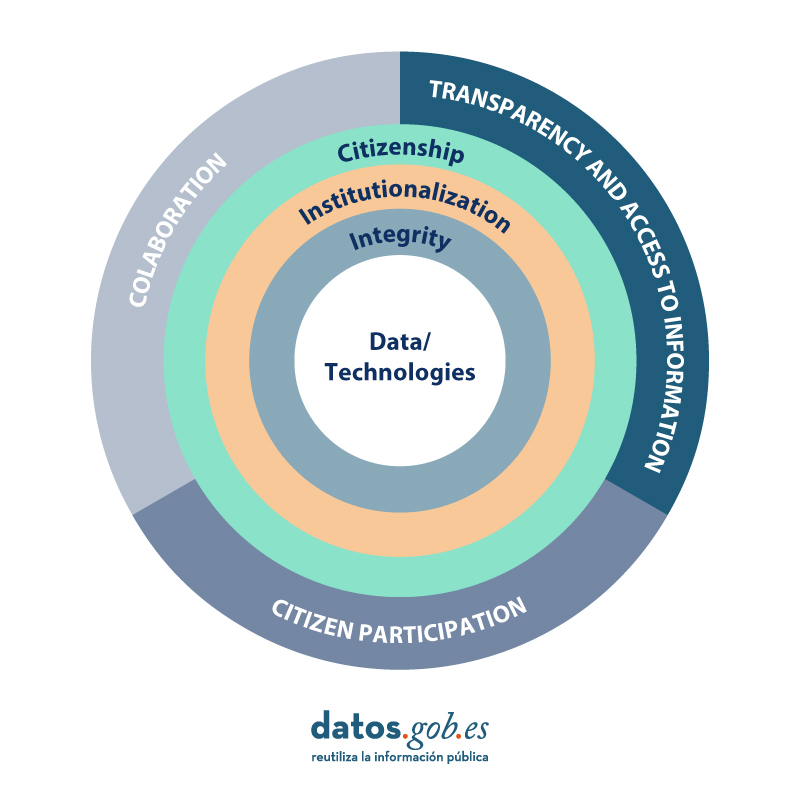
Adapted from a visual of the Open Government Guide for Public Employees. Source: https://funcionpublica.hacienda.gob.es/Secretaria-de-Estado-de-Funcion-Publica/Actualidad/ultimas-noticias/Noticias/2023/04/2023_04_11.html
Benefits of Open Government
With all this, a number of benefits are achieved:
-
Increased institutional quality and legitimacy
-
Increased trust in institutions
-
More targeted policies to serve citizens
- More equitable access to policy formulation
How can I use the guide?
The guide is very useful because, in order to explain some concepts, it poses challenges so that civil servants themselves can reflect on them and even put them into practice. The authors also propose cases that provide an overview of open government in the world and its evolution, both in terms of the concepts related to it and the laws, regulations, relevant plans and areas of application (including Law 19/2023 on transparency, the Digital Spain 2025 agenda, the Digital Rights Charter and the General Data Protection Regulation, known as RGPD). As an example, the cases he mentions include the Elkar-EKIN Social Inclusion Plan of the Provincial Council of Gipuzkoa and Frena La Curva, an initiative launched by members of the Directorate General of Citizen Participation and the LAAAB of the Government of Aragon during COVID-19.
The guide also includes a self-diagnostic test on accountability, fostering collaboration, bibliographical references and proposals for improvement.
In addition, it offers diagrams and summaries to explain and schematize each concept, as well as specific guidelines to put them into practice. For example, it includes the question "Where are the limits on access to public information? To answer this question, the guide cites the cases in which access can be given to information that refers to a person's ideology, beliefs, religious or union affiliation (p. 26). With adaptation to specific contexts, the manual could very well serve as a basis for organizing training workshops for civil servants because of the number of relevant issues it addresses and its organization.
The authors are right to also include warnings and constructive criticisms of the situation of open government in institutions. Although they do not point out directly, they talk about:
- Black boxes: they are criticized for being closed systems. It is stated that black boxes should be opened and made transparent and that "the representation of sectors traditionally excluded from public decisions should be increased".
- Administrative language: This is a challenge for real transparency, since, according to a study mentioned in the guide, out of 760 official texts, 78% of them were not clear. Among the most difficult to understand are applications for scholarships, grants and subsidies, and employment-related procedures.
- The existence of a lack of transparency in some municipalities, according to another study mentioned in the guide. The global open government index, elaborated by the World Justice Project, places Spain in 24th place, behind countries such as Estonia (14th), Chile (18th), Costa Rica (19th) or Uruguay (21st) and ahead of Italy (28th), Greece (36th) or Romania (51st), among 102 countries. Open Knowledge Foundation has stopped updating its Global Open Data Index, specifically on open data.
In short, public administration is conceived as a step towards an open state, with the incorporation of the values of openness in all branches of government, including the legislative and judicial branches, in addition to government.
Additional issues to consider
For those who want to follow the path to open government, there are a number of issues to consider:
-
The guide can be adapted to different spheres and scales of public. But public administration is not homogeneous, nor do the people in it have the same responsibilities, motivations, knowledge or attitudes to open government. A review of citizen use of open data in the Basque administration concluded that one obstacle to transparency is the lack of acceptance or collaboration in some sectors of the administration itself. A step forward, therefore, could be to conduct internal campaigns to disseminate the advantages for the administration of integrating citizen perspectives and to generate those spaces to integrate their contributions.
- Although the black box model is disappearing from the public administration, which is subject to great scrutiny, it has returned in the form of closed and opaque algorithmic systems applied to public administration. There are many studies in the scientific literature -for example, this one- that warn that erroneous opaque box systems may be operating in public administration without anyone noticing until harmful results are generated. This is an issue that needs to be reviewed.
- In order to adapt it to specific contexts, it should be possible to define more concretely what participation, collaboration and co-creation are. As the guide indicates, they imply not only transparency, but also the implementation of collaborative or innovative initiatives. But it is also necessary to ask a series of additional questions: what is a collaborative or innovation initiative, what methodologies exist, how is it organized and how is its success measured?
- The guide highlights the need to include citizens in open government. When talking about inclusion and participation, organized civil society and academia are mentioned above all, for example, in the Open Government Forum. But there is room for improvement to encourage individual participation and collaboration, especially for people with little access to technology. The guide mentions gender, territorial, age and disability digital divides, but does not explore them. However, when access to many public services, aid and assistance has been platformized (especially after the COVID-19 pandemic), such digital divides affect many people, especially the elderly, low-income and women. Since a generalist guide cannot address all relevant issues in detail, this would merit a separate guide.
Public institutions are increasingly turning to algorithmic decision-making for effective, fast and inclusive decision making. Therefore, it is also increasingly relevant to train the administration itself in open government in a digitized, digitized and platformized environment. This guide is a great first step for those who want to approach the subject.
Content prepared by Miren Gutiérrez, PhD and researcher at the University of Deusto, expert in data activism, data justice, data literacy and gender disinformation. The contents and views reflected in this publication are the sole responsibility of the author.
Noticia
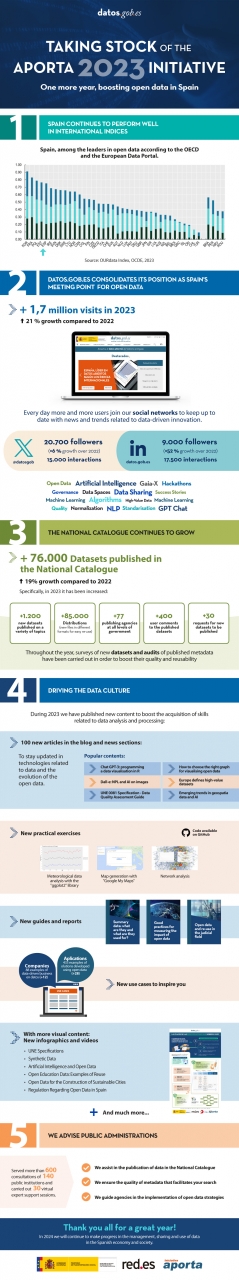
We are in the last days of the year, those hours that we all take advantage of to mentally review what the previous 12 months have given us. At the Aporta Initiative we are no exception and we want to take advantage of the fact that we are just over 72 hours away from eating our grapes to take stock of what we have done and what is yet to come.
2023 has been a great year for the entire community of data publishers and users. Artificial intelligence has been in the news on multiple occasions, gaining greater prominence not only at the business level: more and more citizens are beginning to understand the challenges and opportunities that lie ahead. In this context, the quantity and quality of available data has become a pressing need, as a driver of increasingly intelligent applications that help us to make progress as a society.
In this sense, Spain continues to do its homework and reap good results in international balances. In the last month we have known the results of two indexes that place Spain at the top of the openness and reuse of public information: the European Data Portal considers that Spain ranks fourth in terms of open data in the European Union, while the OECD ranks it fifth worldwide. To these must be added the Report on the State of the Digital Decade, whose scope is broader as it includes many other factors that influence digital transformation, and which also places Spain ahead of the average in digital infrastructures and capabilities.
datos.gob.es consolidates its position as the meeting point for Spain's open data community
1.700.000. That is the number of visits that datos.gob.es has received during the last year. A 21% more than in the same period of 2022. A figure that highlights the growing interest in open data in our country. This increase has also been reflected in social networks. The Twitter profile of the Aporta Initiative has consolidated its position as a channel for keeping up to date with news and trends related to data-driven innovation, attracting new users who have reported a growth of 6%, to close to 21,000 followers. Meanwhile, the growth of the community of data professionals around datos.gob.es has been reflected on LinkedIn, attracting 51% more users and reaching a total of 9,000.
This growth is marked by the incessant activity in favor of data sharing, openness and reuse carried out by the Aporta Initiative and reflected in the datos.gob.es platform:
-
The number of datasets in the National Data Catalog, hosted at datos.gob.es, has grown by 19%. As of today, users have at their disposal more than 76,000 datasets published by various organizations at national, regional and autonomous community level. Specifically, 77 new publishing organizations have been added. In addition, the datasets already published have been enriched, increasing by 85,000 the available distributions (i.e., the files in various formats in which the data are presented). To ensure its quality, the data.gob.es advisory team has handled more than 600 queries from 140 public institutions. In addition, audits have been carried out, as well as new surveys to promote the opening of new valuable data.
-
The platform has also continued to publish content prepared by various data experts, including aspects related to trends, regulation, success stories, best practices and technical specifications, among others. Specifically, more than 100 articles have been published, 40 examples of solutions and business models based on data (currently the catalog exceeds 500), as well as a multitude of new practical exercises, guides, reports and audiovisual content, such as infographics and videos.
New data trends
2024 looks set to be a very promising year in terms of data-related developments. In recent years we have seen great progress at the regulatory level, with various regulations that promote the opening and sharing of data. The most recent of these are the Data Governance Act (DGA), which became fully applicable in September, and the Data Act (DA), which was passed in November. This growing legal landscape means that during 2024 we face the challenge of achieving harmonized implementation to drive a European Digital Single Market.
This year will also see a major focus on the drive to build data spaces and developments in high-value data. Regarding the latter, June is the deadline for making available to citizens the data sets considered of high value and detailed in the implementing regulation published a year ago, following a series of technical requirements that facilitate their reuse. In addition, the European Commission is already working on a prospection to see possible categories that could be included as high-value data in the future.
In short, we are facing an exciting year, which will bring many new developments in the field of data, in order to promote not only the data economy but also to be the driving force behind advances that will have an impact on society as a whole.
Blog
The regulatory approach in the European Union has taken a major turn since the first regulation on the reuse of public sector information was promoted in 2003. Specifically, as a consequence of the European Data Strategy approved in 2020, the regulatory approach is being expanded from at least two points of view:
-
on the one hand, governance models are being promoted that take into account the need to integrate, from the design and by default, respect for other legally relevant rights and interests, such as the protection of personal data, intellectual property or commercial secrecy, as has happened in particular through the Data Governance Regulation;
-
on the other hand, extending the subjective scope of the rules to go beyond the public sector, so that obligations specifically aimed at private entities are also beginning to be contemplated, as shown by the approval in November 2023 of the Regulation on harmonized rules for fair access to and use of data (known as the Data Act).
In this new approach, data spaces take on a singular role, both in terms of the importance of the sectors they deal with (health, mobility, environment, energy...) and, above all, because of the important role they are called upon to play in facilitating the availability of large amounts of data, specifically in overcoming the technical and legal obstacles that hinder their sharing. In this regard, in Spain we already have a legal provision in this regard, which has materialized with the creation of a specific section in the Public Sector Procurement Platform.
The Strategy itself envisages the creation of "a common European data space for public administrations, in order to improve transparency and accountability of public spending and the quality of spending, fight corruption at both national and EU level, and address compliance needs, as well as support the effective implementation of EU legislation and encourage innovative applications". At the same time, however, it is recognized that "data concerning public procurement are disseminated through various systems in the Member States, are available in different formats and are not user-friendly", concluding the need, in many cases, to "improve the quality of the data".
Why a data space in the field of public procurement?
Within the activity carried out by public entities, public procurement stands out, whose relevance in the economy of the EU as a whole reaches almost 14% of GDP, so it is a strategic pole to boost a more innovative, competitive and efficient economy. However, as expressly recognized in the Commission's Communication Public Procurement: A Data Space to improve public spending, boost data-driven policy making and improve access to tenders for SMEs published in March 2023, although there is a large amount of data on public procurement, however "at the moment its usefulness for taxpayers, public decision-makers and public purchasers is scarce".
The regulation on public procurement approved in 2014 incorporated a strong commitment to the use of electronic media in the dissemination of information related to the call for tenders and the awarding of procedures, although this regulation suffers from some important limitations:
-
refers only to contracts that exceed certain minimum thresholds set at European level, which limits the measure to 20% of public procurement in the EU, so that it is up to the States themselves to promote their own transparency measures for the rest of the cases;
-
does not affect the contractual execution phase, so that it does not apply to such relevant issues as the price finally paid, the execution periods actually consumed or, among other issues, possible breaches by the contractor and, if applicable, the measures adopted by the public entities in this respect;
-
although it refers to the use of electronic media when complying with the obligation of transparency, it does not, however, contemplate the need for it to be articulated on the basis of open formats that allow the automated reuse of the information.
Certainly, since the adoption of the 2014 regulation, significant progress has been made in facilitating the standardization of the data collection process, notably by imposing the use of electronic forms for the above-mentioned thresholds as of October 25, 2023. However, a more ambitious approach was needed to "fully leverage the power of procurement data". To this end, this new initiative envisages not only measures aimed at decisively increasing the quantity and quality of data available, but also the creation of an EU-wide platform to address the current dispersion, as well as the combination with a set of tools based on advanced technologies, notably artificial intelligence.
The advantages of this approach are obvious from several points of view:
-
on the one hand, it could provide public entities with more accurate information for planning and decision-making;
-
on the other hand, it would also facilitate the control and supervision functions of the competent authorities and society in general;
-
and, above all, it would give a decisive boost to the effective access of companies and, in particular, of SMEs to information on current or future procedures in which they could compete.
What are the main challenges to be faced from a legal point of view?
The Communication on the European Public Procurement Data Space is an important initiative of great interest in that it outlines the way forward, setting out the potential benefits of its implementation, emphasizing the possibilities offered by such an ambitious approach and identifying the main conditions that would make it feasible. All this is based on the analysis of relevant use cases, the identification of the key players in this process and the establishment of a precise timetable with a time horizon up to 2025.
The promotion of a specific European data space in the field of public procurement is undoubtedly an initiative that could potentially have an enormous impact both on the contractual activity of public entities and also on companies and, in general, on society as a whole. But for this to be possible, major challenges would also have to be addressed from a legal perspective:
Firstly, there are currently no plans to extend the publication obligation to contracts below the thresholds set at European level, which would mean that most tenders would remain outside the scope of the area. This limitation poses an additional consequence, as it means leaving it up to the Member States to establish additional active publication obligations on the basis of which to collect and, if necessary, integrate the data, which could pose a major difficulty in ensuring the integration of multiple and heterogeneous data sources, particularly from the perspective of interoperability. In this respect, the Commission intends to create a harmonized set of data which, if they were to be mandatory for all public entities at European level, would not only allow data to be collected by electronic means, but also to be translated into a common language that facilitates their automated processing.
Secondly, although the Communication urges States to "endeavor to collect data at both the pre-award and post-award stages", it nevertheless makes contract completion notices voluntary. If they were mandatory, it would be possible to "achieve a much more detailed understanding of the entire public procurement cycle", as well as to encourage corrective action in legally questionable situations, both as regards the legal position of the companies that were not awarded the contracts and of the authorities responsible for carrying out audit functions.
Another of the main challenges for the optimal functioning of the European data space is the reliability of the data published, since errors can often slip in when filling in the forms or, even, this task can be perceived as a routine activity that is sometimes carried out without paying due attention to its execution, as has been demonstrated by administrative practice in relation to the CPVs. Although it must be recognized that there are currently advanced tools that could help to correct this type of dysfunction, the truth is that it is essential to go beyond the mere digitization of management processes and make a firm commitment to automated processing models that are based on data and not on documents, as is still common in many areas of the public sector. Based on these premises, it would be possible to move forward decisively from the interoperability requirements referred to above and implement the analytical tools based on emerging technologies referred to in the Communication.
The necessary adaptation of European public procurement regulations
Given the relevance of the objectives proposed and the enormous difficulty involved in the challenges indicated above, it seems justified that such an ambitious initiative with such a significant potential impact should be articulated on the basis of a solid regulatory foundation. It is essential to go beyond recommendations, establishing clear and precise legal obligations for the Member States and, in general, for public entities, when managing and disseminating information on their contractual activity, as has been proposed, for example, in the health data space.
In short, almost ten years after the approval of the package of directives on public procurement, perhaps the time has come to update them with a more ambitious approach that, based on the requirements and possibilities of technological innovation, will allow us to really make the most of the huge amount of data generated in this area. Moreover, why not configure public procurement data as high-value data under the regulation on open data and reuse of public sector information?
Content prepared by Julián Valero, Professor at the University of Murcia and Coordinator of the Research Group "Innovation, Law and Technology" (iDerTec). The contents and points of view reflected in this publication are the sole responsibility of its author.
Evento
ASEDIE, Asociación Multisectorial de la Información, will hold its usual International Conference on the Reuse of Public Sector Information on December 13. This will be its 15th edition and the central theme is 'Learning from the past, we build the future of data'. The aim of the meeting is to address the interaction that exists between the different regulations that coexist in the data ecosystem, analyze the most significant barriers identified by the sector and discuss solutions.
When and where will it be held?
The event, which will be held in classroom format on December 13, 2023 at the Universidad Rey Juan Carlos, in the Salón de Grados of the Departmental Building (Paseo de los Artilleros, Madrid). The reception of attendees begins at 9:00 and the event will end at 13:10.
What is the program?
The focus of this edition will be on collective learning, taking as a reference the steps taken so far in the world of data and in the construction of the future of the sector.
The session will open at 9:40 am with the inauguration of the event by the President of ASEDIE, Ignacio Jiménez and the Director of Public Governance of the Ministry of Finance and Public Function, Ms. Clara Mapelli to give way to the intervention of Carlos Romero, Advisor for Digital Transformation at the Permanent Representation of Spain to the European Union.
The event will feature two round tables:
-
The first table will take place at 10:00 and will deal with 'The data economy in search of a coherent regulation'. It will be attended by Santiago Graña, Deputy Director General of Planning and Governance of the Digital Administration; Joaquín Meseguer, Technical Advisor at the Madrid City Council; Lorenzo Avello, Deputy Director General of Telecommunications Management; and Mercedes Ortuño, Advisory Member of the Deputy Directorate General of Promotion and Authorizations of the Spanish Data Protection Agency (AEPD). It will be moderated by Casilda Lazcano, president of ASEDIE's Legal Commission.
-
The second round table, at 12:00h, will focus on the future under the title 'Open data in time perspective: 2024 and beyond'. Participants will include Carmen de Pablos Heredero, Professor of Business Organization at the URJC; Agustín T. de Villar Iglesias, Deputy Director of the Information Infrastructure Area of the Institute of Statistics and Cartography of Andalusia; and Fernando de Pablo Martín, Director General of the Digital Office of the Madrid City Council.
In between, at 11:00 a.m., the ASEDIE 2023 Awards will be presented in two categories.
-
The finalists in the category Driving the Data Economy are: the Data Office, for the generation of data of proven quality from an effective and standardized government; the City Council of Zaragoza, with its project Know and explore Zaragoza; and the Generalitat de Catalunya, for the classification of datasets by the Sustainable Development Goals.
-
In the category Promoting data knowledge, the finalist initiatives are the Data Management Summit, an event that promotes data knowledge, the Spanish Federation of Municipalities and Provinces, for the standard ordinance on data governance in municipal entities, and the Geographic Institute of Aragon for ICEARAGON, with the project on spatial knowledge of the region.
After the awards ceremony, Conchita Cornejo, Coordinator of the area of the General Secretariat for Inspection and Control of Capital Movements, and Emilio López, Director of the National Center for Geographic Information, will intervene.
You can consult the complete program here.
How can I register?
Attendance is in person with limited capacity and registrations can be made on the ASEDIE website.