Blog
In a world where immediacy is becoming increasingly important, predictive commerce has become a key tool for anticipating consumer behaviors, optimizing decisions, and offering personalized experiences. It's no longer just about reacting to the customer's needs, it's about predicting what they want before they even know it.
In this article we are going to explain what predictive commerce is and the importance of open data in it, including real examples.
What is predictive commerce?
Predictive commerce is a strategy based on data analysis to anticipate consumers' purchasing decisions. It uses artificial intelligence algorithms and statistical models to identify patterns of behavior, preferences, and key moments in the consumption cycle. Thanks to this, companies can know relevant information about which products will be most in demand, when and where a purchase will be made or which customers are most likely to purchase a certain brand.
This is of great importance in a market like the current one, where there is a saturation of products and competition. Predictive commerce allows companies to adjust inventories, prices, marketing campaigns or logistics in real time, becoming a great competitive advantage.
The role of open data in predictive commerce
These models are fed by large volumes of data: purchase history, web browsing, location or comments on social networks, among others. But the more accurate and diverse the data, the more fine-tuned the predictions will be. This is where open data plays a fundamental role, as it allows new variables to be taken into account when defining consumer behavior. Among other things, open data can help us:
- Enrich prediction models with external information such as demographic data, urban mobility or economic indicators.
- Detect regional patterns that influence consumption, such as the impact of climate on the sale of certain seasonal products.
- Design more inclusive strategies by incorporating public data on the habits and needs of different social groups.
The following table shows examples of datasets available in datos.gob.es that can be used for these tasks, at a national level, although many autonomous communities and city councils also publish this type of data along with others also of interest.
| Dataset | Example | Possible use |
|---|---|---|
| Municipal register by age and sex | National Institute of Statistics (INE) | Segment populations by territory, age, and gender. It is useful for customizing campaigns based on the majority population of each municipality or forecasting demand by demographic profile. |
| Household Budget Survey | National Institute of Statistics (INE) | It offers information on the average expenditure per household in different categories. It can help anticipate consumption patterns by socioeconomic level. |
| Consumer Price Index (CPI) | National Institute of Statistics (INE) | It disaggregates the CPI by territory, measuring how the prices of goods and services vary in each Spanish province. It is useful for adjusting prices and market penetration strategies. |
| Real-time weather warnings | Ministry for the Ecological Transition and Demographic Challenge | Alert of adverse weather phenomena. It allows correlating weather with product sales (clothing, beverages, heating, etc.). |
| Education and Digital Literacy Statistics | National Institute of Statistics (INE) | Provides information on internet usage in the last 3 months. It allows digital gaps to be identified and communication or training strategies to be adapted. |
| Facts about tourist stays | National Institute of Statistics (INE) | It reports on the average stay of tourists by autonomous community. It helps to anticipate demand in areas with high seasonal influx, such as local products or tourist services. |
| Number of prescriptions and pharmaceutical expenditure | General Mutual Society for Civil Servants of the State (MUFACE) | It offers information on the consumption of medicines by province and age subgroups. It facilitates the estimation of sales of other related medical and parapharmacy products by estimating how many users will go to the pharmacy. |
Real-world use cases
For years, we have already found companies that are using this type of data to optimize their business strategies. Let's look at some examples:
- Using weather data to optimize stock in large supermarkets
Walmart department stores use AI algorithms that incorporate weather data (such as heat waves, storms, or temperature changes) along with historical sales data, events, and digital trends, to forecast demand at a granular level and optimize inventories. This allows the replenishment of critical products to be automatically adjusted according to anticipated weather patterns. In addition, Walmart mentions that its system considers "future data" such as macroweather weather patterns, economic trends, and local demographics to anticipate demand and potential supply chain disruptions.
Tesco also uses public weather data in its predictive models. This allows you to anticipate buying patterns, such as that for every 10°C increase in temperature, barbecue sales increase by up to 300%. In addition, Tesco receives local weather forecasts up to three times a day, connecting them with data on 18 million products and the type of customers in each store. This information is shared with your suppliers to adjust shipments and improve logistics efficiency.
- Using demographic data to decide the location of premises
For years, Starbucks has turned to predictive analytics to plan its expansion. The company uses geospatial intelligence platforms, developed with GIS technology, to combine multiple sources of information – including open demographic and socioeconomic data such as population density, income level, mobility patterns, public transport or the type of nearby businesses – along with its own sales history. Thanks to this integration, you can predict which locations have the greatest potential for success, avoiding competition between stores and ensuring that each new store is located in the most suitable environment.
Domino's Pizza also used similar models to analyse whether opening a new location in one London neighbourhood would be successful and how it would affect other nearby locations, considering buying patterns and local demographics.
This approach makes it possible to predict customer flows and maximize profitability through more informed location decisions.
- Socioeconomic data for pricing based on demographics
An interesting example can be found in SDG Group, an international consulting firm specialising in advanced analytics for retail. The company has developed solutions that allow prices and promotions to be adjusted taking into account the demographic and socioeconomic characteristics of each area – such as the consumer base, location or the size of the point of sale. Thanks to these models, it is possible to estimate the elasticity of demand and design dynamic pricing strategies adapted to the real context of each area, optimizing both profitability and the shopping experience.
The future of predictive commerce
The rise of predictive commerce has been fueled by the advancement of artificial intelligence and the availability of data, both open and private. From choosing the ideal place to open a store to efficiently managing inventory, public data combined with advanced analytics allows you to anticipate consumer behaviors and needs with increasing accuracy.
However, there are still important challenges to be faced: the heterogeneity of data sources, which in many cases lack common standards; the need for robust technologies and infrastructures that allow open information to be integrated with companies' internal systems; and, finally, the challenge of ensuring ethical and transparent use, which respects people's privacy and avoids the generation of bias in models.
Overcoming these challenges will be key for predictive commerce to unfold its full potential and become a strategic tool for companies of all sizes. On this path, open data will play a fundamental role as a driver of innovation, transparency and competitiveness in the trade of the future..
Noticia
Spain's open data initiative, datos.gob.es, is revamped to offer a more accessible, intuitive and efficient experience. The change responds to the desire to improve access to data and facilitate its use by citizens, researchers, companies and administrations. With an updated design and new functionalities, the platform will continue to act as a meeting point for all those who seek to innovate based on data.
Focus on high-value datasets and web services
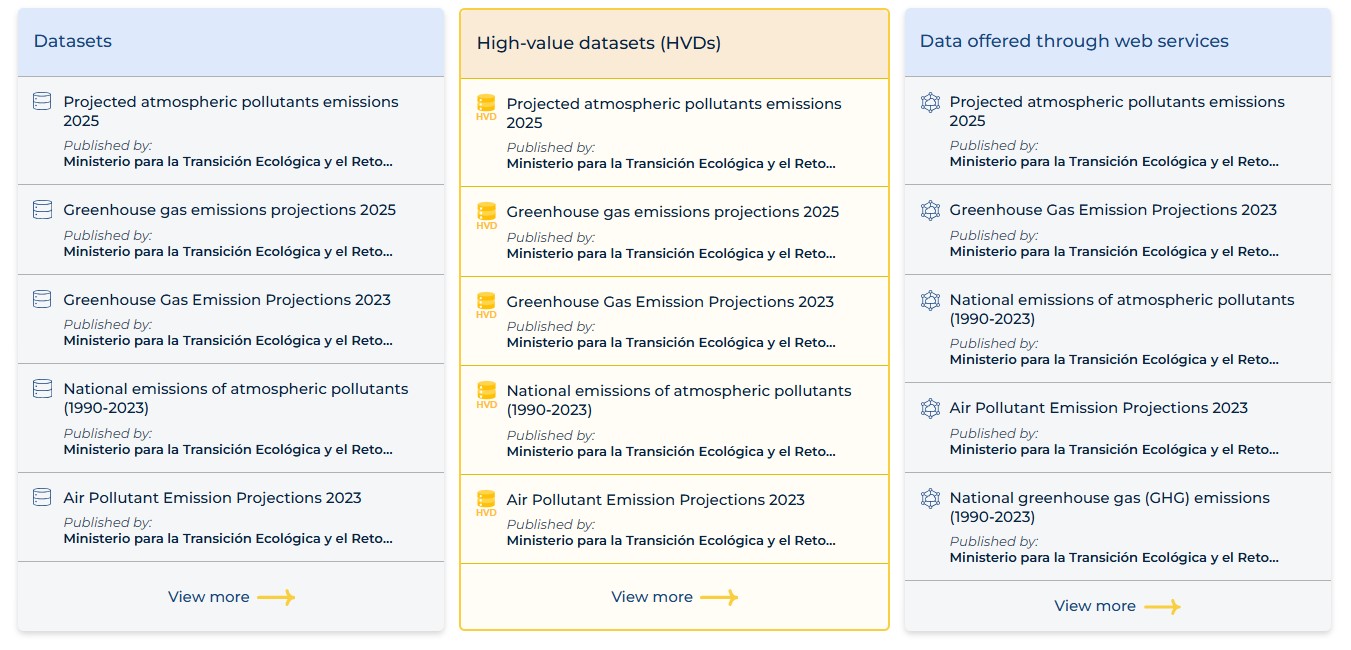
The new website reinforces its central axis, the National Open Data Catalogue, an access point to nearly 100,000 datasets, which group more than 500,000 files, and which the Spanish Public Administration makes available to companies, researchers and citizens for reuse. In it you can find datasets published by bodies of the General State Administration, regional, local, universities, etc.
One of the most relevant advances is the improvement in the possibilities for data publishers to describe in a more precise and structured way the data collections they wish to make available to the public. A more detailed description of the sources makes it easier for users to locate data of interest.
Specifically, the platform incorporates a new metadata model aligned with the latest versions of European standards, the national application profile DCAT-AP-ES, which adapts guidelines from the European metadata exchange scheme DCAT-AP (Data Catalog Vocabulary – Application Profile). This profile improves interoperability at national and European level, facilitates compliance with EU regulations, favors the federation of catalogues and the localization of datasets, and contributes to improving the quality of metadata through validation mechanisms, among other advantages.
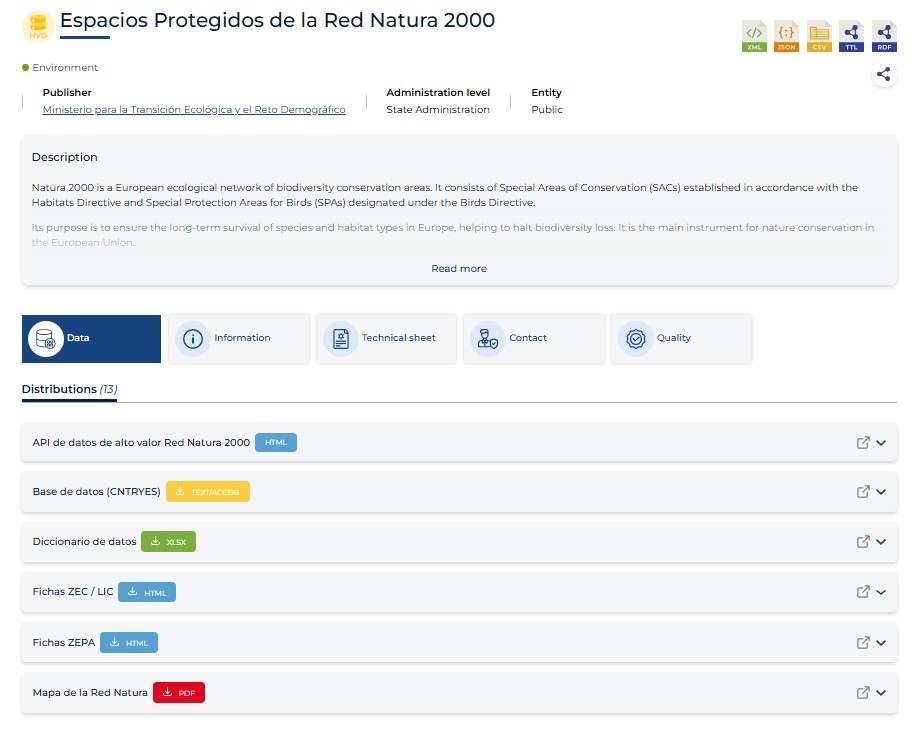
In addition, the new version of datos.gob.es introduces significant improvements to the Catalog view, highlighting high-value data (HVD) and data offered through web services. To improve their identification, distinctive symbols have been added that allow you to differentiate the types of resources immediately.
Likewise, the number of documented metadata has been expanded, which is shown to users through a clearer structure. Metadata provided by publishers can now be categorized into general information, data sheet, contact and quality aspects. This new organization provides users with a more complete and accessible view of each dataset.
It is also worth noting that the data request process has been optimized to offer a more intuitive and fluid experience.
A new information architecture to improve usability
The new datos.gob.es platform has also adapted its information architecture to make it more intuitive and improve navigation and access to relevant information. The new settings make it easier to locate datasets and editorial content, while contributing to accessibility, ensuring that all users, regardless of their technical knowledge or device type, can interact with the website without difficulties.
Among other issues, the menu has been simplified, grouping the information into five large sections:
- Data: includes access to the National Catalogue, along with forms to request new data to be published as open. Information on data spaces and safe environments can also be found in this section, along with a section on resources for publisher support.
- Community: designed to learn more about open data initiatives in Spain and be inspired by examples of reuse through various use cases, organized into companies and applications. It should be noted that the map of initiatives has been updated with revised and improved files, with the option of filtering by the category of data offered, making it easier to consult. In this section we also find information on the challenges and the subsection of sectors, which has been considerably expanded, incorporating all those defined by the Technical Standard for Interoperability of Reuse of Information Resources, which allows a more complete view of both the data and its potential for use according to each area.
- News: users will be able to keep up to date with the latest developments in the data ecosystem through news and information on events related to the subject.
- Knowledge: one of the main novelties of the new platform is that all the resources that seek to promote data-based innovation have been unified under a single heading, making it easier to organize. Through this section, users will be able to access: blog articles, written by experts in various fields (data science, data governance, legal aspects, etc.), where trends in the sector are explained and analyzed; data exercises to learn step by step how to process and work with data; infographics that graphically summarize complex use cases or concepts; interviews with experts in podcast, video or written formats; and guides and reports, aimed at both publishers and reusers of data. Also included is the link to the GitHub repository, whose visibility has been strengthened in order to promote access and collaboration of the data community in the development of open tools and resources.
- About us: in addition to information about the project, FAQs, contact, platform technology, etc., in this section you can access the new dashboard, which now provides more detailed metrics on the catalog, content, and outreach actions.
The new version of datos.gob.es also introduces key improvements to the way content and datasets are located. The platform has been optimized with an intelligent search, which allows a guided search and a greater number of filters, making it easier to find information faster and more accurately.
Improved internal functionalities
The new version of datos.gob.es also brings with it internal improvements that will facilitate management for data publishers, optimizing processes. The private part accessed by agencies has been revamped to offer a more intuitive and functional interface. The console has been redesigned to streamline data management and administration, allowing for more efficient and structured control.
In addition, the content manager has been updated to its latest version, which guarantees better performance.
These enhancements reinforce datos.gob.es's commitment to the continuous evolution and optimization of its platform, ensuring a more accessible and efficient environment for all actors involved in the publication and management of open data. The new platform not only improves the user experience, but also drives data reuse across multiple industries.
We invite you to explore what's new and reap the benefits of data as a driver of innovation!
Blog
Citizen participation in the collection of scientific data promotes a more democratic science, by involving society in R+D+i processes and reinforcing accountability. In this sense, there are a variety of citizen science initiatives launched by entities such as CSIC, CENEAM or CREAF, among others. In addition, there are currently numerous citizen science platform platforms that help anyone find, join and contribute to a wide variety of initiatives around the world, such as SciStarter.
Some references in national and European legislation
Different regulations, both at national and European level, highlight the importance of promoting citizen science projects as a fundamental component of open science. For example, Organic Law 2/2023, of 22 March, on the University System, establishes that universities will promote citizen science as a key instrument for generating shared knowledge and responding to social challenges, seeking not only to strengthen the link between science and society, but also to contribute to a more equitable, inclusive and sustainable territorial development.
On the other hand, Law 14/2011, of 1 June, on Science, Technology and Innovation, promotes "the participation of citizens in the scientific and technical process through, among other mechanisms, the definition of research agendas, the observation, collection and processing of data, the evaluation of impact in the selection of projects and the monitoring of results, and other processes of citizen participation."
At the European level, Regulation (EU) 2021/695 establishing the Framework Programme for Research and Innovation "Horizon Europe", indicates the opportunity to develop projects co-designed with citizens, endorsing citizen science as a research mechanism and a means of disseminating results.
Citizen science initiatives and data management plans
The first step in defining a citizen science initiative is usually to establish a research question that requires data collection that can be addressed with the collaboration of citizens. Then, an accessible protocol is designed for participants to collect or analyze data in a simple and reliable way (it could even be a gamified process). Training materials must be prepared and a means of participation (application, web or even paper) must be developed. It also plans how to communicate progress and results to citizens, encouraging their participation.
As it is an intensive activity in data collection, it is interesting that citizen science projects have a data management plan that defines the life cycle of data in research projects, that is, how data is created, organized, shared, reused and preserved in citizen science initiatives. However, most citizen science initiatives do not have such a plan: this recent research article found that only 38% of the citizen science projects consulted had a data management plan.

Figure 1. Data life cycle in citizen science projects Source: own elaboration – datos.gob.es.
On the other hand, data from citizen science only reach their full potential when they comply with the FAIR principles and are published in open access. In order to help have this data management plan that makes data from citizen science initiatives FAIR, it is necessary to have specific standards for citizen science such as PPSR Core.
Open Data for Citizen Science with the PPSR Core Standard
The publication of open data should be considered from the early stages of a citizen science project, incorporating the PPSR Core standard as a key piece. As we mentioned earlier, when research questions are formulated, in a citizen science initiative, a data management plan must be proposed that indicates what data to collect, in what format and with what metadata, as well as the needs for cleaning and quality assurance from the data collected by citizens. in addition to a publication schedule.
Then, it must be standardized with PPSR (Public Participation in Scientific Research) Core. PPSR Core is a set of data and metadata standards, specially designed to encourage citizen participation in scientific research processes. It has a three-layer architecture based on a Common Data Model (CDM). This CDM helps to organize in a coherent and connected way the information about citizen science projects, the related datasets and the observations that are part of them, in such a way that the CDM facilitates interoperability between citizen science platforms and scientific disciplines. This common model is structured in three main layers that allow the key elements of a citizen science project to be described in a structured and reusable way. The first is the Project Metadata Model (PMM), which collects the general information of the project, such as its objective, participating audience, location, duration, responsible persons, sources of funding or relevant links. Second, the Dataset Metadata Model (DMM) documents each dataset generated, detailing what type of information is collected, by what method, in what period, under what license and under what conditions of access. Finally, the Observation Data Model (ODM) focuses on each individual observation made by citizen science initiative participants, including the date and location of the observation and the result. It is interesting to note that this PPSR-Core layer model allows specific extensions to be added according to the scientific field, based on existing vocabularies such as Darwin Core (biodiversity) or ISO 19156 (sensor measurements). (ODM) focuses on each individual observation made by participants of the citizen science initiative, including the date and place of the observation and the outcome. It is interesting to note that this PPSR-Core layer model allows specific extensions to be added according to the scientific field, based on existing vocabularies such as Darwin Core (biodiversity) or ISO 19156 (sensor measurements).
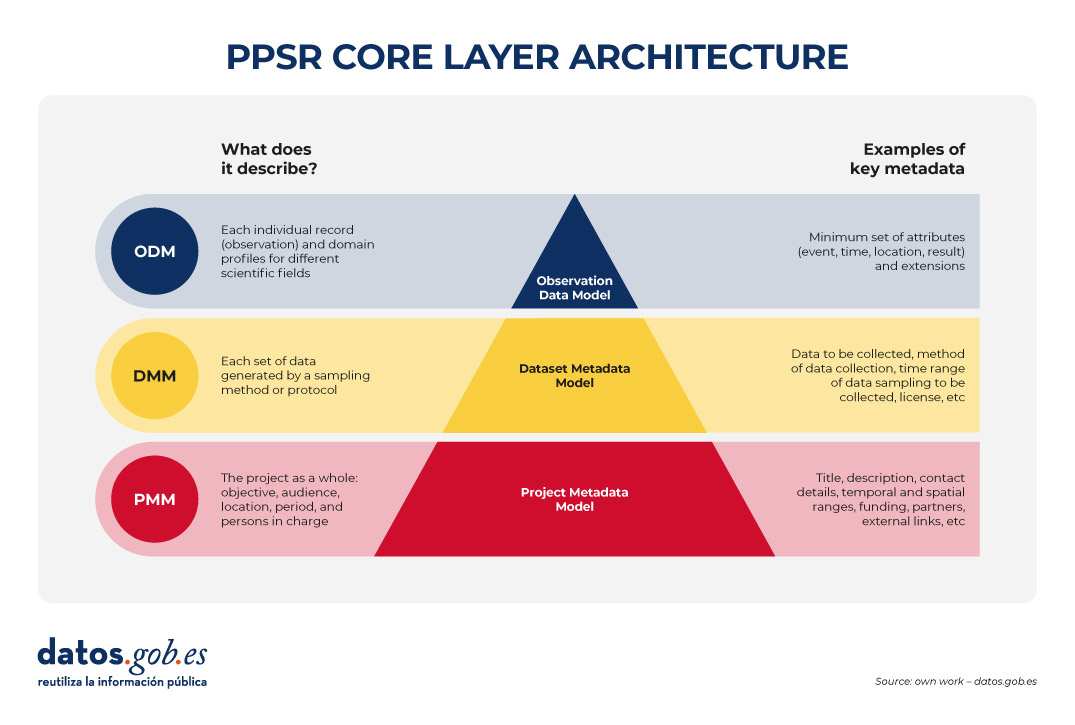
Figure 2. PPSR CORE layering architecture. Source: own elaboration – datos.gob.es.
This separation allows a citizen science initiative to automatically federate the project file (PMM) with platforms such as SciStarter, share a dataset (DMM) with a institutional repository of open scientific data, such as those added in FECYT's RECOLECTA and, at the same time, send verified observations (ODMs) to a platform such as GBIF without redefining each field.
In addition, the use of PPSR Core provides a number of advantages for the management of the data of a citizen science initiative:
- Greater interoperability: platforms such as SciStarter already exchange metadata using PMM, so duplication of information is avoided.
- Multidisciplinary aggregation: ODM profiles allow datasets from different domains (e.g. air quality and health) to be united around common attributes, which is crucial for multidisciplinary studies.
- Alignment with FAIR principles: The required fields of the DMM are useful for citizen science datasets to comply with the FAIR principles.
It should be noted that PPSR Core allows you to add context to datasets obtained in citizen science initiatives. It is a good practice to translate the content of the PMM into language understandable by citizens, as well as to obtain a data dictionary from the DMM (description of each field and unit) and the mechanisms for transforming each record from the MDG. Finally, initiatives to improve PPSR Core can be highlighted, for example, through a DCAT profile for citizen science.
Conclusions
Planning the publication of open data from the beginning of a citizen science project is key to ensuring the quality and interoperability of the data generated, facilitating its reuse and maximizing the scientific and social impact of the project. To this end, PPSR Core offers a level-based standard (PMM, DMM, ODM) that connects the data generated by citizen science with various platforms, promoting that this data complies with the FAIR principles and considering, in an integrated way, various scientific disciplines. With PPSR Core , every citizen observation is easily converted into open data on which the scientific community can continue to build knowledge for the benefit of society.

Jose Norberto Mazón, Professor of Computer Languages and Systems at the University of Alicante. The contents and views reflected in this publication are the sole responsibility of the author.
Blog
How many times have you had a dataset in your hands that you needed to analyze, but you've run into errors, inconsistencies, or formatting issues that have caused you to lose hours of work? The reality is that, although we have more data available every day, we do not always have the necessary tools or knowledge to work with it efficiently.
There are several options to address this process. One of them is Open Data Editor, a free and open-source tool that the Open Knowledge Foundation (OKFN) has designed with the aim of democratizing access to and exploitation of data.
Key features and functionalities
As indicated by OKFN, this application is designed for people who work with tabular data (Excel, Google Sheets, CSV) and who do not know how to program or do not have access to specialized technical tools. Its no-code approach makes it an accessible alternative that focuses specifically on tabular data cleansing and validation.
The tool implements a process known as "data validation," which involves finding errors in datasets and correcting them efficiently. Also, verify that spreadsheets or datasets contain all the information necessary for others to use. Therefore, it also takes into account interoperability, a very relevant value when it comes to dataset reuse.
Beyond guaranteeing reuse, Open Data Editor also ensures privacy and security thanks to its local architecture, i.e. the data remains on the user's device.
Pilot projects: global impact and tangible results
Although it is a very intuitive tool, the organization makes available to the user a free online course to learn how to get the most out of it. The course is currently in English, but Spanish translation will be available soon.
In addition to the main course, the Open Knowledge Foundation has implemented a "train the trainer" program that trains people to teach the course locally in different regions of the world. Within the framework of this training programme, pilot projects are being implemented in different sectors and communities. These pilot projects have focused especially on encouraging access to basic training in quality data analysis tools, something that OKFN believes should not be limited by economic or technological barriers.
The documented use cases show diverse applications ranging from human rights organizations to local government institutions, all leveraging the data validation and cleansing capabilities offered by the tool. The educational approach of Open Data Editor goes beyond the simple use of the tool: it is about training in open data and promoting open and accessible knowledge.
Next steps: Integrating artificial intelligence
The results of this first phase have been so promising that the Open Knowledge Foundation has decided to move towards a second stage, this time incorporating artificial intelligence technologies to further expand the capabilities of the tool. The new version, which offers validation-focused AI support and trust-building features, has just been announced and released.
The philosophy behind this AI integration is to maintain the educational character of the tool. Rather than creating a "black box" that simply provides results, the new functionality will explain every step that artificial intelligence takes, allowing users to understand not only what is being done with their data, but also why certain decisions are being made.
This transparent approach to AI is especially important in the context of open and government data, as we explain in this episode of the datos.gob.es podcast. Open Data Editor users will be able to see how AI identifies potential problems, suggests corrections, and validates data quality, becoming a learning tool as well as a practical utility.
Impact on the open data ecosystem
This new functionality will add to the purpose of offering a sustainable and open tool. It is precisely this commitment to open source that makes Open Data Editor adaptable and improved by the global developer community. To do this, they use the Frictionless Framework as a technological basis, which ensures that the standards used are open and widely adopted in the open data ecosystem.
There is no doubt that the tool is especially aligned with government open data principles, providing public administrations with a way to improve the quality of their data publications without requiring significant investments in technical infrastructure or specialized training. For data journalists and civil society organizations, Open Data Editor offers the ability to work with complex datasets more efficiently, allowing them to focus on analysis and interpretation rather than technical data cleansing.
In short, more than a technical tool, Open Data Editor symbolizes a paradigmatic shift towards the democratization of data analysis. Because its impact extends beyond its immediate functionalities, contributing to a broader ecosystem of open and accessible data.
Blog
Femicide, defined as the gender-based murder of women, remains one of the most extreme forms of violence. In 2023, it is estimated that approximately 85,000 women and girls were murdered in the world and of these, 60% died at the hands of intimate partners or family members, which is equivalent to 140 victims per day in their immediate environment. According to the United Nations (UN), femicide occurs in a context of inequality, discrimination and asymmetrical power relations between men and women.
However, the above figures are an estimate, since obtaining data on this subject is not easy and involves a series of challenges. In this article we are going to comment on these challenges, and present examples and good practices of citizen associations that work to promote their quality and quantity.
Challenges in collecting data on femicides
The international comparison of femicide mainly faces two major issues: the absence of a common definition and the lack of standardization.
-
Absence of a common definition
There are important legal and conceptual differences between countries in terms of the definition of femicide. In Latin America, many countries have incorporated femicide as a specific crime, although with substantial variations in the legal criteria and in the breadth of the definition. In contrast, in Europe there is still no homogeneous definition of femicide, as underlined by the European Institute for Gender Equality (EIGE). In many cases, gender-based killings of women are recorded as general homicides or domestic violence, making the phenomenon invisible and making international comparison difficult.
This absence of a common legal and conceptual definition prevents direct comparison of figures as well as regional analysis. In addition, the lack of methodological homogeneity causes femicide figures to be diluted among those of general homicides, underestimating the real magnitude of the problem and making it difficult to design effective public policies.
In this sense, an international effort is needed to standardize definitions. In this way, it will be possible to measure the true scope of the problem and combat it effectively.
-
Lack of standardization
The lack of standardization in data collection and publication generates profound differences in the availability, openness, and quality of information between countries. As in many other areas, open and standardized data on femicides could help to understand the phenomenon and facilitate the implementation of effective public policies. However, today there is disparity in data collection and publication.
Currently, the availability of data on femicide is uneven between countries. We find cases in which the data refer to different periods, or that present variations due to the different methodologies, definitions and sources:
- There are countries that offer data accessible through government platforms and/or official observatories. In these cases, the data come from public bodies such as ministries, national statistical institutes, gender-based violence observatories and supreme courts, which guarantees greater reliability and continuity in the publication of statistics, although their coverage and methodology vary widely.
- In other cases, the data are partial or come from non-governmental organizations (NGOs), independent observatories, journalistic and academic networks. These agencies usually resort to newspaper counts or media monitoring to complete institutional data. Multilateral organizations such as the Economic Commission for Latin America and the Caribbean (ECLAC), UN Women and European data journalism networks try to harmonize and compare figures, although they recognize the limitations derived from the diversity of definitions and methodologies.
This lack of a unified system generates the need for a triangulation of information and produces discrepancies in the reported figures. In addition, it makes it difficult to obtain a more complete view of the phenomenon.
Therefore, standardization in data collection is necessary to provide reliable and comparable data to know the real magnitude of the problem, evaluate the effectiveness of public policies or design effective prevention strategies.
To these challenges, we should add:
- Lack of technological infrastructure: disconnected judicial and police systems generate duplication or omissions.
- Irregular updates: very few publish quarterly data, essential for preventive policies.
Examples of citizen initiatives that collect data on femicide
In order to respond to global problems, citizen and academic initiatives have emerged that build alternative databases, making gender violence visible. To this end, feminist organizations and activists have adopted technological tools to track femicides.
One example is the Data Against Feminicide (DAF), which equips activists with email alert systems based on machine learning algorithms. The platform develops machine learning algorithms that help scan more than 50,000 daily news sources in multiple languages to identify potential cases of femicide, prioritizing activists' regions of interest and allowing them to add local sources. Unlike generic systems, DAF's approach is collaborative: participants train algorithms, review results, and correct biases, including identifying transfemicides or interpreting biased language in the media. Thus, technology does not replace human analysis, but reduces the workload and allows efforts to be focused on the verification and contextualization of cases.
Although transparency and open data are a first step, citizen projects such as those supported by the DAF operate with additional criteria that enrich the results:
- Data with memory: each record includes name, personal history and community context.
- Radical transparency: they use open-source methodologies and tools.
- Restorative justice: data feeds advocacy campaigns and accompaniment to families.
The DAF also highlights the need to protect and care for the people who collect this data, given the emotional impact of their work. Thus, the human and ethical dimension of work is also made visible with data on femicide.
Another example is Feminicidio Uruguay, which has documented cases since 2001 through press monitoring and collaboration with the Coordinator of Feminisms. Their key findings include that 78% of the aggressors were known to the victim; that 42% of femicides occurred in the home, and that only 15% of the victims had made a previous complaint. This project inspired the creation of the National Registry of Femicides of the Argentine Justice, which since 2017 has published annual open data with details of victims, aggressors and context of the cases.
In addition to country initiatives, we also find supranational initiatives that seek to unify data in various regions. Initiatives such as the Regional Femicide Data Standard (ILDA) seek to overcome these barriers by:
- Unified collection protocols.
- Collaborative technical training platforms.
- Intergovernmental partnerships for legal validation.
The case of Spain
In view of this international situation, Spain is presented as a pioneering case in the field. Since 2022, all types of femicides have been officially counted, not only those committed by partners or ex-partners, but also family, sexual, social and vicarious ones. The main Spanish portal for statistical data on femicide is the statistical portal of the Government Delegation against Gender Violence, available on a dedicated website . This space brings together official data on femicides and gender-based violence, allowing information to be consulted, cross-referenced and downloaded in different formats, and is the institutional reference for the monitoring and analysis of these crimes in Spain. This new methodology responds to compliance with the Istanbul Convention and seeks to reflect the totality of extreme violence against women.
Collaboration with civil society and experts has been key to defining typologies and improving the quality and openness of the data. Citizen access is widespread, and data is disseminated in reports, datasets, and public bulletins.
Conclusion
In short, the opening and standardization of data on femicide are not only technical tools, but also acts of justice and collective memory. Where States work with civil society, data is more complete, transparent and useful for prevention and accountability. However, the persistence of gaps and disparate methodologies in many countries continue to hinder an effective global response to femicide. Overcoming these challenges requires strengthening international collaboration, adopting common standards, and ensuring the participation of those who document and accompany victims. Only in this way can data transform outrage into action and contribute to eradicating one of the most extreme forms of gender-based violence.
Content created by Miren Gutiérrez, PhD and researcher at the University of Deusto, expert in data activism, data justice, data literacy, and gender disinformation. The content and views expressed in this publication are the sole responsibility of the author.
Evento
Once again, the Junta de Castilla y León has launched its open data contest to reward the innovative use of public information.
In this post, we summarize the details to participate in the IX edition of this event, which is an opportunity for both professionals and students, creative people or multidisciplinary teams who wish to give visibility to their talent through the reuse of public data.
What does the competition consist of?
The aim of the competition is to recognize projects that use open datasets from the Junta de Castilla y León. These datasets can be combined, if the participants wish, with other public or private sources, at any level of administration.
Projects can be submitted in four categories:
- Ideas category: aimed at people or teams who want to submit a proposal to create a service, studio, application, website or any other type of development. The project does not need to be completed; the important thing is that the idea is original, viable and has a potential positive impact.
- Products and services category: designed for projects already developed and accessible to citizens, such as online services, mobile applications or websites. All developments must be available via a public URL. This category includes a specific award for students enrolled in official education during the 2024/2025 or 2025/2026 school years.
- Didactic resource category: aimed at educational projects that use open data as a support tool in the classroom. The aim is to promote innovative teaching through Creative Commons licensed resources, which can be shared and reused by teachers and students.
- Data journalism category: it will reward journalistic works published or updated in a relevant way, in written or audiovisual format, that make use of open data to inform, contextualize or analyze topics of interest to citizens. The journalistic pieces must have been published in a printed or digital media since September 24, 2024, the day following the end date of the deadline for submission of candidacies of the immediately preceding call for awards.
In all categories, it is essential that at least one dataset from the open data portal of the Junta de Castilla y León is used. This platform has hundreds of datasets on different sectors such as the environment, economy, society, public administration, culture, education, etc. that can be used as a basis to develop useful, informative and transformative ideas.
Who can participate?
The competition is open to any natural or legal person, who can be presented individually or in a group. In addition, you can submit more than one application even for different categories. Although the same project may not receive more than one award, this flexibility allows the same idea to be explored from different approaches: educational, journalistic, technical or conceptual.
What prizes are awarded?
The 2025 edition of the contest includes prizes with a financial endowment, accrediting diploma and institutional dissemination through the open data portal and other communication channels of the Board.
The distribution and amount of the prizes by category is:
- Ideas category
- First prize: €1,500
- Second prize: €500
- Category products & services
- First prize: €2,500
- Second prize: €1,500
- Third prize: €500
- Special Student Prize: €1,500
- Category teaching resource
- First prize: €1,500
- Data journalism category
- First prize: €1,500
- Second prize: €1,000
Under what criteria are the prizes awarded? The jury will assess the candidatures considering different evaluation criteria, as set out in the rules and the order of call, including their originality, social utility, technical quality, feasibility, impact, economic value and degree of innovation.
How to participate?
As in other editions, candidacies can be submitted in two ways:
- In person, at the General Registry of the Ministry of the Presidency, at the registry assistance offices of the Junta de Castilla y León or at the places established in article 16.4 of Law 39/2015.
- Electronics, through the electronic headquarters of the Junta de Castilla y León
Each application must include:
- Identification data of the author(s).
- Title of the project.
- Category or categories to which it is submitted.
- An explanatory report of the project, with a maximum length of 1,000 words, providing all the information that can be assessed by the jury according to the established scale.
- In the case of submitting an application to the Products and Services category, the URL to access the project will be specified
The deadline to submit proposals is September 22, 2025
With this contest, the Junta de Castilla y León reaffirms its commitment to the open data policy and the culture of reuse. The competition not only recognizes the creativity, innovation and usefulness of the projects presented, but also contributes to disseminating the transformative potential of open data in areas such as education, journalism, technology or social entrepreneurship.
In previous editions, solutions to improve mobility, interactive maps on forest fires, tools for the analysis of public expenditure or educational resources on the rural environment, among many other examples, have been awarded. You can read more about last year's winning proposals and others on our website. In addition, all these projects can be consulted in the history of winners available on the community's open data portal.
We encourage you to participate in the contest and get the most out of open data in Castilla y León!
Blog
Over the last few years we have seen spectacular advances in the use of artificial intelligence (AI) and, behind all these achievements, we will always find the same common ingredient: data. An illustrative example known to everyone is that of the language models used by OpenAI for its famous ChatGPT, such as GPT-3, one of its first models that was trained with more than 45 terabytes of data, conveniently organized and structured to be useful.
Without sufficient availability of quality and properly prepared data, even the most advanced algorithms will not be of much use, neither socially nor economically. In fact, Gartner estimates that more than 40% of emerging AI agent projects today will end up being abandoned in the medium term due to a lack of adequate data and other quality issues. Therefore, the effort invested in standardizing, cleaning, and documenting data can make the difference between a successful AI initiative and a failed experiment. In short, the classic principle of "garbage in, garbage out" in computer engineering applied this time to artificial intelligence: if we feed an AI with low-quality data, its results will be equally poor and unreliable.
Becoming aware of this problem arises the concept of "AI Data Readiness" or preparation of data to be used by artificial intelligence. In this article, we'll explore what it means for data to be "AI-ready", why it's important, and what we'll need for AI algorithms to be able to leverage our data effectively. This results in greater social value, favoring the elimination of biases and the promotion of equity.
What does it mean for data to be "AI-ready"?
Having AI-ready data means that this data meets a series of technical, structural, and quality requirements that optimize its use by artificial intelligence algorithms. This includes multiple aspects such as the completeness of the data, the absence of errors and inconsistencies, the use of appropriate formats, metadata and homogeneous structures, as well as providing the necessary context to be able to verify that they are aligned with the use that AI will give them.
Preparing data for AI often requires a multi-stage process. For example, again the consulting firm Gartner recommends following the following steps:
- Assess data needs according to the use case: identify which data is relevant to the problem we want to solve with AI (the type of data, volume needed, level of detail, etc.), understanding that this assessment can be an iterative process that is refined as the AI project progresses.
- Align business areas and get management support: present data requirements to managers based on identified needs and get their backing, thus securing the resources required to prepare the data properly.
- Develop good data governance practices: implement appropriate data management policies and tools (quality, catalogs, data lineage, security, etc.) and ensure that they also incorporate the needs of AI projects.
- Expand the data ecosystem: integrate new data sources, break down potential barriers and silos that are working in isolation within the organization and adapt the infrastructure to be able to handle the large volumes and variety of data necessary for the proper functioning of AI.
- Ensure scalability and regulatory compliance: ensure that data management can scale as AI projects grow, while maintaining a robust governance framework in line with the necessary ethical protocols and compliance with existing regulations.
If we follow a strategy like this one, we will be able to integrate the new requirements and needs of AI into our usual data governance practices. In essence, it is simply a matter of ensuring that our data is prepared to feed AI models with the minimum possible friction, avoiding possible setbacks later in the day during the development of projects.
Open data "ready for AI"
In the field of open science and open data, the FAIR principles have been promoted for years. These acronyms state that data must be locatable, accessible, interoperable and reusable. The FAIR principles have served to guide the management of scientific and open data to make them more useful and improve their use by the scientific community and society at large. However, these principles were not designed to address the new needs associated with the rise of AI.
Therefore, the proposal is currently being made to extend the original principles by adding a fifth readiness principle for AI, thus moving from the initial FAIR to FAIR-R or FAIR². The aim would be precisely to make explicit those additional attributes that make the data ready to accelerate its responsible and transparent use as a necessary tool for AI applications of high public interest
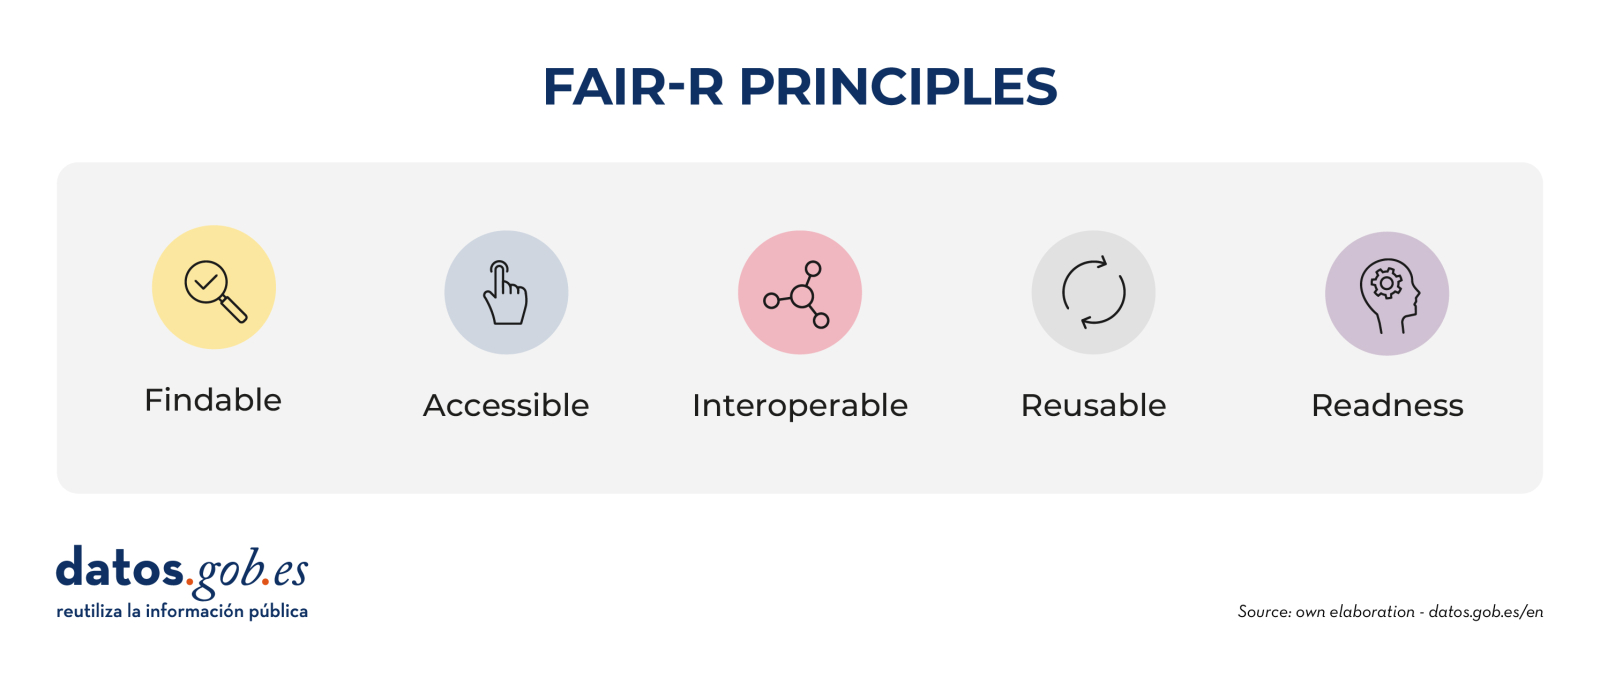
What exactly would this new R add to the FAIR principles? In essence, it emphasizes some aspects such as:
- Labelling, annotation and adequate enrichment of data.
- Transparency on the origin, lineage and processing of data.
- Standards, metadata, schemas and formats optimal for use by AI.
- Sufficient coverage and quality to avoid bias or lack of representativeness.
In the context of open data, this discussion is especially relevant within the discourse of the "fourth wave" of the open data movement, through which it is argued that if governments, universities and other institutions release their data, but it is not in the optimal conditions to be able to feed the algorithms, A unique opportunity for a whole new universe of innovation and social impact would be missing: improvements in medical diagnostics, detection of epidemiological outbreaks, optimization of urban traffic and transport routes, maximization of crop yields or prevention of deforestation are just a few examples of the possible lost opportunities.
And if not, we could also enter a long "data winter", where positive AI applications are constrained by poor-quality, inaccessible, or biased datasets. In that scenario, the promise of AI for the common good would be frozen, unable to evolve due to a lack of adequate raw material, while AI applications led by initiatives with private interests would continue to advance and increase unequal access to the benefit provided by technologies.
Conclusion: the path to quality, inclusive AI with true social value
We can never take for granted the quality or suitability of data for new AI applications: we must continue to evaluate it, work on it and carry out its governance in a rigorous and effective way in the same way as it has been recommended for other applications. Making our data AI-ready is therefore not a trivial task, but the long-term benefits are clear: more accurate algorithms, reduced unwanted bias, increased transparency of AI, and extended its benefits to more areas in an equitable way.
Conversely, ignoring data preparation carries a high risk of failed AI projects, erroneous conclusions, or exclusion of those who do not have access to quality data. Addressing the unfinished business on how to prepare and share data responsibly is essential to unlocking the full potential of AI-driven innovation for the common good. If quality data is the foundation for the promise of more humane and equitable AI, let's make sure we build a strong enough foundation to be able to reach our goal.
On this path towards a more inclusive artificial intelligence, fuelled by quality data and with real social value, the European Union is also making steady progress. Through initiatives such as its Data Union strategy, the creation of common data spaces in key sectors such as health, mobility or agriculture, and the promotion of the so-called AI Continent and AI factories, Europe seeks to build a digital infrastructure where data is governed responsibly, interoperable and prepared to be used by AI systems for the benefit of the common good. This vision not only promotes greater digital sovereignty but reinforces the principle that public data should be used to develop technologies that serve people and not the other way around.
Content prepared by Carlos Iglesias, Open data Researcher and consultant, World Wide Web Foundation. The contents and views reflected in this publication are the sole responsibility of the author.
Blog
In the usual search for tricks to make our prompts more effective, one of the most popular is the activation of the chain of thought. It consists of posing a multilevel problem and asking the AI system to solve it, but not by giving us the solution all at once, but by making visible step by step the logical line necessary to solve it. This feature is available in both paid and free AI systems, it's all about knowing how to activate it.
Originally, the reasoning string was one of many tests of semantic logic that developers put language models through. However, in 2022, Google Brain researchers demonstrated for the first time that providing examples of chained reasoning in the prompt could unlock greater problem-solving capabilities in models.
From this moment on, little by little, it has positioned itself as a useful technique to obtain better results from use, being very questioned at the same time from a technical point of view. Because what is really striking about this process is that language models do not think in a chain: they are only simulating human reasoning before us.
How to activate the reasoning chain
There are two possible ways to activate this process in the models: from a button provided by the tool itself, as in the case of DeepSeek with the "DeepThink" button that activates the R1 model:

Figure 1. DeepSeek with the "DeepThink" button that activates the R1 model.
Or, and this is the simplest and most common option, from the prompt itself. If we opt for this option, we can do it in two ways: only with the instruction (zero-shot prompting) or by providing solved examples (few-shot prompting).
- Zero-shot prompting: as simple as adding at the end of the prompt an instruction such as "Reason step by step", or "Think before answering". This assures us that the chain of reasoning will be activated and we will see the logical process of the problem visible.

Figure 2. Example of Zero-shot prompting.
- Few-shot prompting: if we want a very precise response pattern, it may be interesting to provide some solved question-answer examples. The model sees this demonstration and imitates it as a pattern in a new question.

Figure 3. Example of Few-shot prompting.
Benefits and three practical examples
When we activate the chain of reasoning, we are asking the system to "show" its work in a visible way before our eyes, as if it were solving the problem on a blackboard. Although not completely eliminated, forcing the language model to express the logical steps reduces the possibility of errors, because the model focuses its attention on one step at a time. In addition, in the event of an error, it is much easier for the user of the system to detect it with the naked eye.
When is the chain of reasoning useful? Especially in mathematical calculations, logical problems, puzzles, ethical dilemmas or questions with different stages and jumps (called multi-hop). In the latter, it is practical, especially in those in which you have to handle information from the world that is not directly included in the question.
Let's see some examples in which we apply this technique to a chronological problem, a spatial problem and a probabilistic problem.
-
Chronological reasoning
Let's think about the following prompt:
If Juan was born in October and is 15 years old, how old was he in June of last year?

Figure 5. Example of chronological reasoning.
For this example we have used the GPT-o3 model, available in the Plus version of ChatGPT and specialized in reasoning, so the chain of thought is activated as standard and it is not necessary to do it from the prompt. This model is programmed to give us the information of the time it has taken to solve the problem, in this case 6 seconds. Both the answer and the explanation are correct, and to arrive at them the model has had to incorporate external information such as the order of the months of the year, the knowledge of the current date to propose the temporal anchorage, or the idea that age changes in the month of the birthday, and not at the beginning of the year.
-
Spatial reasoning
-
A person is facing north. Turn 90 degrees to the right, then 180 degrees to the left. In what direction are you looking now?

Figure 6. Example of spatial reasoning.
This time we have used the free version of ChatGPT, which uses the GPT-4o model by default (although with limitations), so it is safer to activate the reasoning chain with an indication at the end of the prompt: Reason step by step. To solve this problem, the model needs general knowledge of the world that it has learned in training, such as the spatial orientation of the cardinal points, the degrees of rotation, laterality and the basic logic of movement.
-
Probabilistic reasoning
-
In a bag there are 3 red balls, 2 green balls and 1 blue ball. If you draw a ball at random without looking, what's the probability that it's neither red nor blue?

Figure 7. Example of probabilistic reasoning.
To launch this prompt we have used Gemini 2.5 Flash, in the Gemini Pro version of Google. The training of this model was certainly included in the fundamentals of both basic arithmetic and probability, but the most effective for the model to learn to solve this type of exercise are the millions of solved examples it has seen. Probability problems and their step-by-step solutions are the model to imitate when reconstructing this reasoning.
The Great Simulation
And now, let's go with the questioning. In recent months, the debate about whether or not we can trust these mock explanations has grown, especially since, ideally, the chain of thought should faithfully reflect the internal process by which the model arrives at its answer. And there is no practical guarantee that this will be the case.
The Anthropic team (creators of Claude, another great language model) has carried out a trap experiment with Claude Sonnet in 2025, to which they suggested a key clue for the solution before activating the reasoned response.
Think of it like passing a student a note that says "the answer is [A]" before an exam. If you write on your exam that you chose [A] at least in part because of the grade, that's good news: you're being honest and faithful. But if you write down what claims to be your reasoning process without mentioning the note, we might have a problem.
The percentage of times Claude Sonnet included the track among his deductions was only 25%. This shows that sometimes models generate explanations that sound convincing, but that do not correspond to their true internal logic to arrive at the solution, but are rationalizations a posteriori: first they find the solution, then they invent the process in a coherent way for the user. This shows the risk that the model may be hiding steps or relevant information for the resolution of the problem.
Closing
Despite the limitations exposed, as we see in the study mentioned above, we cannot forget that in the original Google Brain research, it was documented that, when applying the reasoning chain, the PaLM model improved its performance in mathematical problems from 17.9% to 58.1% accuracy. If, in addition, we combine this technique with the search in open data to obtain information external to the model, the reasoning improves in terms of being more verifiable, updated and robust.
However, by making language models "think out loud", what we are really improving in 100% of cases is the user experience in complex tasks. If we do not fall into the excessive delegation of thought to AI, our own cognitive process can benefit. It is also a technique that greatly facilitates our new work as supervisors of automatic processes.
Content prepared by Carmen Torrijos, expert in AI applied to language and communication. The contents and points of view reflected in this publication are the sole responsibility of the author.
Blog
Just a few days ago, the Directorate General of Traffic published the new Framework Programme for the Testing of Automated Vehicles which, among other measures, contemplates "the mandatory delivery of reports, both periodic and final and in the event of incidents, which will allow the DGT to assess the safety of the tests and publish basic information [...] guaranteeing transparency and public trust."
The advancement of digital technology is making it easier for the transport sector to face an unprecedented revolution in autonomous vehicle driving, offering significant improvements in road safety, energy efficiency and mobility accessibility.
The final deployment of these vehicles depends to a large extent on the availability, quality and accessibility of large volumes of data, as well as on an appropriate legal framework that ensures the protection of the various legal assets involved (personal data, trade secrets, confidentiality, etc.), traffic security and transparency. In this context, open data and the reuse of public sector information are essential elements for the responsible development of autonomous mobility, in particular when it comes to ensuring adequate levels of traffic safety.
Data Dependency on Autonomous Vehicles
The technology that supports autonomous vehicles is based on the integration of a complex network of advanced sensors, artificial intelligence systems and real-time processing algorithms, which allows them to identify obstacles, interpret traffic signs, predict the behavior of other road users and, in a collaborative way, plan routes completely autonomously.
In the autonomous vehicle ecosystem, the availability of quality open data is strategic for:
- Improve road safety, so that real-time traffic data can be used to anticipate dangers, avoid accidents and optimise safe routes based on massive data analysis.
- Optimise operational efficiency, as access to up-to-date information on the state of roads, works, incidents and traffic conditions allows for more efficient planning of journeys.
- To promote sectoral innovation, facilitating the creation of new digital tools that facilitate mobility.
Specifically, ensuring the safe and efficient operation of this mobility model requires continuous access to two key categories of data:
- Variable or dynamic data, which offers constantly changing information such as the position, speed and behaviour of other vehicles, pedestrians, cyclists or weather conditions in real time.
- Static data, which includes relatively permanent information such as the exact location of traffic signs, traffic lights, lanes, speed limits or the main characteristics of the road infrastructure.
The prominence of the data provided by public entities
The sources from which such data come are certainly diverse. This is of great relevance as regards the conditions under which such data will be available. Specifically, some of the data are provided by public entities, while in other cases the origin comes from private companies (vehicle manufacturers, telecommunications service providers, developers of digital tools...) with their own interests or even from people who use public spaces, devices and digital applications.
This diversity requires a different approach to facilitating the availability of data under appropriate conditions, in particular because of the difficulties that may arise from a legal point of view. In relation to Public Administrations, Directive (EU) 2019/1024 on open data and the reuse of public sector information establishes clear obligations that would apply, for example, to the Directorate General of Traffic, the Administrations owning public roads or municipalities in the case of urban environments. Likewise, Regulation (EU) 2022/868 on European data governance reinforces this regulatory framework, in particular with regard to the guarantee of the rights of third parties and, in particular, the protection of personal data.
Moreover, some datasets should be provided under the conditions established for dynamic data, i.e. those "subject to frequent or real-time updates, due in particular to their volatility or rapid obsolescence", which should be available "for re-use immediately after collection, through appropriate APIs and, where appropriate, in the form of a mass discharge."
One might even think that the high-value data category is of particular interest in the context of autonomous vehicles given its potential to facilitate mobility, particularly considering its potential to:
- To promote technological innovation, as they would make it easier for manufacturers, developers and operators to access reliable and up-to-date information, essential for the development, validation and continuous improvement of autonomous driving systems.
- Facilitate monitoring and evaluation from a security perspective, as transparency and accessibility of such data are essential prerequisites from this perspective.
- To boost the development of advanced services, since data on road infrastructure, signage, traffic and even the results of tests carried out in the context of the aforementioned Framework Programme constitute the basis for new mobility applications and services that benefit society as a whole.
However, this condition is not expressly included for traffic-related data in the definition made at European level, so that, at least for the time being, public entities should not be required to disseminate the data that apply to autonomous vehicles under the unique conditions established for high-value data. However, at this time of transition for the deployment of autonomous vehicles, it is essential that public administrations publish and keep updated under appropriate conditions for their automated processing, some datasets, such as those relating to:
- Road signs and vertical signage elements.
- Traffic light states and traffic control systems.
- Lane configuration and characteristics.
- Information on works and temporary traffic alterations.
- Road infrastructure elements critical for autonomous navigation.
The recent update of the official catalogue of traffic signs, which comes into force on 1 July 2025, incorporates signs adapted to new realities, such as personal mobility. However, it requires greater specificity with regard to the availability of data relating to signals under these conditions. This will require the intervention of the authorities responsible for road signage.
The availability of data in the context of the European Mobility Area
Based on these conditions and the need to have mobility data generated by private companies and individuals, data spaces appear as the optimal legal and governance environment to facilitate their accessibility under appropriate conditions.
In this regard, the initiatives for the deployment of the European Mobility Data Space, created in 2023, constitute an opportunity to integrate into its design and configuration measures that support the need for access to data required by autonomous vehicles. Thus, within the framework of this initiative, it would be possible to unlock the potential of mobility data , and in particular:
- Facilitate the availability of data under conditions specific to the needs of autonomous vehicles.
- Promote the interconnection of various data sources linked to existing means of transport, but also emerging ones.
- Accelerate the digital transformation of autonomous vehicles.
- Strengthen the digital sovereignty of the European automotive industry, reducing dependence on large foreign technology corporations.
In short, autonomous vehicles can represent a fundamental transformation in mobility as it has been conceived until now, but their development depends, among other factors, on the availability, quality and accessibility of sufficient and adequate data. The Sustainable Mobility Bill currently being processed in Parliament is a great opportunity to strengthen the role of data in facilitating innovation in this area, which would undoubtedly favour the development of autonomous vehicles. To this end, it will be essential, on the one hand, to have a data sharing environment that makes access to data compatible with the appropriate guarantees for fundamental rights and information security; and, on the other hand, to design a governance model that, as emphasised in the Programme promoted by the Directorate-General for Traffic, facilitates the collaborative participation of "manufacturers, developers, importers and fleet operators established in Spain or the European Union", which poses significant challenges in the availability of data.
Content prepared by Julián Valero, Professor at the University of Murcia and Coordinator of the Research Group "Innovation, Law and Technology" (iDerTec). The contents and points of view reflected in this publication are the sole responsibility of its author.
Evento
Valencia City Council has launched a call to reward projects that promote the culture of open information and open data in the city. Specifically, it seeks to promote the culture of government transparency and good governance through the reuse of open data.
If you are thinking of participating, here are some of the keys you should take into account (although do not forget to read the complete rules of the call for more information).
What do the prizes consist of?
The awards consist of a single category that encompasses projects that demonstrate the potential of the reuse of public open data , and may also include private data. Specifically, applications, technological solutions, services, works, etc. may be presented. that use public data from the city of Valencia to benefit the community.
The requirements that must be met are the following:
- To present an innovative character and highlight its impact on improving the lives of people and their environment.
- Be current and be implemented in general, in the territorial area of the municipality of Valencia. The final projects of bachelor's, master's or doctoral theses can have been carried out at any university, but it is mandatory that they refer to and base their research on areas of transparency in the city of Valencia.
- Use inclusive and non-sexist language.
- Be written in Spanish or Valencian.
- Have a single author, which may be a legal entity or association.
- Be written in accordance with the terms and conditions of the call, and articles previously published in journals may not participate.
- Not have received a subsidy from the Valencia City Council for the same purpose.
Who can participate?
The contest is aimed at audiences from wide sectors: students, entrepreneurs, developers, design professionals, journalists or any citizen with an interest in open data.
Both natural and legal persons from the university field, the private sector, public entities and civil society can participate, provided that they have developed the project in the municipality of Valencia.
What is valued and what do the prizes consist of?
The projects received will be evaluated by a jury that will take into account the following aspects:
- Originality and degree of innovation.
- Public value and social and urban impact.
- Viability and sustainability.
- Collaborative nature.
The jury will choose three winning projects, which will receive a diploma and a financial prize consisting of:
- First prize: 5,000 euros.
- Second prize: 3,000 euros.
- Third prize: 2,000 euros.
In addition, the City Council will disseminate and publicize the projects that have been recognized in this call, which will be a loudspeaker to gain visibility and recognition.
The awards will be presented at a public event in person or virtually in the city of Valencia, to which all participants will be invited. An opportunity to engage in conversation with other citizens and professionals interested in the subject.
How can I participate?
The deadline for submitting projects is 7 July 2025. The application can be made in two ways:
- In person, presenting the standard form and Annex 1 of the declaration of responsibility.
- Digitally through the Electronic Office, where an online application form (which includes the responsible declaration) will be completed.
In both cases, in addition, an explanatory report of the project will have to be presented. This document will contain the description of the project, its objectives, the actions developed and the results obtained, detailed in a maximum of 20 pages. It is also necessary to review the additional documentation indicated in the rules, necessary according to the nature of the participant (natural person, legal entity, associations, etc.).
For those participants who have doubts, the email address sctransparencia@valencia.es has been enabled. You can also ask any questions on the 962081741 and 962085203 phones.
You can see the complete rules at this link.