Blog
Synthetic images are visual representations artificially generated by algorithms and computational techniques, rather than being captured directly from reality with cameras or sensors. They are produced from different methods, among which the antagonistic generative networks (Generative Adversarial NetworksGAN), the Dissemination models, and the 3D rendering techniques. All of them allow you to create images of realistic appearance that in many cases are indistinguishable from an authentic photograph.
When this concept is transferred to the field of Earth observation, we are talking about synthetic satellite images. These are not obtained from a space sensor that captures real electromagnetic radiation, but are generated digitally to simulate what a satellite would see from orbit. In other words, instead of directly reflecting the physical state of the terrain or atmosphere at a particular time, they are computational constructs capable of mimicking the appearance of a real satellite image.
The development of this type of image responds to practical needs. Artificial intelligence systems that process remote sensing data require very large and varied sets of images. Synthetic images allow, for example, to recreate areas of the Earth that are little observed, to simulate natural disasters – such as forest fires, floods or droughts – or to generate specific conditions that are difficult or expensive to capture in practice. In this way, they constitute a valuable resource for training detection and prediction algorithms in agriculture, emergency management, urban planning or environmental monitoring.
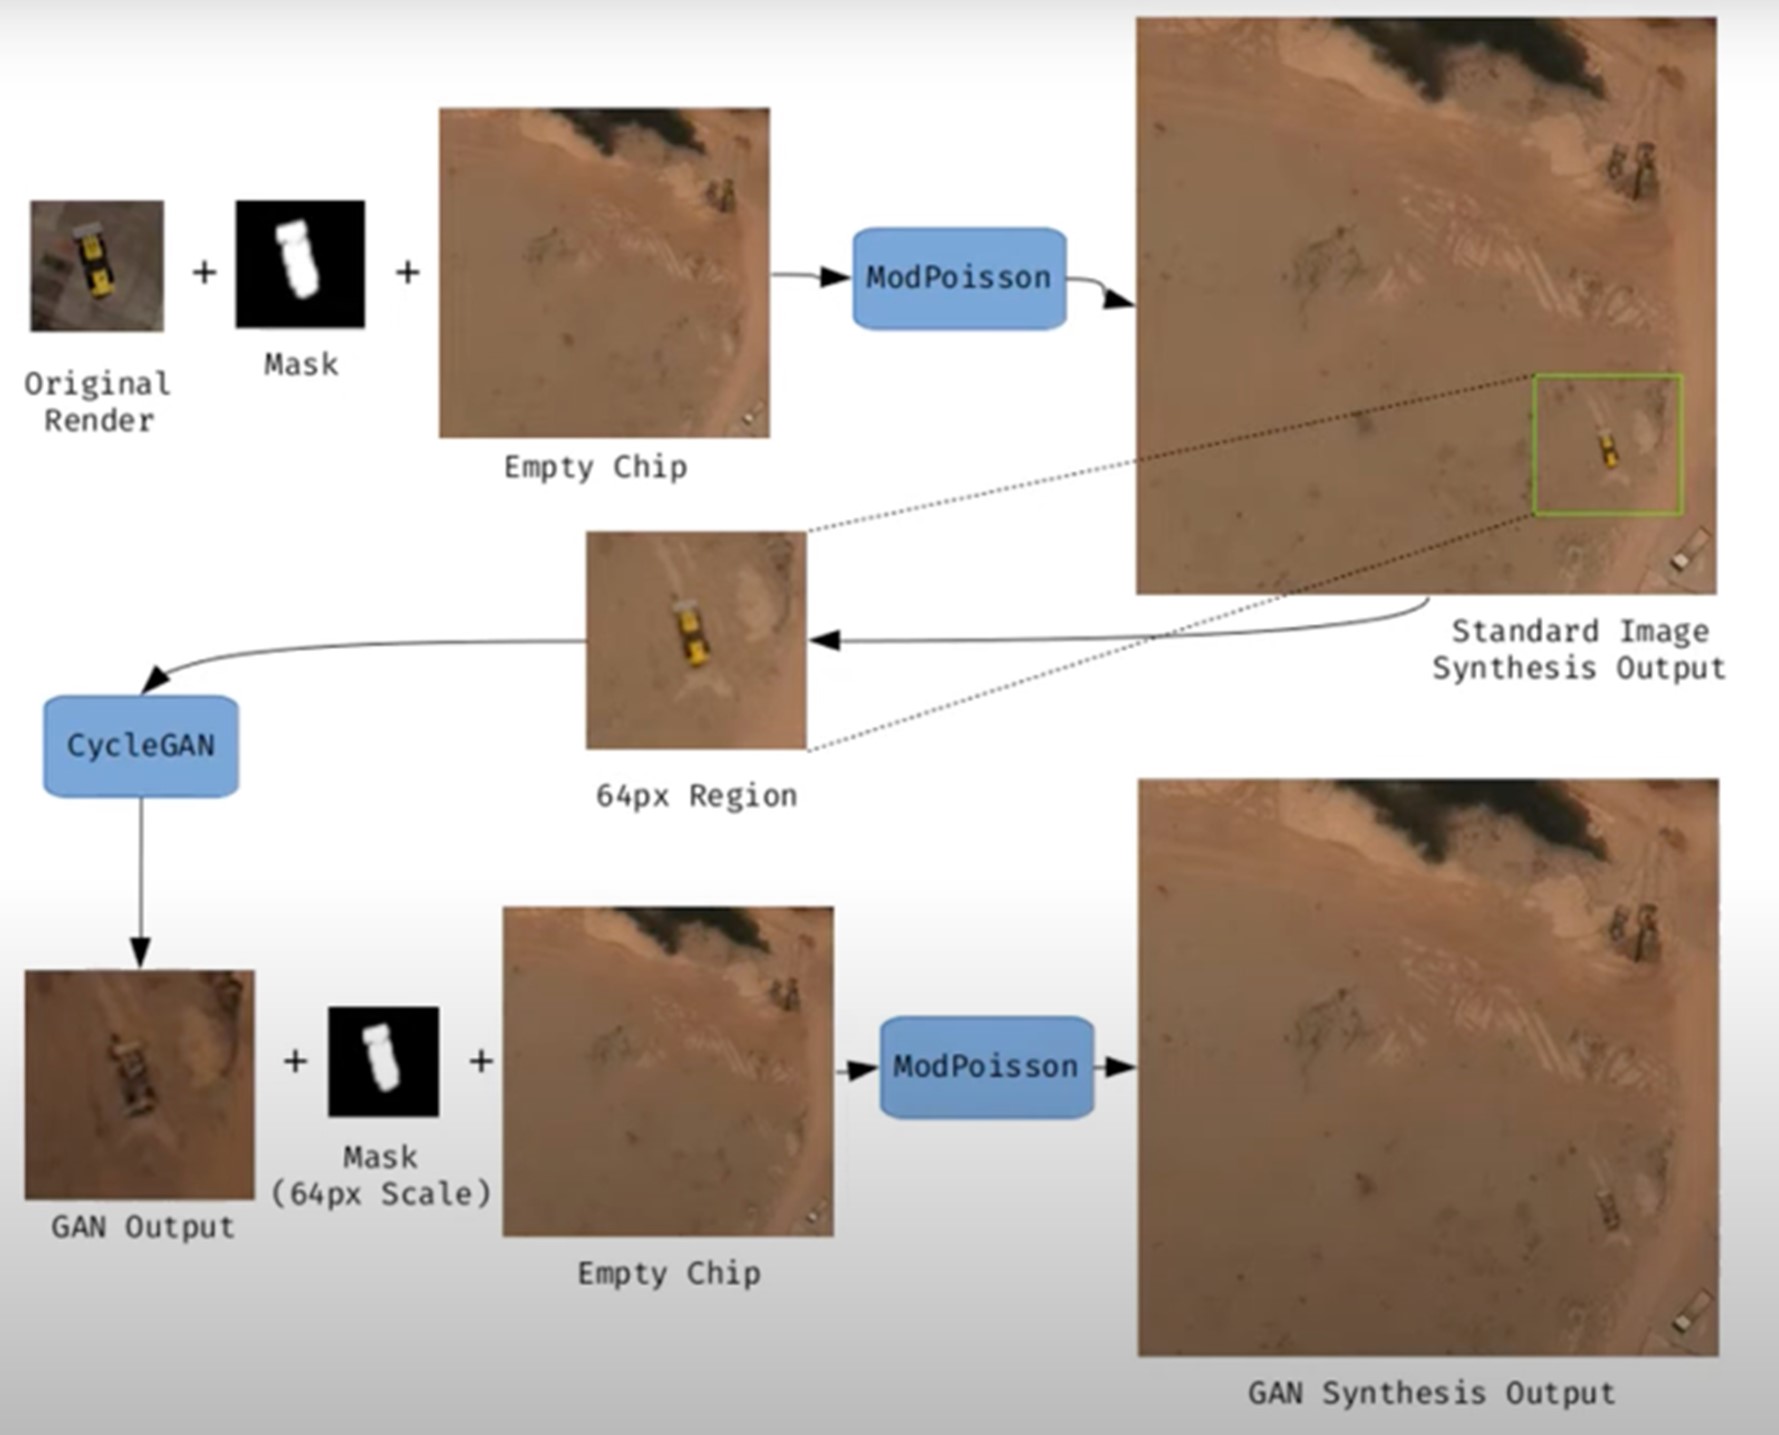
Figure 1. Example of synthetic satellite image generation.
Its value is not limited to model training. Where high-resolution images do not exist – due to technical limitations, access restrictions or economic reasons – synthesis makes it possible to fill information gaps and facilitate preliminary studies. For example, researchers can work with approximate synthetic images to design risk models or simulations before actual data are available.
However, synthetic satellite imagery also poses significant risks. The possibility of generating very realistic scenes opens the door to manipulation and misinformation. In a geopolitical context, an image showing non-existent troops or destroyed infrastructure could influence strategic decisions or international public opinion. In the environmental field, manipulated images could be disseminated to exaggerate or minimize the impacts of phenomena such as deforestation or melting ice, with direct effects on policies and markets.
Therefore, it is convenient to differentiate between two very different uses. The first is use as a support, when synthetic images complement real images to train models or perform simulations. The second is use as a fake, when they are deliberately presented as authentic images in order to deceive. While the former uses drive innovation, the latter threatens trust in satellite data and poses an urgent challenge of authenticity and governance.
Risks of satellite imagery applied to Earth observation
Synthetic satellite imagery poses significant risks when used in place of images captured by real sensors. Below are examples that demonstrate this.
A new front of disinformation: "deepfake geography"
The term deepfake geography has already been consolidated in the academic and popular literature to describe fictitious satellite images, manipulated with AI, that appear authentic, but do not reflect any existing reality. Research from the University of Washington, led by Bo Zhao, used algorithms such as CycleGAN to modify images of real cities—for example, altering the appearance of Seattle with non-existent buildings or transforming Beijing into green areas—highlighting the potential to generate convincing false landscapes.
One OnGeo Intelligence (OGC) platform article stresses that these images are not purely theoretical, but real threats affecting national security, journalism and humanitarian work. For its part, the OGC warns that fabricated satellite imagery, AI-generated urban models, and synthetic road networks have already been observed, and that they pose real challenges to public and operational trust.
Strategic and policy implications
Satellite images are considered "impartial eyes" on the planet, used by governments, media and organizations. When these images are faked, their consequences can be severe:
- National security and defense: if false infrastructures are presented or real ones are hidden, strategic analyses can be diverted or mistaken military decisions can be induced.
- Disinformation in conflicts or humanitarian crises: An altered image showing fake fires, floods, or troop movements can alter the international response, aid flows, or citizens' perceptions, especially if it is spread through social media or media without verification.
- Manipulation of realistic images of places: not only the general images are at stake. Nguyen et al. (2024) showed that it is possible to generate highly realistic synthetic satellite images of very specific facilities such as nuclear plants.
Crisis of trust and erosion of truth
For decades, satellite imagery has been perceived as one of the most objective and reliable sources of information about our planet. They were the graphic evidence that made it possible to confirm environmental phenomena, follow armed conflicts or evaluate the impact of natural disasters. In many cases, these images were used as "unbiased evidence," difficult to manipulate, and easy to validate. However, the emergence of synthetic images generated by artificial intelligence has begun to call into question that almost unshakable trust.
Today, when a satellite image can be falsified with great realism, a profound risk arises: the erosion of truth and the emergence of a crisis of confidence in spatial data.
The breakdown of public trust
When citizens can no longer distinguish between a real image and a fabricated one, trust in information sources is broken. The consequence is twofold:
- Distrust of institutions: if false images of a fire, a catastrophe or a military deployment circulate and then turn out to be synthetic, citizens may also begin to doubt the authentic images published by space agencies or the media. This "wolf is coming" effect generates skepticism even in the face of legitimate evidence.
- Effect on journalism: traditional media, which have historically used satellite imagery as an unquestionable visual source, risk losing credibility if they publish doctored images without verification. At the same time, the abundance of fake images on social media erodes the ability to distinguish what is real and what is not.
- Deliberate confusion: in contexts of disinformation, the mere suspicion that an image may be false can already be enough to generate doubt and sow confusion, even if the original image is completely authentic.
The following is a summary of the possible cases of manipulation and risk in satellite images:
|
Ambit |
Type of handling |
Main risk |
Documented example |
|---|---|---|---|
| Armed conflicts | Insertion or elimination of military infrastructures. | Strategic disinformation; erroneous military decisions; loss of credibility in international observation. | Alterations demonstrated in deepfake geography studies where dummy roads, bridges or buildings were added to satellite images. |
| Climate change and the environment | Alteration of glaciers, deforestation or emissions. | Manipulation of environmental policies; delay in measures against climate change; denialism. | Studies have shown the ability to generate modified landscapes (forests in urban areas, changes in ice) by means of GANs. |
| Gestión de emergencias | Creation of non-existent disasters (fires, floods). | Misuse of resources in emergencies; chaos in evacuations; loss of trust in agencies. | Research has shown the ease of inserting smoke, fire or water into satellite images. |
| Mercados y seguros | Falsification of damage to infrastructure or crops. | Financial impact; massive fraud; complex legal litigation. | Potential use of fake images to exaggerate damage after disasters and claim compensation or insurance. |
| Derechos humanos y justicia internacional | Alteration of visual evidence of war crimes. | Delegitimization of international tribunals; manipulation of public opinion. | Risk identified in intelligence reports: Doctored images could be used to accuse or exonerate actors in conflicts. |
| Geopolítica y diplomacia | Creation of fictitious cities or border changes. | Diplomatic tensions; treaty questioning; State propaganda | Examples of deepfake maps that transform geographical features of cities such as Seattle or Tacoma. |
Figure 2. Table showing possible cases of manipulation and risk in satellite images
Impact on decision-making and public policies
The consequences of relying on doctored images go far beyond the media arena:
- Urbanism and planning: decisions about where to build infrastructure or how to plan urban areas could be made on manipulated images, generating costly errors that are difficult to reverse.
- Emergency management: If a flood or fire is depicted in fake images, emergency teams can allocate resources to the wrong places, while neglecting areas that are actually affected.
- Climate change and the environment: Doctored images of glaciers, deforestation or polluting emissions could manipulate political debates and delay the implementation of urgent measures.
- Markets and insurance: Insurers and financial companies that rely on satellite imagery to assess damage could be misled, with significant economic consequences.
In all these cases, what is at stake is not only the quality of the information, but also the effectiveness and legitimacy of public policies based on that data.
The technological cat and mouse game
The dynamics of counterfeit generation and detection are already known in other areas, such as video or audio deepfakes: every time a more realistic generation method emerges, a more advanced detection algorithm is developed, and vice versa. In the field of satellite images, this technological career has particularities:
- Increasingly sophisticated generators: today's broadcast models can create highly realistic scenes, integrating ground textures, shadows, and urban geometries that fool even human experts.
- Detection limitations: Although algorithms are developed to identify fakes (analyzing pixel patterns, inconsistencies in shadows, or metadata), these methods are not always reliable when faced with state-of-the-art generators.
- Cost of verification: independently verifying a satellite image requires access to alternative sources or different sensors, something that is not always available to journalists, NGOs or citizens.
- Double-edged swords: The same techniques used to detect fakes can be exploited by those who generate them, further refining synthetic images and making them more difficult to differentiate.
From visual evidence to questioned evidence
The deeper impact is cultural and epistemological: what was previously assumed to be objective evidence now becomes an element subject to doubt. If satellite imagery is no longer perceived as reliable evidence, it weakens fundamental narratives around scientific truth, international justice, and political accountability.
- In armed conflicts, a satellite image showing possible war crimes can be dismissed under the accusation of being a deepfake.
- In international courts, evidence based on satellite observation could lose weight in the face of suspicion of manipulation.
- In public debate, the relativism of "everything can be false" can be used as a rhetorical weapon to delegitimize even the strongest evidence.
Strategies to ensure authenticity
The crisis of confidence in satellite imagery is not an isolated problem in the geospatial sector, but is part of a broader phenomenon: digital disinformation in the age of artificial intelligence. Just as video deepfakes have called into question the validity of audiovisual evidence, the proliferation of synthetic satellite imagery threatens to weaken the last frontier of perceived objective data: the unbiased view from space.
Ensuring the authenticity of these images requires a combination of technical solutions and governance mechanisms, capable of strengthening traceability, transparency and accountability across the spatial data value chain. The main strategies under development are described below.
Robust metadata: Record origin and chain of custody
Metadata is the first line of defense against manipulation. In satellite imagery, they should include detailed information about:
- The sensor used (type, resolution, orbit).
- The exact time of acquisition (date and time, with time precision).
- The precise geographical location (official reference systems).
- The applied processing chain (atmospheric corrections, calibrations, reprojections).
Recording this metadata in secure repositories allows the chain of custody to be reconstructed, i.e. the history of who, how and when an image has been manipulated. Without this traceability, it is impossible to distinguish between authentic and counterfeit images.
EXAMPLE: The European Union's Copernicus program already implements standardized and open metadata for all its Sentinel images, facilitating subsequent audits and confidence in the origin.
Digital signatures and blockchain: ensuring integrity
Digital signatures allow you to verify that an image has not been altered since it was captured. They function as a cryptographic seal that is applied at the time of acquisition and validated at each subsequent use.
Blockchain technology offers an additional level of assurance: storing acquisition and modification records on an immutable chain of blocks. In this way, any changes in the image or its metadata would be recorded and easily detectable.
EXAMPLE: The ESA – Trusted Data Framework project explores the use of blockchain to protect the integrity of Earth observation data and bolster trust in critical applications such as climate change and food security.
Invisible watermarks: hidden signs in the image
Digital watermarking involves embedding imperceptible signals in the satellite image itself, so that any subsequent alterations can be detected automatically.
- It can be done at the pixel level, slightly modifying color patterns or luminance.
- It is combined with cryptographic techniques to reinforce its validity.
- It allows you to validate images even if they have been cropped, compressed, or reprocessed.
EXAMPLE: In the audiovisual sector, watermarks have been used for years in the protection of digital content. Its adaptation to satellite images is in the experimental phase, but it could become a standard verification tool.
Open Standards (OGC, ISO): Trust through Interoperability
Standardization is key to ensuring that technical solutions are applied in a coordinated and global manner.
- OGC (Open Geospatial Consortium) works on standards for metadata management, geospatial data traceability, and interoperability between systems. Their work on geospatial APIs and FAIR (Findable, Accessible, Interoperable, Reusable) metadata is essential to establishing common trust practices.
- ISO develops standards on information management and authenticity of digital records that can also be applied to satellite imagery.
EXAMPLE: OGC Testbed-19 included specific experiments on geospatial data authenticity, testing approaches such as digital signatures and certificates of provenance.
Cross-check: combining multiple sources
A basic principle for detecting counterfeits is to contrast sources. In the case of satellite imagery, this involves:
- Compare images from different satellites (e.g. Sentinel-2 vs. Landsat-9).
- Use different types of sensors (optical, radar SAR, hyperspectral).
- Analyze time series to verify consistency over time.
EXAMPLE: Damage verification in Ukraine following the start of the Russian invasion in 2022 was done by comparing images from several vendors (Maxar, Planet, Sentinel), ensuring that the findings were not based on a single source.
AI vs. AI: Automatic Counterfeit Detection
The same artificial intelligence that allows synthetic images to be created can be used to detect them. Techniques include:
- Pixel Forensics: Identify patterns generated by GANs or broadcast models.
- Neural networks trained to distinguish between real and synthetic images based on textures or spectral distributions.
- Geometric inconsistencies models: detect impossible shadows, topographic inconsistencies, or repetitive patterns.
EXAMPLE: Researchers at the University of Washington and other groups have shown that specific algorithms can detect satellite fakes with greater than 90% accuracy under controlled conditions.
Current Experiences: Global Initiatives
Several international projects are already working on mechanisms to reinforce authenticity:
- Coalition for Content Provenance and Authenticity (C2PA): A partnership between Adobe, Microsoft, BBC, Intel, and other organizations to develop an open standard for provenance and authenticity of digital content, including images. Its model can be applied directly to the satellite sector.
- OGC work: the organization promotes the debate on trust in geospatial data and has highlighted the importance of ensuring the traceability of synthetic and real satellite images (OGC Blog).
- NGA (National Geospatial-Intelligence Agency) in the US has publicly acknowledged the threat of synthetic imagery in defence and is driving collaborations with academia and industry to develop detection systems.
Towards an ecosystem of trust
The strategies described should not be understood as alternatives, but as complementary layers in a trusted ecosystem:
|
Id |
Layers |
Benefits |
|---|---|---|
| 1 | Robust metadata (source, sensor, chain of custody) |
Traceability guaranteed |
| 2 | Digital signatures and blockchain (data integrity) |
Ensuring integrity |
| 3 | Invisible watermarks (hidden signs) |
Add a hidden level of protection |
| 4 | Cross-check (multiple satellites and sensors) |
Validates independently |
| 5 | AI vs. AI (counterfeit detector) |
Respond to emerging threats |
| 6 | International governance (accountability, legal frameworks) |
Articulate clear rules of liability |
Figure 3. Layers to ensure confidence in synthetic satellite images
Success will depend on these mechanisms being integrated together, under open and collaborative frameworks, and with the active involvement of space agencies, governments, the private sector and the scientific community.
Conclusions
Synthetic images, far from being just a threat, represent a powerful tool that, when used well, can provide significant value in areas such as simulation, algorithm training or innovation in digital services. The problem arises when these images are presented as real without proper transparency, fueling misinformation or manipulating public perception.
The challenge, therefore, is twofold: to take advantage of the opportunities offered by the synthesis of visual data to advance science, technology and management, and to minimize the risks associated with the misuse of these capabilities, especially in the form of deepfakes or deliberate falsifications.
In the particular case of satellite imagery, trust takes on a strategic dimension. Critical decisions in national security, disaster response, environmental policy, and international justice depend on them. If the authenticity of these images is called into question, not only the reliability of the data is compromised, but also the legitimacy of decisions based on them.
The future of Earth observation will be shaped by our ability to ensure authenticity, transparency and traceability across the value chain: from data acquisition to dissemination and end use. Technical solutions (robust metadata, digital signatures, blockchain, watermarks, cross-verification, and AI for counterfeit detection), combined with governance frameworks and international cooperation, will be the key to building an ecosystem of trust.
In short, we must assume a simple but forceful guiding principle:
"If we can't trust what we see from space, we put our decisions on Earth at risk."
Content prepared by Mayte Toscano, Senior Consultant in Data Economy Technologies. The contents and points of view reflected in this publication are the sole responsibility of the author.
Blog
Data is a fundamental resource for improving our quality of life because it enables better decision-making processes to create personalised products and services, both in the public and private sectors. In contexts such as health, mobility, energy or education, the use of data facilitates more efficient solutions adapted to people's real needs. However, in working with data, privacy plays a key role. In this post, we will look at how data spaces, the federated computing paradigm and federated learning, one of its most powerful applications, provide a balanced solution for harnessing the potential of data without compromising privacy. In addition, we will highlight how federated learning can also be used with open data to enhance its reuse in a collaborative, incremental and efficient way.
Privacy, a key issue in data management
As mentioned above, the intensive use of data requires increasing attention to privacy. For example, in eHealth, secondary misuse of electronic health record data could violate patients' fundamental rights. One effective way to preserve privacy is through data ecosystems that prioritise data sovereignty, such as data spaces. A dataspace is a federated data management system that allows data to be exchanged reliably between providers and consumers. In addition, the data space ensures the interoperability of data to create products and services that create value. In a data space, each provider maintains its own governance rules, retaining control over its data (i.e. sovereignty over its data), while enabling its re-use by consumers. This implies that each provider should be able to decide what data it shares, with whom and under what conditions, ensuring compliance with its interests and legal obligations.
Federated computing and data spaces
Data spaces represent an evolution in data management, related to a paradigm called federated computing, where data is reused without the need for data flow from data providers to consumers. In federated computing, providers transform their data into privacy-preserving intermediate results so that they can be sent to data consumers. In addition, this enables other Data Privacy-Enhancing Technologies(Privacy-Enhancing Technologies)to be applied. Federated computing aligns perfectly with reference architectures such as Gaia-X and its Trust Framework, which sets out the principles and requirements to ensure secure, transparent and rule-compliant data exchange between data providers and data consumers.
Federated learning
One of the most powerful applications of federated computing is federated machine learning ( federated learning), an artificial intelligence technique that allows models to be trained without centralising data. That is, instead of sending the data to a central server for processing, what is sent are the models trained locally by each participant.
These models are then combined centrally to create a global model. As an example, imagine a consortium of hospitals that wants to develop a predictive model to detect a rare disease. Every hospital holds sensitive patient data, and open sharing of this data is not feasible due to privacy concerns (including other legal or ethical issues). With federated learning, each hospital trains the model locally with its own data, and only shares the model parameters (training results) centrally. Thus, the final model leverages the diversity of data from all hospitals without compromising the individual privacy and data governance rules of each hospital.
Training in federated learning usually follows an iterative cycle:
- A central server starts a base model and sends it to each of the participating distributed nodes.
- Each node trains the model locally with its data.
- Nodes return only the parameters of the updated model, not the data (i.e. data shuttling is avoided).
- The central server aggregates parameter updates, training results at each node and updates the global model.
- The cycle is repeated until a sufficiently accurate model is achieved.
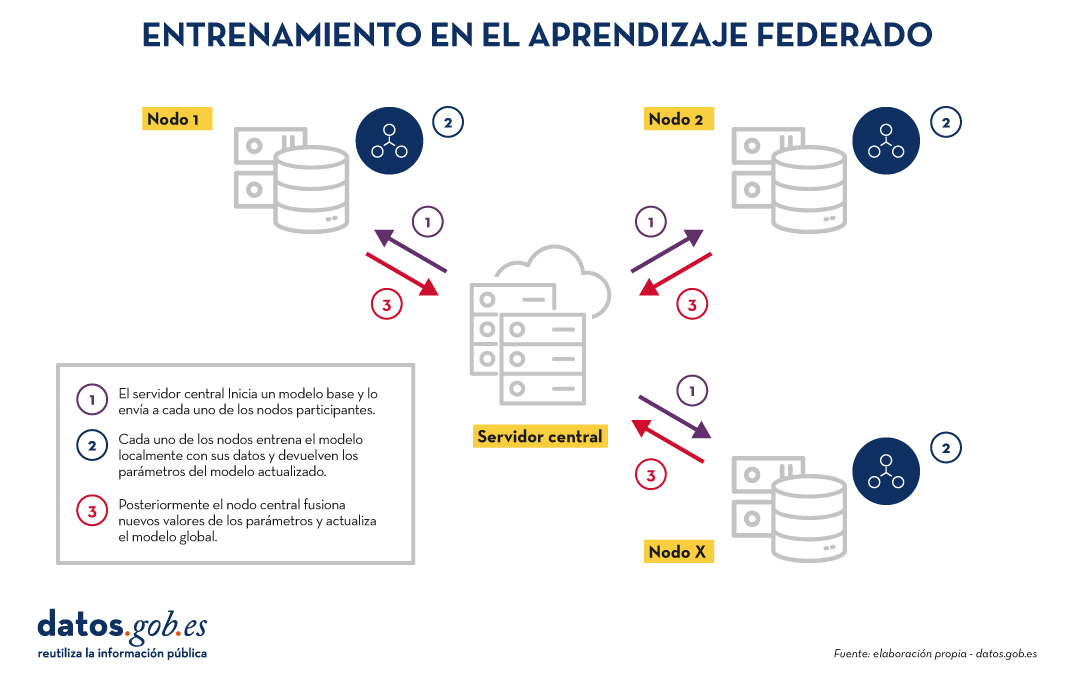
Figure 1. Visual representing the federated learning training process. Own elaboration
This approach is compatible with various machine learning algorithms, including deep neural networks, regression models, classifiers, etc.
Benefits and challenges of federated learning
Federated learning offers multiple benefits by avoiding data shuffling. Below are the most notable examples:
- Privacy and compliance: by remaining at source, data exposure risks are significantly reduced and compliance with regulations such as the General Data Protection Regulation (GDPR) is facilitated.
- Data sovereignty: Each entity retains full control over its data, which avoids competitive conflicts.
- Efficiency: avoids the cost and complexity of exchanging large volumes of data, speeding up processing and development times.
- Trust: facilitates frictionless collaboration between organisations.
There are several use cases in which federated learning is necessary, for example:
- Health: Hospitals and research centres can collaborate on predictive models without sharing patient data.
- Finance: banks and insurers can build fraud detection or risk-sharing analysis models, while respecting the confidentiality of their customers.
- Smart tourism: tourist destinations can analyse visitor flows or consumption patterns without the need to unify the databases of their stakeholders (both public and private).
- Industry: Companies in the same industry can train models for predictive maintenance or operational efficiency without revealing competitive data.
While its benefits are clear in a variety of use cases, federated learning also presents technical and organisational challenges:
- Data heterogeneity: Local data may have different formats or structures, making training difficult. In addition, the layout of this data may change over time, which presents an added difficulty.
- Unbalanced data: Some nodes may have more or higher quality data than others, which may skew the overall model.
- Local computational costs: Each node needs sufficient resources to train the model locally.
- Synchronisation: the training cycle requires good coordination between nodes to avoid latency or errors.
Beyond federated learning
Although the most prominent application of federated computing is federated learning, many additional applications in data management are emerging, such as federated data analytics (federated analytics). Federated data analysis allows statistical and descriptive analyses to be performed on distributed data without the need to move the data to the consumers; instead, each provider performs the required statistical calculations locally and only shares the aggregated results with the consumer according to their requirements and permissions. The following table shows the differences between federated learning and federated data analysis.
|
Criteria |
Federated learning |
Federated data analysis |
|
Target |
Prediction and training of machine learning models. | Descriptive analysis and calculation of statistics. |
| Task type | Predictive tasks (e.g. classification or regression). | Descriptive tasks (e.g. means or correlations). |
| Example | Train models of disease diagnosis using medical images from various hospitals. | Calculation of health indicators for a health area without moving data between hospitals. |
| Expected output | Modelo global entrenado. | Resultados estadísticos agregados. |
| Nature | Iterativa. | Directa. |
| Computational complexity | Alta. | Media. |
| Privacy and sovereignty | High | Average |
| Algorithms | Machine learning. | Statistical algorithms. |
Figure 1. Comparative table. Source: own elaboration
Federated learning and open data: a symbiosis to be explored
In principle, open data resolves privacy issues prior to publication, so one would think that federated learning techniques would not be necessary. Nothing could be further from the truth. The use of federated learning techniques can bring significant advantages in the management and exploitation of open data. In fact, the first aspect to highlight is that open data portals such as datos.gob.es or data.europa.eu are federated environments. Therefore, in these portals, the application of federated learning on large datasets would allow models to be trained directly at source, avoiding transfer and processing costs. On the other hand, federated learning would facilitate the combination of open data with other sensitive data without compromising the privacy of the latter. Finally, the nature of a wide variety of open data types is very dynamic (such as traffic data), so federated learning would enable incremental training, automatically considering new updates to open datasets as they are published, without the need to restart costly training processes.
Federated learning, the basis for privacy-friendly AI
Federated machine learning represents a necessary evolution in the way we develop artificial intelligence services, especially in contexts where data is sensitive or distributed across multiple providers. Its natural alignment with the concept of the data space makes it a key technology to drive innovation based on data sharing, taking into account privacy and maintaining data sovereignty.
As regulation (such as the European Health Data Space Regulation) and data space infrastructures evolve, federated learning, and other types of federated computing, will play an increasingly important role in data sharing, maximising the value of data, but without compromising privacy. Finally, it is worth noting that, far from being unnecessary, federated learning can become a strategic ally to improve the efficiency, governance and impact of open data ecosystems.
Jose Norberto Mazón, Professor of Computer Languages and Systems at the University of Alicante. The contents and views reflected in this publication are the sole responsibility of the author.
Blog
Artificial Intelligence (AI) is no longer a futuristic concept and has become a key tool in our daily lives. From movie or series recommendations on streaming platforms to virtual assistants like Alexa or Google Assistant on our devices, AI is everywhere. But how do you build an AI model? Despite what it might seem, the process is less intimidating if we break it down into clear and understandable steps.
Step 1: Define the problem
Before we start, we need to be very clear about what we want to solve. AI is not a magic wand: different models will work better in different applications and contexts so it is important to define the specific task we want to execute. For example, do we want to predict the sales of a product? Classify emails as spam or non-spam? Having a clear definition of the problem will help us structure the rest of the process.
In addition, we need to consider what kind of data we have and what the expectations are. This includes determining the desired level of accuracy and the constraints of available time or resources.
Step 2: Collect the data
The quality of an AI model depends directly on the quality of the data used to train it. This step consists of collecting and organising the data relevant to our problem. For example, if we want to predict sales, we will need historical data such as prices, promotions or buying patterns.
Data collection starts with identifying relevant sources, which can be internal databases, sensors, surveys... In addition to the company's own data, there is a wide ecosystem of data, both open and proprietary, that can be drawn upon to build more powerful models. For example, the Government of Spain makes available through the datos.gob.es portal multiple sets of open data published by public institutions. On the other hand, Amazon Web Services (AWS) through its AWS Data Exchange portal allows access and subscription to thousands of proprietary datasets published and maintained by different companies and organisations.
The amount of data required must also be considered here. AI models often require large volumes of information to learn effectively. It is also crucial that the data are representative and do not contain biases that could affect the results. For example, if we train a model to predict consumption patterns and only use data from a limited group of people, it is likely that the predictions will not be valid for other groups with different behaviours.
Step 3: Prepare and explore the data
Once the data have been collected, it is time to clean and normalise them. In many cases, raw data may contain problems such as errors, duplications, missing values, inconsistencies or non-standardised formats. For example, you might find empty cells in a sales dataset or dates that do not follow a consistent format. Before feeding the model with this data, it is essential to fit it to ensure that the analysis is accurate and reliable. This step not only improves the quality of the results, but also ensures that the model can correctly interpret the information.
Once the data is clean, it is essential to perform feature engineering (feature engineering), a creative process that can make the difference between a basic model and an excellent one. This phase consists of creating new variables that better capture the nature of the problem we want to solve. For example, if we are analysing onlinesales, in addition to using the direct price of the product, we could create new characteristics such as the price/category_average ratio, the days since the last promotion, or variables that capture the seasonality of sales. Experience shows that well-designed features are often more important for the success of the model than the choice of the algorithm itself.
In this phase, we will also carry out a first exploratory analysis of the data, seeking to familiarise ourselves with the data and detect possible patterns, trends or irregularities that may influence the model. Further details on how to conduct an exploratory data analysis can be found in this guide .
Another typical activity at this stage is to divide the data into training, validation and test sets. For example, if we have 10,000 records, we could use 70% for training, 20% for validation and 10% for testing. This allows the model to learn without overfitting to a specific data set.
To ensure that our evaluation is robust, especially when working with limited datasets, it is advisable to implement cross-validationtechniques. This methodology divides the data into multiple subsets and performs several iterations of training and validation. For example, in a 5-fold cross-validation, we split the data into 5 parts and train 5 times, each time using a different part as the validation set. This gives us a more reliable estimate of the real performance of the model and helps us to detect problems of over-fitting or variability in the results.
Step 4: Select a model
There are multiple types of AI models, and the choice depends on the problem we want to solve. Common examples are regression, decision tree models, clustering models, time series models or neural networks. In general, there are supervised models, unsupervised models and reinforcement learning models. More detail can be found in this post on how machines learn.
When selecting a model, it is important to consider factors such as the nature of the data, the complexity of the problem and the ultimate goal. For example, a simple model such as linear regression may be sufficient for simple, well-structured problems, while neural networks or advanced models might be needed for tasks such as image recognition or natural language processing. In addition, the balance between accuracy, training time and computational resources must also be considered. A more accurate model generally requires more complex configurations, such as more data, deeper neural networks or optimised parameters. Increasing the complexity of the model or working with large datasets can significantly lengthen the time needed to train the model. This can be a problem in environments where decisions must be made quickly or resources are limited and require specialised hardware, such as GPUs or TPUs, and larger amounts of memory and storage.
Today, many open source libraries facilitate the implementation of these models, such as TensorFlow, PyTorch or scikit-learn.
Step 5: Train the model
Training is at the heart of the process. During this stage, we feed the model with training data so that it learns to perform its task. This is achieved by adjusting the parameters of the model to minimise the error between its predictions and the actual results.
Here it is key to constantly evaluate the performance of the model with the validation set and make adjustments if necessary. For example, in a neural network-type model we could test different hyperparameter settings such as learning rate, number of hidden layers and neurons, batch size, number of epochs, or activation function, among others.
Step 6: Evaluate the model
Once trained, it is time to test the model using the test data set we set aside during the training phase. This step is crucial to measure how it performs on data that is new to the model and ensures that it is not "overtrained", i.e. that it not only performs well on training data, but that it is able to apply learning on new data that may be generated on a day-to-day basis.
When evaluating a model, in addition to accuracy, it is also common to consider:
- Confidence in predictions: assess how confident the predictions made are.
- Response speed: time taken by the model to process and generate a prediction.
- Resource efficiency: measure how much memory and computational usage the model requires.
- Adaptability: how well the model can be adjusted to new data or conditions without complete retraining.
Step 7: Deploy and maintain the model
When the model meets our expectations, it is ready to be deployed in a real environment. This could involve integrating the model into an application, automating tasks or generating reports.
However, the work does not end here. The AI needs continuous maintenance to adapt to changes in data or real-world conditions. For example, if buying patterns change due to a new trend, the model will need to be updated.
Building AI models is not an exact science, it is the result of a structured process that combines logic, creativity and perseverance. This is because multiple factors are involved, such as data quality, model design choices and human decisions during optimisation. Although clear methodologies and advanced tools exist, model building requires experimentation, fine-tuning and often an iterative approach to obtain satisfactory results. While each step requires attention to detail, the tools and technologies available today make this challenge accessible to anyone interested in exploring the world of AI.
ANNEX I - Definitions Types of models
-
Regression: supervised techniques that model the relationship between a dependent variable (outcome) and one or more independent variables (predictors). Regression is used to predict continuous values, such as future sales or temperatures, and may include approaches such as linear, logistic or polynomial regression, depending on the complexity of the problem and the relationship between the variables.
-
Decision tree models: supervised methods that represent decisions and their possible consequences in the form of a tree. At each node, a decision is made based on a characteristic of the data, dividing the set into smaller subsets. These models are intuitive and useful for classification and prediction, as they generate clear rules that explain the reasoning behind each decision.
-
Clustering models: unsupervised techniques that group data into subsets called clusters, based on similarities or proximity between the data. For example, customers with similar buying habits can be grouped together to personalise marketing strategies. Models such as k-means or DBSCAN allow useful patterns to be identified without the need for labelled data.
-
Time series models: designed to work with chronologically ordered data, these models analyse temporal patterns and make predictions based on history. They are used in cases such as demand forecasting, financial analysis or meteorology. They incorporate trends, seasonality and relationships between past and future data.
-
Neural networks: models inspired by the workings of the human brain, where layers of artificial neurons process information and detect complex patterns. They are especially useful in tasks such as image recognition, natural language processing and gaming. Neural networks can be simple or deep learning, depending on the problem and the amount of data.
-
Supervised models: these models learn from labelled data, i.e., sets in which each input has a known outcome. The aim is for the model to generalise to predict outcomes in new data. Examples include spam and non-spam mail classification and price predictions.
-
Unsupervised models: twork with unlabelled data, looking for hidden patterns, structures or relationships within the data. They are ideal for exploratory tasks where the expected outcome is not known in advance, such as market segmentation or dimensionality reduction.
- Reinforcement learning model: in this approach, an agent learns by interacting with an environment, making decisions and receiving rewards or penalties based on performance. This type of learning is useful in problems where decisions affect a long-term goal, such as training robots, playing video games or developing investment strategies.
Content prepared by Juan Benavente, senior industrial engineer and expert in technologies linked to the data economy. The contents and points of view reflected in this publication are the sole responsibility of the author.
Blog
The increasing complexity of machine learning models and the need to optimise their performance has been driving the development of AutoML (Automated Machine Learning) for years. This discipline seeks to automate key tasks in the model development lifecycle, such as algorithm selection, data processing and hyperparameter optimisation.
AutoML allows users to develop models more easily and quickly. It is an approach that facilitates access to the discipline, making it accessible to professionals with less programming experience and speeding up processes for those with more experience. Thus, for a user with in-depth programming knowledge, AutoML can also be of interest. Thanks to auto machine learning, this user could automatically apply the necessary technical settings, such as defining variables or interpreting the results in a more agile way.
In this post, we will discuss the keys to these automation processes and compile a series of free and/or freemium open source tools that can help you to deepen your knowledge of AutoML.
Learn how to create your own machine learning modeling
As indicated above, thanks to automation, the training and evaluation process of models based on AutoML tools is faster than in a usual machine learning (ML) process, although the stages for model creation are similar.
In general, the key components of AutoML are:
- Data processing: automates tasks such as data cleaning, transformation and feature selection.
- Model selection: examines a variety of machine learning algorithms and chooses the most appropriate one for the specific task.
- Hyperparameter optimisation: automatically adjusts model parameters to improve model performance.
- Model evaluation: provides performance metrics and validates models using techniques such as cross-validation.
- Implementation and maintenance: facilitates the implementation of models in production and, in some cases, their upgrade.
All these elements together offer a number of advantages as shown in the picture below
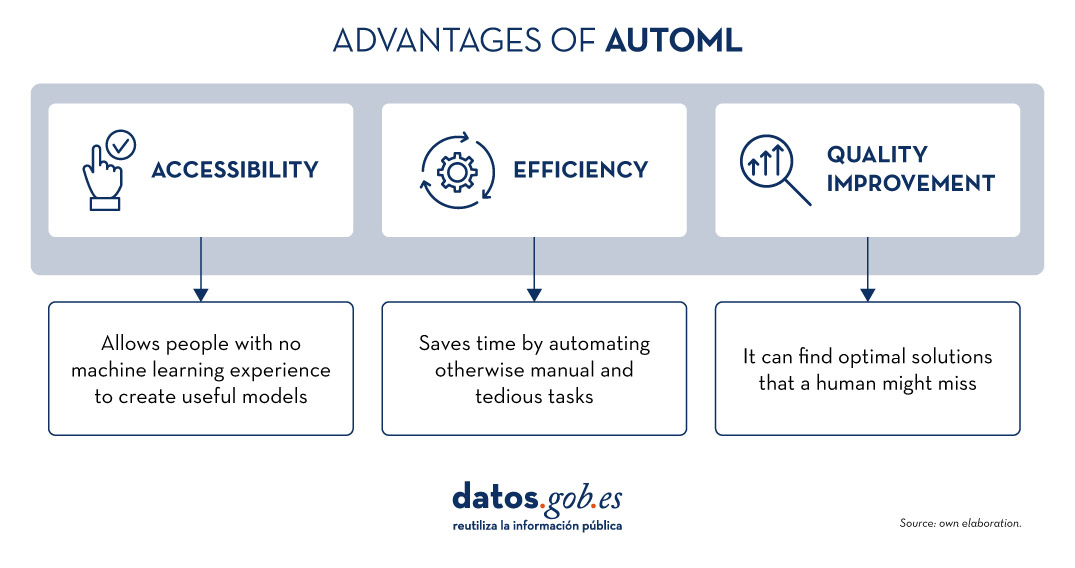
Figure 1. Source: Own elaboration
Examples of AutoML tools
Although AutoML can be very useful, it is important to highlight some of its limitations such as the risk of overfitting (when the model fits too closely to the training data and does not generalise knowledge well), the loss of control over the modelling process or the interpretability of certain results.
However, as AutoML continues to gain ground in the field of machine learning, a number of tools have emerged to facilitate its implementation and use. In the following, we will explore some of the most prominent open source AutoML tools:
H2O.ai, versatile and scalable, ideal for enterprises
H2O.ai is an AutoML platform that includes deep learning and machine learning models such as XGBoost (machine learning library designed to improve model efficiency) and a graphical user interface. This tool is used in large-scale projects and allows a high level of customisation. H2O.ai includes options for classification, regression and time series models, and stands out for its ability to handle large volumes of data.
Although H2O makes machine learning accessible to non-experts, some knowledge and experience in data science is necessary to get the most out of the tool. In addition, it enables a large number of modelling tasks that would normally require many lines of code, making it easier for the data analyst. H2O offers a freemium model and also has an open source community version.
TPOT, based on genetic algorithms, good option for experimentation
TPOT (Tree-based Pipeline Optimization Tool) is a free and open source Python machine learning tool that optimises processes through genetic programming.
This solution looks for the best combination of data pre-processing and machine learning models for a specific dataset. To do so, it uses genetic algorithms that allow it to explore and optimise different pipelines, data transformation and models. This is a more experimental option that may be less intuitive, but offers innovative solutions.
In addition, TPOT is built on top of the popular scikit-learn library, so models generated by TPOT can be used and adjusted with the same techniques that would be used in scikit-learn..
Auto-sklearn, accessible to scikit-learn users and efficient on structured problems
Like TPOT, Auto-sklearn is based on scikit-learn and serves to automate algorithm selection and hyperparameter optimisation in machine learning models in Python.
In addition to being a free and open source option, it includes techniques for handling missing data, a very useful feature when working with real-world datasets. On the other hand, Auto-sklearn offers a simple and easy-to-use API, allowing users to start the modelling process with few lines of code..
BigML, integration via REST APIs and flexible pricing models
BigML is a consumable, programmable and scalable machine learning platform that, like the other tools mentioned above, facilitates the resolution and automation of classification, regression, time series forecasting, cluster analysis, anomaly detection, association discovery and topic modelling tasks. It features an intuitive interface and a focus on visualisation that makes it easy to create and manage ML models, even for users with little programming knowledge.
In addition, BigML has a REST API that enables integration with various applications and languages, and is scalable to handle large volumes of data. On the other hand, it offers a flexible pricing model based on usage, and has an active community that regularly updates the learning resources available.
The following table shows a comparison between these tools:
| H2O.ai | TPOT | Auto-sklearn | BigML | |
|---|---|---|---|---|
| Use | For large-scale projects. | To experiment with genetic algorithms and optimise pipelines. | For users of scikit-learn who want to automate the model selection process and for structured tasks. | To create and deploy ML models in an accessible and simple way. |
| Difficult to configure | Simple, with advanced options. | Medium difficulty. A more technical option by genetic algorithms. | Medium difficulty. It requires technical configuration, but is easy for scikit-learn users. | Simple Intuitive interface with customisation options. |
| Ease of use | Easy to use with the most common programming languages. It has a graphical interface and APIs for R and Python. | Easy to use, but requires knowledge of Python. | Easy to use, but requires prior knowledge. Easy option for scikit-learn users. | Easy to use, focused on visualisation, no programming skills required. |
| Scalability | Scalable to large volumes of data. | Focus on small and medium-sized datasets. Less efficient on large datasets | Effective on small and medium sized datasets. | Scalable for different sizes of datasets. |
| Interoperability | Compatible with several libraries and languages, such as Java, Scala, Python and R. | Based on Python. | Based on Python integrating scikit-learn. | Compatible with REST APIs and various languages. |
| Community | Extensive and active sharing of reference documentation. | Less extensive, but growing. | It is supported by the scikit-learn community. | Active community and support available. |
| Disadvantages | Although versatile, its advanced customisation could be challenging for beginners without technical experience. | May be less efficient on large data sets due to the intensive nature of genetic algorithms. | Its performance is optimised for structured tasks (structured data), which may limit its use for other types of problems. | Its advanced customisation could be challenging for beginners without technical experience |
Figure 2. Comparative table of autoML tools. Source: Own elaboration
Each tool has its own value proposition, and the choice will depend on the specific needs and environment in which the user works.
Here are some examples of free and open source tools that you can explore to get into AutoML. We invite you to share your experience with these or other tools in the comments section below.
If you are looking for tools to help you in data processing, from datos.gob.es we offer you the report "Tools for data processing and visualisation", as well as the following monographic articles:.
Blog
In the process of analysing data and training machine learning models, it is essential to have an adequate dataset. Therefore, the questions arise: how should you prepare your datasets for machine learning and analytics, and how can you be confident that the data will lead to robust conclusions and accurate predictions?
The first thing to consider when preparing your data is to know the type of problem you are trying to solve. For example, if your intention is to create a machine learning model capable of recognising someone's emotional state from their facial expressions, you will need a dataset with images or videos of people's faces. Or, perhaps, the goal is to create a model that identifies unwanted emails. For this, you will need data in text format from emails.
Furthermore, the data required also depends on the type of algorithm you want to use. Supervised learning algorithms, such as linear regression or decision trees, require a field containing the true value of an outcome for the model to learn from. In addition to this true value, called the target, they require fields containing information about the observations, known as features. In contrast, unsupervised learning algorithms, such as k-means clustering or recommendation systems based on collaborative filtering, usually only need features.
However, finding the data is only half the job. Real-world datasets can contain all sorts of errors that can render all the work useless if they are not detected and corrected before starting. In this post, we'll introduce some of the main pitfalls that can be found in datasets for machine learning and analytics, as well as some ways in which the collaborative data science platform, Datalore, can help spot them quickly and remedy them.
Is the data representative of what you want to measure?
Most datasets for machine learning projects or analytics are not designed specifically for that purpose. In the absence of a metadata dictionary or an explanation of what the fields in the dataset mean, the user may have to figure out the unknown based on the information available to them.
One way to determine what features in a dataset measure is to check their relationships to other features. If two fields are assumed to measure similar things, one would expect them to be closely related. Conversely, if two domains measure very different things, you would expect them to be unrelated. These ideas are known as convergent and discriminant validity, respectively.
Another important thing to check is whether any of the traits are too closely related to the target audience. If this happens, it may indicate that this feature is accessing the same information as the target to be predicted. This phenomenon is known as feature leakage. If such data is used, there is a risk of artificially inflating the performance of the model.
In this sense, Datalore allows you to quickly scan the relationship between continuous variables by means of the correlation graph in the Visualise tab for a DataFrame. Another way to test these relationships is by using bar charts or cross tabulations, or effect size measures such as the coefficient of determination or Cramer's V.
Is the dataset properly filtered and cleaned?
Datasets can contain all kinds of inconsistencies that can negatively affect our models or analyses. Some of the most important indicators of dirty data are:
- Implausible values: This includes values that are out of range, such as negatives in a count variable or frequencies that are much higher or lower than expected for a particular field.
- Outliers: These are extreme values, which can represent anything from coding errors that occurred at the time the data were written, to rare but real values that lie outside the bulk of the other observations.
- Missing values: The pattern and amount of missing data determines the impact it will have, the most serious being those related to the target or features.
Dirty data can undermine the quality of your analyses and models, largely because it distorts conclusions or leads to poor model performance. Datalore's Statistics tab makes it easy to check for these problems by showing at a glance the distribution, the number of missing values and the presence of outliers for each field. Datalore also facilitates the exploration of the raw data and allows to perform basic filtering, sorting and column selection operations directly in a DataFrame, exporting the Python code corresponding to each action to a new cell.
Are the variables balanced?
Unbalanced data occur when categorical fields have an uneven distribution of observations across all classes. This situation can cause significant problems for models and analyses. When you have a very unbalanced target, you can create lazy models that can still achieve good performance by simply predicting the majority class by default. Let's take an extreme example: we have a dataset where 90% of the observations fall into one of the target classes and 10% fall into the other. If we always predicted the majority class for this dataset, we would still get an accuracy of 90%, which shows that, in these cases, a model that learns nothing from the features can perform excellently.
Features are also affected by class imbalance. Models work by learning patterns, and when classes are too small, it is difficult for models to make predictions for these groups. These effects can be exacerbated when you have several unbalanced features, leading to situations where a particular combination of rare classes can only occur in a handful of observations.
Unbalanced data can be rectified by various sampling techniques. Undersampling involves reducing the number of observations in the larger classes to equalise the distribution of the data, and oversampling involves creating more data in the smaller classes. There are many ways to do this. Examples include using Python packages such as imbalanced-learn or services such as Gretel. Unbalanced features can also be corrected by feature engineering, which aims to combine classes within a field without losing information.
In short, is the dataset representative?
When creating a dataset, you have in mind a target group for which you want your model or analysis to work. For example, a model to predict the likelihood that American men interested in fashion will buy a certain brand. This target group is the population you want to be able to make generalisations about. However, as it is often impractical to collect information on all individuals who constitute this part of the population, a subset called a sample is used instead.
Sometimes problems arise that cause the sample data for the machine learning model and analysis to misrepresent the behaviour of the population. This is called data bias. For example, the sample may not capture all subgroups of the population, a type of bias called selection bias.
One way to check for bias is to inspect the distribution of the fields in your data and check that they make sense based on what you know about that population group. Using Datalore's Statistics tab allows you to scan the distribution of continuous and categorical variables in a DataFrame.
Is the actual performance of the models being measured?
A final issue that can put you in a bind is measuring the performance of your models. Many models are prone to a problem called overfitting which is when the model fits the training data so well that it does not generalise well to new data. The telltale sign of overfitting is a model that performs extremely well on training data and underperforms on new data. The way to account for this is to split the dataset into several sets: a training set to train the model, a validation set to compare the performance of different models, and a final test set to check how the model will perform in the real world.
However, creating a clean training-validation-testing split can be tricky. A major problem is data leakage, whereby information from the other two datasets leaks into the training set. This can lead to problems ranging from the obvious, such as duplicate observations ending up in all three datasets, to more subtle ones, such as using information from the entire dataset to perform feature pre-processing before splitting the data. In addition, it is important that the three datasets have the same distribution of targets and features, so that each is a representative sample of the population.
To avoid any problems, you should split the dataset into training, validation and test sets at the beginning of your work, prior to any exploration or processing. To ensure that each dataset has the same distribution of each field, you can use a method such as scikit-learn's train_test_split, which is specifically designed to create representative splits of the data. Finally, it is advisable to compare the descriptive statistics of each dataset to check for signs of data leakage or uneven splits, which is easily done using the Statistics tab in Datalore.
Ultimately, there are a number of issues that can occur when preparing data for machine learning and analytics and it is important to know how to mitigate them. While this can be a time-consuming part of the work process, there are tools that can make it quicker and easier to spot problems at an early stage.
Content drawn from Jodie Burchell's post How to prepare your dataset for machine learning and analysis published in The JetBrains Datalore Blog
Blog
The humanitarian crisis following the earthquake in Haiti in 2010 was the starting point for a voluntary initiative to create maps to identify the level of damage and vulnerability by areas, and thus to coordinate emergency teams. Since then, the collaborative mapping project known as Hot OSM (OpenStreetMap) has played a key role in crisis situations and natural disasters.
Now, the organisation has evolved into a global network of volunteers who contribute their online mapping skills to help in crisis situations around the world. The initiative is an example of data-driven collaboration to solve societal problems, a theme we explore in this data.gob.es report.
Hot OSM works to accelerate data-driven collaboration with humanitarian and governmental organisations, as well as local communities and volunteers around the world, to provide accurate and detailed maps of areas affected by natural disasters or humanitarian crises. These maps are used to help coordinate emergency response, identify needs and plan for recovery.
In its work, Hot OSM prioritises collaboration and empowerment of local communities. The organisation works to ensure that people living in affected areas have a voice and power in the mapping process. This means that Hot OSM works closely with local communities to ensure that areas important to them are mapped. In this way, the needs of communities are considered when planning emergency response and recovery.
Hot OSM's educational work
In addition to its work in crisis situations, Hot OSM is dedicated to promoting access to free and open geospatial data, and works in collaboration with other organisations to build tools and technologies that enable communities around the world to harness the power of collaborative mapping.
Through its online platform, Hot OSM provides free access to a wide range of tools and resources to help volunteers learn and participate in collaborative mapping. The organisation also offers training for those interested in contributing to its work.
One example of a HOT project is the work the organisation carried out in the context of Ebola in West Africa. In 2014, an Ebola outbreak affected several West African countries, including Sierra Leone, Liberia and Guinea. The lack of accurate and detailed maps in these areas made it difficult to coordinate the emergency response.
In response to this need, HOT initiated a collaborative mapping project involving more than 3,000 volunteers worldwide. Volunteers used online tools to map Ebola-affected areas, including roads, villages and treatment centres.
This mapping allowed humanitarian workers to better coordinate the emergency response, identify high-risk areas and prioritize resource allocation. In addition, the project also helped local communities to better understand the situation and participate in the emergency response.
This case in West Africa is just one example of HOT's work around the world to assist in humanitarian crisis situations. The organisation has worked in a variety of contexts, including earthquakes, floods and armed conflict, and has helped provide accurate and detailed maps for emergency response in each of these contexts.
On the other hand, the platform is also involved in areas where there is no map coverage, such as in many African countries. In these areas, humanitarian aid projects are often very challenging in the early stages, as it is very difficult to quantify what population is living in an area and where they are located. Having the location of these people and showing access routes "puts them on the map" and allows them to gain access to resources.
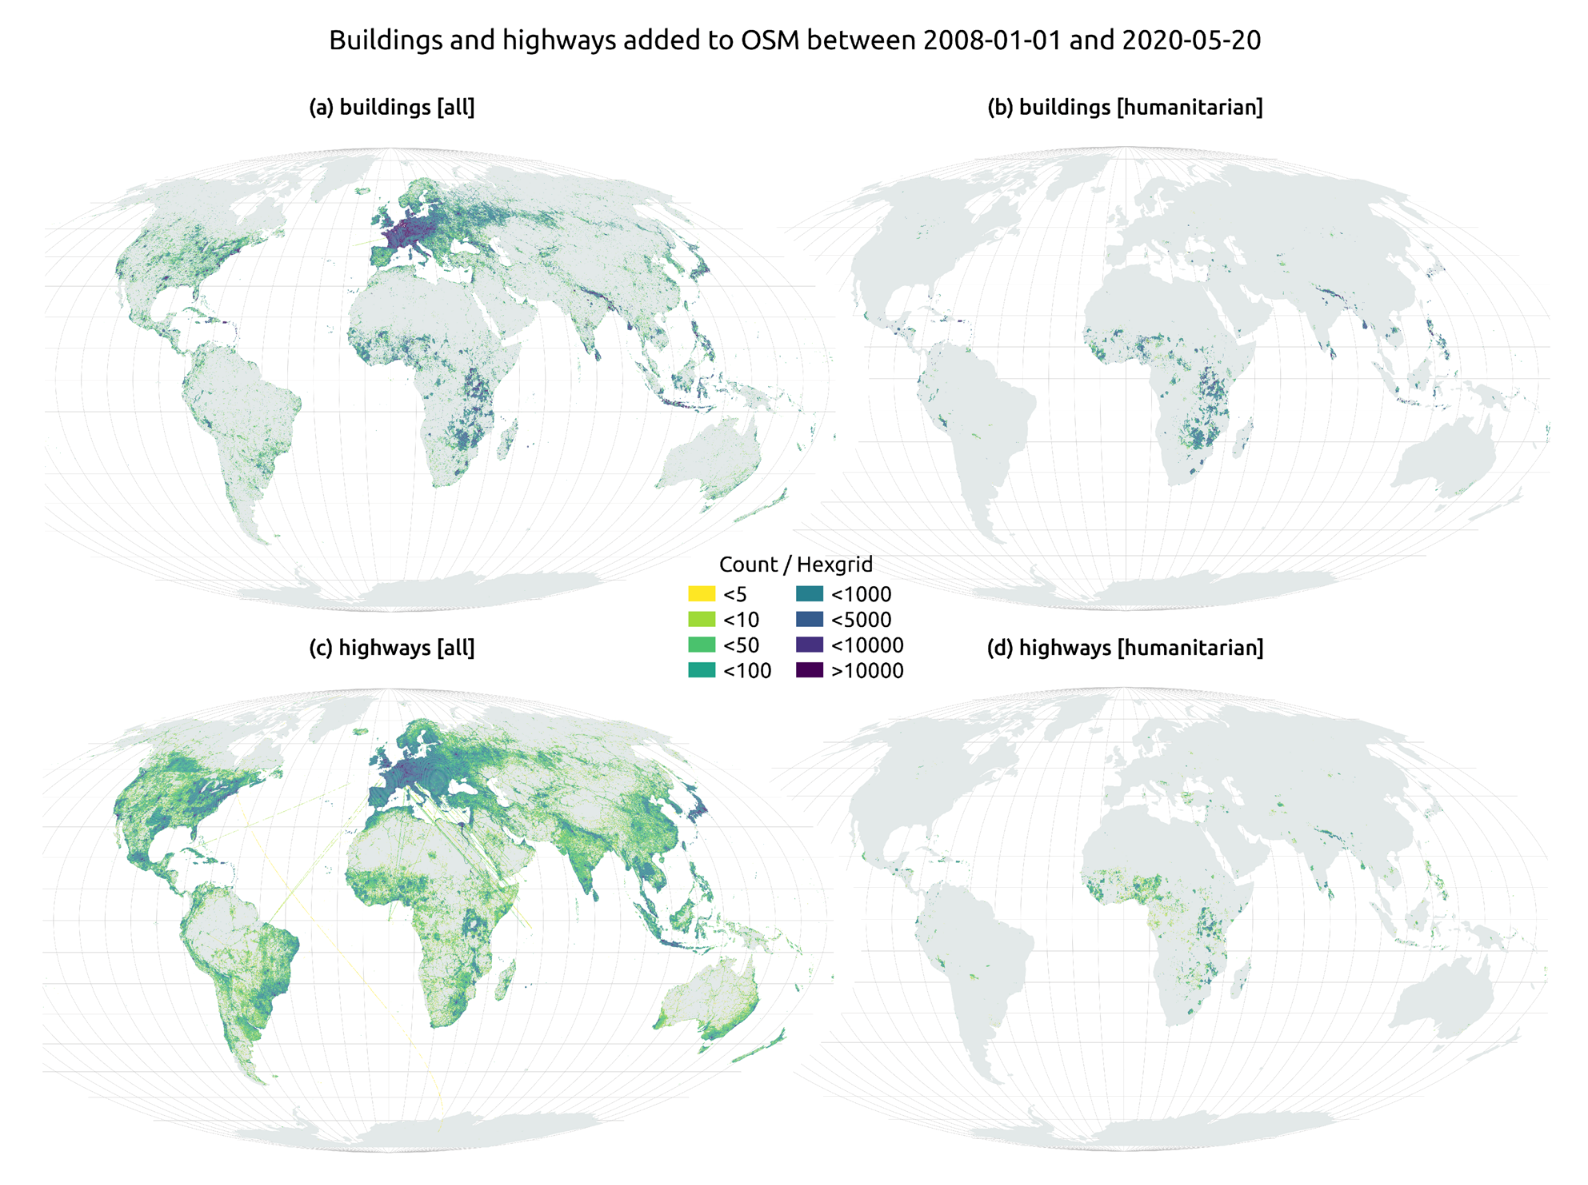
In this article The evolution of humanitarian mapping within the OpenStreetMap community by Nature, we can see graphically some of the achievements of the platform.
How to collaborate
It is easy to start collaborating with Hot OSM, just go to https://tasks.hotosm.org/explore and see the open projects that need collaboration.
This screen allows us a lot of options when searching for projects, selected by level of difficulty, organisation, location or interests among others.
To participate, simply click on the Register button.
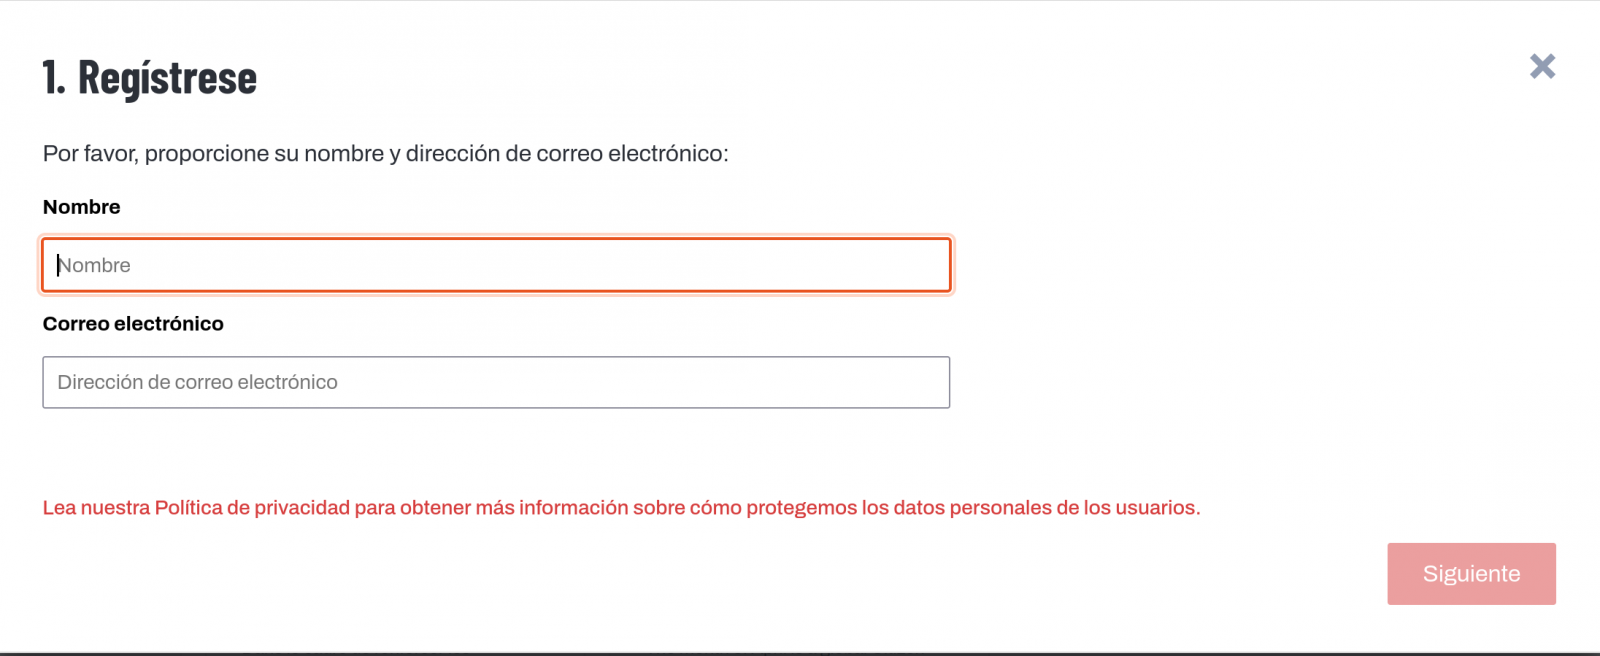
Give a name and an e-mail adress on the next screen:
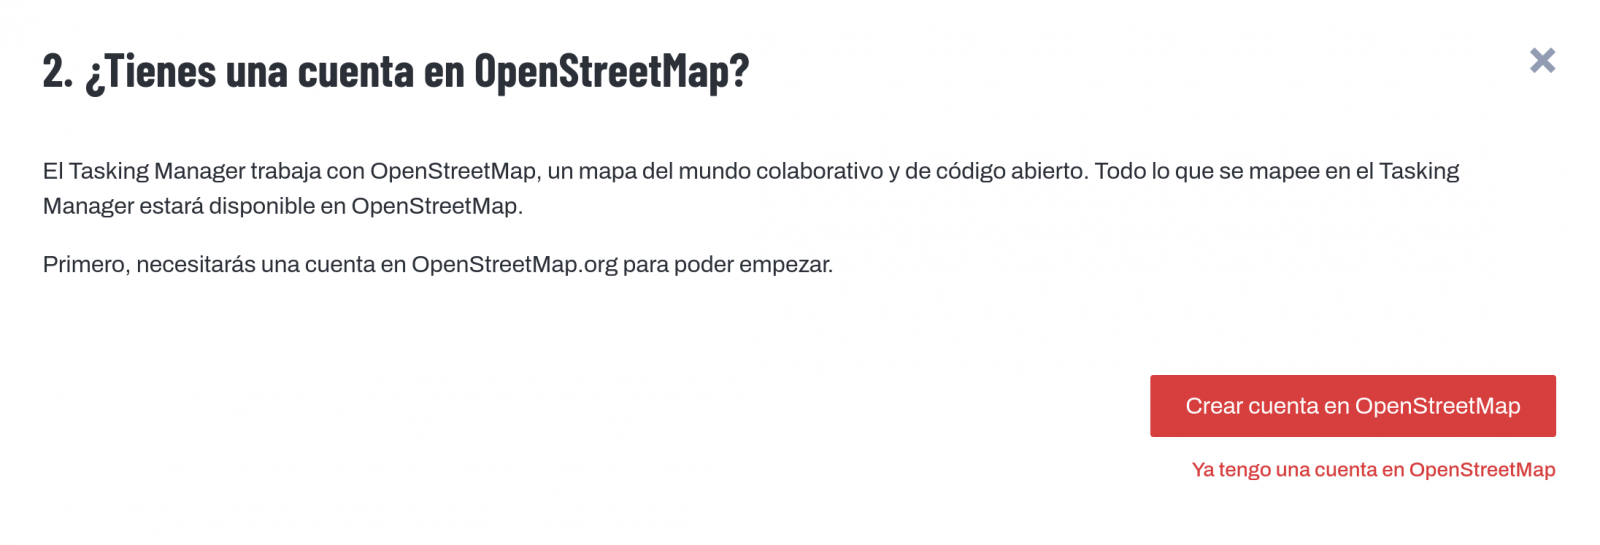
It will ask us if we have already created an account in Open Street Maps or if we want to create one.
If we want to see the process in more detail, this website makes it very easy.
Once the user has been created, on the learning page we find help on how to participate in the project.
It is important to note that the contributions of the volunteers are reviewed and validated and there is a second level of volunteers, the validators, who validate the work of the beginners. During the development of the tool, the HOT team has taken great care to make it a user-friendly application so as not to limit its use to people with computer skills.
In addition, organisations such as the Red Cross and the United Nations regularly organise mapathons to bring together groups of people for specific projects or to teach new volunteers how to use the tool. These meetings serve, above all, to remove the new users' fear of "breaking something" and to allow them to see how their voluntary work serves concrete purposes and helps other people.
Another of the project's great strengths is that it is based on free software and allows for its reuse. In the MissingMaps project's Github repository we can find the code and if we want to create a community based on the software, the Missing Maps organisation facilitates the process and gives visibility to our group.
In short, Hot OSM is a citizen science and data altruism project that contributes to bringing benefits to society through the development of collaborative maps that are very useful in emergency situations. This type of initiative is aligned with the European concept of data governance that seeks to encourage altruism to voluntarily facilitate the use of data for the common good.
Content by Santiago Mota, senior data scientist.
The contents and views reflected in this publication are the sole responsibility of the author.
Blog
Behind a voice-enabled virtual assistant, a movie recommendation on a streaming platform, or the development of some COVID-19 vaccines, there are machine learning models. This branch of artificial intelligence enables systems to learn and improve their performance.
Machine learning (ML) is one of the fields driving technological progress today, and its applications are growing every day. Examples of solutions developed with machine learning include DALL-E, the set of language models in Spanish known as MarIA, and even Chat GPT-3, a generative AI tool capable of creating content of all types, such as code for programming data visualizations from the datos.gob.es catalog.
All of these solutions work thanks to large data repositories that make system learning possible. Among these, open data plays a fundamental role in the development of artificial intelligence as it can be used to train machine learning models.
Based on this premise, along with the ongoing effort of governments to open up data, there are non-governmental organizations and associations that contribute by developing applications that use machine learning techniques aimed at improving the lives of citizens. We highlight three of them:
ML Commons is driving a better machine learning system for everyone
This initiative aims to improve the positive impact of machine learning on society and accelerate innovation by offering tools such as open datasets, best practices, and algorithms. Its founding members include companies such as Google, Microsoft, DELL, Intel AI, Facebook AI, among others.
According to ML Commons, around 80% of research in the field of machine learning is based on open data. Therefore, open data is vital to accelerate innovation in this field. However, nowadays, "most public data files available are small, static, legally restricted, and not redistributable," as David Kanter, director of ML Commons, assures.
In this regard, innovative ML technologies require large datasets with licenses that allow their reuse, that can be redistributed, and that are continually improving. Therefore, ML Commons' mission is to help mitigate that gap and thus promote innovation in machine learning.
The main goal of this organization is to create a community of open data for the development of machine learning applications. Its strategy is based on three pillars:
Firstly, creating and maintaining comprehensive open datasets, including The People's Speech, with over 30,000 hours of speech in English to train natural language processing (NLP) models, Multilingual Spoken Words, with over 23 million expressions in 50 different languages, or Dollar Street, with over 38,000 images of homes from around the world in various socio-economic situations. The second pillar involves promoting best practices that facilitate standardization, such as the MLCube project, which proposes standardizing the container process for ML models to facilitate shared use. Lastly, benchmarking in study groups to define benchmarks for the developer and research community.
Taking advantage of the benefits and being part of the ML Commons community is free for academic institutions and small companies (less than ten workers).
Datacommons synthesizes different sources of open data into a single portal
Datacommons aims to enhance democratic data flows within the cooperative and solidarity economy and its main objective is to offer purified, normalized, and interoperable data.
The variety of formats and information offered by public portals of open data can be a hindrance to research. The goal of Datacommons is to compile open data into an encyclopedic website that organizes all datasets through nodes. This way, users can access the source that interests them the most.
This platform, designed for educational and journalistic research purposes, functions as a reference tool for navigating through different sources of data. The team of collaborators works to keep the information up-to-date and interacts with the community through its email (support@datacommons.org) or GitHub forum.
Papers with Code: the open repository of materials to feed machine learning models
This is a portal that offers code, reports, data, methods, and evaluation tables in open and free format. All content on the website is licensed under CC-BY-SA, meaning it allows copying, distributing, displaying, and modifying the work, even for commercial purposes, by sharing the contributions made with the same original license.
Any user can contribute by providing content and even participate in the community's Slack channel, which is moderated by responsible individuals who protect the platform's defined inclusion policy.
As of today, Papers with Code hosts 7806 datasets that can be filtered by format (graph, text, image, tabular, etc.), task (object detection, queries, image classification, etc.), or language. The team maintaining Papers with Code belongs to the Meta Research Institute.
The goal of ML Commons, Data Commons, and Papers with Code is to maintain and grow open data communities that contribute to the development of innovative technologies, including artificial intelligence (machine learning, deep learning, etc.) with all the possibilities its development can offer to society.
As part of this process, the three organizations play a fundamental role: they offer standard and redistributable data repositories to train machine learning models. These are useful resources for academic exercises, promoting research, and ultimately facilitating the innovation of technologies that are increasingly present in our society.
Blog
After several months of tests and different types of training, the first massive Artificial Intelligence system in the Spanish language is capable of generating its own texts and summarising existing ones. MarIA is a project that has been promoted by the Secretary of State for Digitalisation and Artificial Intelligence and developed by the National Supercomputing Centre, based on the web archives of the National Library of Spain (BNE).
This is a very important step forward in this field, as it is the first artificial intelligence system expert in understanding and writing in Spanish. As part of the Language Technology Plan, this tool aims to contribute to the development of a digital economy in Spanish, thanks to the potential that developers can find in it.
The challenge of creating the language assistants of the future
MarIA-style language models are the cornerstone of the development of the natural language processing, machine translation and conversational systems that are so necessary to understand and automatically replicate language. MarIA is an artificial intelligence system made up of deep neural networks that have been trained to acquire an understanding of the language, its lexicon and its mechanisms for expressing meaning and writing at an expert level.
Thanks to this groundwork, developers can create language-related tools capable of classifying documents, making corrections or developing translation tools.
The first version of MarIA was developed with RoBERTa, a technology that creates language models of the "encoder" type, capable of generating an interpretation that can be used to categorise documents, find semantic similarities in different texts or detect the sentiments expressed in them.
Thus, the latest version of MarIA has been developed with GPT-2, a more advanced technology that creates generative decoder models and adds features to the system. Thanks to these decoder models, the latest version of MarIA is able to generate new text from a previous example, which is very useful for summarising, simplifying large amounts of information, generating questions and answers and even holding a dialogue.
Advances such as the above make MarIA a tool that, with training adapted to specific tasks, can be of great use to developers, companies and public administrations. Along these lines, similar models that have been developed in English are used to generate text suggestions in writing applications, summarise contracts or search for specific information in large text databases in order to subsequently relate it to other relevant information.
In other words, in addition to writing texts from headlines or words, MarIA can understand not only abstract concepts, but also their context.
More than 135 billion words at the service of artificial intelligence
To be precise, MarIA has been trained with 135,733,450,668 words from millions of web pages collected by the National Library, which occupy a total of 570 Gigabytes of information. The MareNostrum supercomputer at the National Supercomputing Centre in Barcelona was used for the training, and a computing power of 9.7 trillion operations (969 exaflops) was required.
Bearing in mind that one of the first steps in designing a language model is to build a corpus of words and phrases that serves as a database to train the system itself, in the case of MarIA, it was necessary to carry out a screening to eliminate all the fragments of text that were not "well-formed language" (numerical elements, graphics, sentences that do not end, erroneous encodings, etc.) and thus train the AI correctly.
Due to the volume of information it handles, MarIA is already the third largest artificial intelligence system for understanding and writing with the largest number of massive open-access models. Only the language models developed for English and Mandarin are ahead of it. This has been possible mainly for two reasons. On the one hand, due to the high level of digitisation of the National Library's heritage and, on the other hand, thanks to the existence of a National Supercomputing Centre with supercomputers such as the MareNostrum 4.
The role of BNE datasets
Since it launched its own open data portal (datos.bne.es) in 2014, the BNE has been committed to bringing the data available to it and in its custody closer: data on the works it preserves, but also on authors, controlled vocabularies of subjects and geographical terms, among others.
In recent years, the educational platform BNEscolar has also been developed, which seeks to offer digital content from the Hispánica Digital Library's documentary collection that may be of interest to the educational community.
Likewise, and in order to comply with international standards of description and interoperability, the BNE data are identified by means of URIs and linked conceptual models, through semantic technologies and offered in open and reusable formats. In addition, they have a high level of standardisation.
Next steps
Thus, and with the aim of perfecting and expanding the possibilities of use of MarIA, it is intended that the current version will give way to others specialised in more specific areas of knowledge. Given that it is an artificial intelligence system dedicated to understanding and generating text, it is essential for it to be able to cope with lexicons and specialised sets of information.
To this end, the PlanTL will continue to expand MarIA to adapt to new technological developments in natural language processing (more complex models than the GPT-2 now implemented, trained with larger amounts of data) and will seek ways to create workspaces to facilitate the use of MarIA by companies and research groups.
Content prepared by the datos.gob.es team.
Blog
Python, R, SQL, JavaScript, C++, HTML... Nowadays we can find a multitude of programming languages that allow us to develop software programmes, applications, web pages, etc. Each one has unique characteristics that differentiate it from the rest and make it more appropriate for certain tasks. But how do we know when and where to use each language? In this article we give you some clues.
Types of programming languages
Programming languages are syntactic and semantic rules that allow us to execute a series of instructions. Depending on their level of complexity, we can speak of different levels:
- Low-level languages: they use basic instructions that are directly interpreted by the machine and are difficult for humans to understand. They are custom-designed for each hardware and cannot be migrated, but they are very efficient, as they make the most of the characteristics of each machine.
- High-level languages: they use clear instructions using natural language, which is more understandable by humans. These languages emulate our way of thinking and reasoning, but must then be translated into machine language through translators/interpreters or compilers. They can be migrated and are not hardware-dependent.
Medium-level languages are sometimes also described as languages that, although they function like a low-level language, allow some abstract machine-independent handling.
The most widely used programming languages
In this article we are going to focus on the most used high-level languages in data science. To do so, we look at this survey, conducted by Anaconda in 2021, and the article by KD Nuggets.
How often are the following programming languages used?
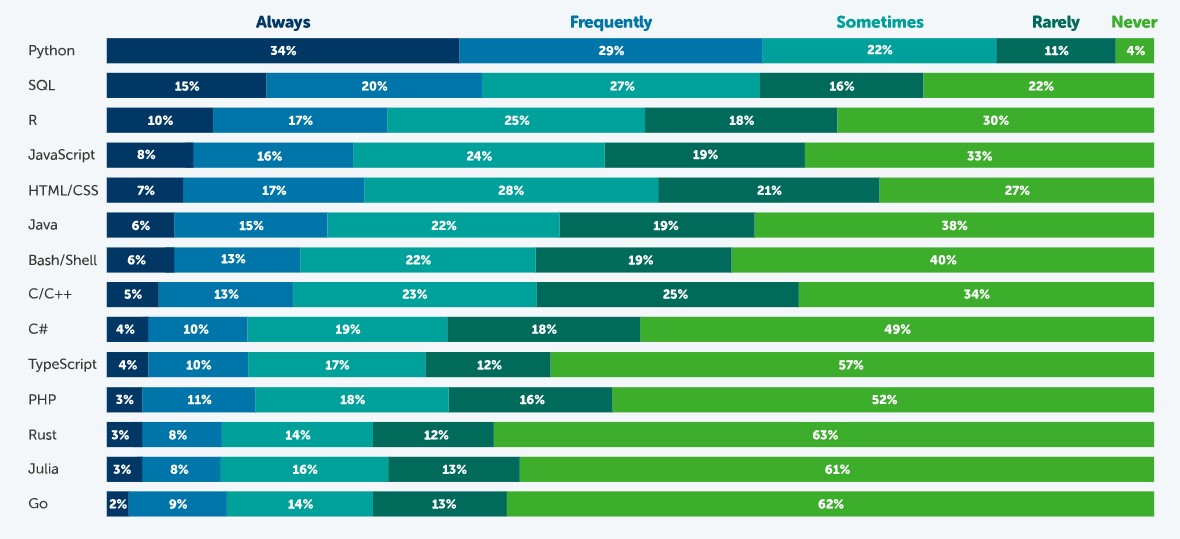
Source: State of Data Science in 2021, Anaconda.
According to this survey, the most popular language is Python. 63% of respondents - 3,104 data scientists, researchers, students and data professionals from around the world - indicated that they use Python always or frequently and only 4% indicated that they never use it. This is because it is a very versatile language, which can be used in the various tasks that exist throughout a data science project.
A data science project has different phases and tasks. Some languages can be used to perform different tasks, but with unequal performance. The following table, compiled by KD Nuggets, shows which language is most recommended for some of the most popular tasks:
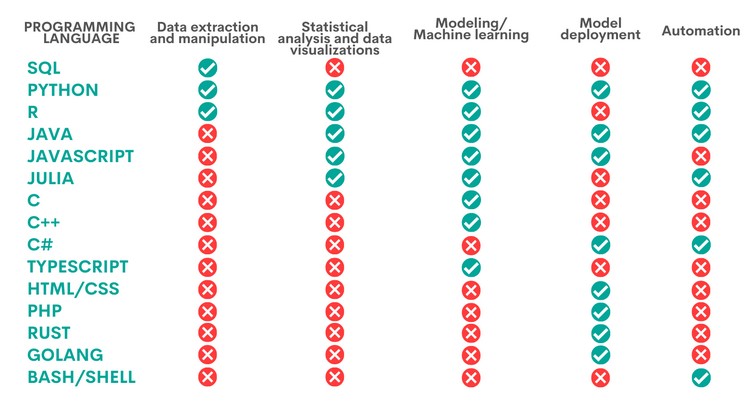
Source: Data Science Programming Languages and When To Use Them, KD Nuggets, 2022.
As we can see, Python is the only language that is appropriate for all the areas analysed by KD Nuggets, although there are other options that are also very interesting, depending on the task to be carried out, as we will see below:
- Languages for data extraction and manipulation. These tasks are aimed at obtaining the data and debugging them in order to achieve a homogeneous structure, without incomplete data, free of errors and in the right format. For this purpose, it is recommended to perform an Exploratory Data Analysis. SQL is the programming language that excels the most with respect to data extraction, especially when working with relational databases. It is fast at retrieving data and has a standardised syntax, which makes it relatively simple. However, it is more limited when it comes to data manipulation. A task in which Python and R, two programs that have a large number of libraries for these tasks, give better results.
- Statistical analysis and data visualisation. This involves processing data to find patterns that are then converted into knowledge. There are different types of analysis depending on their purpose: to learn more about our environment, to make predictions or to obtain recommendations. The best language for this is R, an interpreted language that also has a programming environment, R-Studio, and a set of very flexible and versatile tools for statistical computing. Python, Java and Julia are other tools that perform well in this task, for which JavaScript can also be used. The above languages allow, in addition to performing analyses, the creation of graphical visualisations that facilitate the understanding of the information.
- Modelling/machine learning (ML). If we want to work with machine learning and build algorithms, Python, Java, Java/JavaScript, Julia and TypeScript are the best options. All of them simplify the task of writing code, although it is necessary to have extensive knowledge to be able to work with the different machine learning techniques. More experienced users can work with C/C++, a very machine-readable programming language, but with a lot of code, which can be difficult to learn. In contrast, R can be a good choice for less experienced users, although it is slower and not well suited for complex neural networks.
- Model deployment. Once a model has been created, it is necessary to deploy it, taking into account all the necessary requirements for its entry into production in a real environment. For this purpose, the most suitable languages are Python, Java, JavaScript and C#, followed by PHP, Rust, GoLang and, if we are working with basic applications, HTML/CSS.
- Automation. While not all parts of a data scientist's job can be automated, there are some tedious and repetitive tasks whose automation speeds up performance. Python, for example, has a large number of libraries for automating machine learning tasks. If we are working with mobile applications, then Java is our best option. Other options are C# (especially useful for automating model building), Bash/Shell (for data extraction and manipulation) and R (for statistical analysis and visualisations).
Ultimately, the programming language we use will depend entirely on the task at hand and our capabilities. Not all data science professionals need to know all languages, but should choose the one that is most appropriate for their daily work.
Some additional resources to learn more about these languages
At datos.gob.es we have prepared some guides and resources that may be useful for you to learn some of these languages:
- Data processing and visualization tools
- Courses to learn more about R
- Courses to learn more about Python
- Online courses to learn more about data visualization
- R and Python Communities for Developer
Content prepared by the datos.gob.es team.
Blog
Programming libraries refer to the sets of code files that have been created to develop software in a simple way . Thanks to them, developers can avoid code duplication and minimize errors with greater agility and lower cost. There are many bookstores, focused on different activities. A few weeks ago we saw some examples of libraries for creating visualizations , and this time we are going to focus on useful libraries for machine learning tasks .
These libraries are highly practical when implementing Machine Learning flows . This discipline, belonging to the field of Artificial Intelligence, uses algorithms that offer, for example, the ability to identify patterns in massive data or the ability to help develop predictive analysis.
Below, we show you some of the most popular data analysis and Machine Learning libraries that currently exist for the main programming languages, such as Python or R:
Libraries for Python
NumPy
- Description:
This Python library is specialized in mathematical computation and big data analysis . It allows working with arrays that allow representing collections of data of the same type in various dimensions, as well as very efficient functions for their manipulation.
- Support materials:
Here we find the Beginner's Guide , with basic concepts and tutorials, the User's Guide , with information on general features, or the Contributor's Guide , to help maintain and develop the code or write technical documentation. NumPy also has a Reference Guide that details functions, modules and objects included in this library, as well as a series of tutorials to learn how to use it easily.
Pandas
- Description :
It is one of the most used libraries for data processing in Python . This data analysis and manipulation tool is characterized, among other aspects, by defining new data functionalities based on the arrays of the NumPy library . It allows you to easily read and write files in CSV, Excel format and specify queries to SQL databases .
- Support materials:
Its website has different documents such as the User's Guide , with detailed basic information and useful explanations, the Developer's Guide , which details the steps to follow when identifying errors or suggestions for improvements in functionalities, as well as the Reference Guide , with a detailed description of its API. In addition, it offers a series of tutorials contributed by the community and references on equivalent operations in other software and languages such as SAS, SQL or R.
Scikit-learn
- Description:
Scikit-Learn is a library that implements a large number of Machine Learning algorithms for classification, regression, clustering , and dimensionality reduction tasks . In addition, it is compatible with other Python libraries such as NumPy, SciPy and Matplotlib (Matpotlib is a data visualization library and as such is included in the previous article ).
- Support materials:
This library has different help documents such as an Installation Manual , a User's Guide or a Glossary of common terms and elements of its API . In addition, it offers a section with different examples that illustrate the features of the library, as well as other sections of interest with tutorials , frequently asked questions or access to its GitHub .
Scipy
- Description:
This library features a collection of mathematical algorithms and functions built on top of the NumPy extension . It includes extension modules for Python on statistics, optimization, integration, linear algebra or image processing, among others.
- Support materials:
Like the previous examples, this library also has materials such as Installation Guides , User Guides , Developer Guides or a document with detailed descriptions of its API . It also provides information on act , a tool for running GitHub actions locally.
Libraries for R
mlr
- Description:
This library offers essential components to develop machine learning tasks, among others, preprocessing, pipelining , feature selection, visualization and implementation of supervised and unsupervised techniques using a wide range of algorithms.
- Support materials:
On its website, it has multiple resources for users and developers, among which a reference tutorial stands out that presents an extensive tour that covers the basic aspects of tasks, predictions or data preprocessing to the implementation of complex projects using advanced functions.
In addition, it has a section that redirects to GitHub in which it offers talks, videos and workshops of interest on the operation and uses of this library.
Tidyverse
- Description:
This library offers a collection of R packages designed for data science that provide very useful functionality to import, transform, visualize, model and communicate information from data. They all share the same design philosophy, grammar, and underlying data structures. The main packages that make it up are: dplyr, ggplot2, forcats, tibble, readr, stringr, tidyr and purrr.
- Support materials:
Tidyverse has a blog where you can find posts about programming, packages or tricks and techniques to work with this library. In addition, it has a section that recommends books and workshops to learn how to use this library in a simpler and more enjoyable way.
Caret
- Description:
This popular library contains an interface that unifies hundreds of functions for training classifiers and regressors under a single framework , greatly facilitating all stages of preprocessing, training, optimization and validation of predictive models.
- Support materials:
The project website contains exhaustive information that makes it easier for the user to tackle the aforementioned tasks. References can also be found on CRAN and the project is hosted on GitHub . Some resources of interest for managing this library can be found through books such as Applied Predictive Modeling , articles , seminars or tutorials , among others.
Libraries to tackle Big Data tasks
TensorFlow
- Description:
In addition to Python and R, this library is also compatible with other languages such as JavaScript, C++ or Julia. TensorFlow offers the ability to build and train ML models using APIs . The most prominent API is Keras , which allows building and training deep learning models (Deep Learning).
- Support materials:
On its website you can find resources such as previously established and developed models and data sets, tools , libraries and extensions , certification programs , knowledge about machine learning or resources and tools to integrate responsible AI practices . You can access their GitHub page here .
Dmlc XGBoost
- Description:
Scalable, portable and distributed "Gradient Boosting" (GBM, GBRT, GBDT) library supports C ++, Python, R, Java, Scala, Perl and Julia programming languages . This library allows you to solve many data science problems quickly and accurately and can be integrated with Flink, Spark and other cloud data flow systems to tackle Big Data tasks.
- Support materials:
On its website it has a blog with related topics such as algorithm updates or integrations, as well as a documentation section that has installation guides, tutorials, frequently asked questions, a user forum or packages for the different programming languages. You can access their GitHub page via this link .
H20
- Description:
This library combines the main algorithms of Machine Learning and statistical learning with Big Data , as well as being able to work with millions of records. H20 is written in Java , and follows the Key/Value paradigm to store data and Map/Reduce to implement algorithms. Thanks to its API , it can be accessed from R, Python or Scala.
- Support materials:
It has a series of videos in the form of a tutorial to teach and facilitate its use for users. On its GitHub page you can find additional resources such as blogs , projects, resources, research papers, courses or books about H20 .
In this article we have offered a sample of some of the most popular libraries that offer versatile functionality to tackle typical data science and machine learning tasks, although there are many others . This type of library is constantly evolving thanks to the possibility it offers its users to participate in its improvement through actions such as contributing to code writing, generating new documentation or reporting errors. All this allows you to continuously enrich and refine your results.
If you know of any other bookstore of interest that you want to recommend, you can leave us a message in comments or send us an email to dinamizacion@datos.gob.es
Content prepared by the datos.gob.es team.